Watch the Market tutorial videos on YouTube
How to buy а trading robot or an indicator
Run your EA on
virtual hosting
virtual hosting
Test аn indicator/trading robot before buying
Want to earn in the Market?
How to present a product for a sell-through
Free Technical Indicators for MetaTrader 4 - 4

This custom indicator I designed for Metatrader 4 to be able to easily identify Eastern Standard Time (New York Local Time) from any metatrader 4 server. But, you can use this to identify your local time by changing the time zone from the drop down menu.
It allows you to add a vertical line of any color to any particular time in the selected time zone of your choice. It allows you to add Horizontal auto calculating Open, High, Low, and Close lines based on your selected time zone or your actual
FREE

Modified oscillator MACD. A classic indicator that combines a trend indicator with an oscillator to detect entry points. Has a multi-timeframe panel and 3 types of notifications
Benefits:
Works on all instruments and timeseries Trend indicator with oscillator for inputs Multi-period panel on all timeframes Pluggable arrows when signals appear Three types of notifications: push, email, alert
MT5 version -> HERE / Our news -> HERE
How the indicator works:
AW Classic MACD - Indicator of
FREE

Ride the Wave of Trends — Clear Signals for Confident Following In financial markets, the most stable profits often come from clear and established trends. However, even experienced traders know that riding the trend reliably is not always easy. Ride the Trend Signal is a signal-based indicator that focuses on trend-following entries, particularly on pullbacks and retracements. Instead of jumping into the early stages of a trend, this tool waits until the trend is established and then identifies
FREE
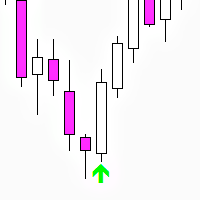
Three Bar Reversal (MT4) — free indicator Three Bar Reversal is a simple and effective MetaTrader 4 indicator that detects the classic three-bar reversal candlestick pattern with additional filtering based on ATR and candle body sizes.
Arrows are displayed on the last closed candle of the pattern, and push notifications are also sent. An automated trading robot Three Bar Reversal EA has been developed based on this indicator. The indicator works on all currency pairs and timeframes but pe
FREE
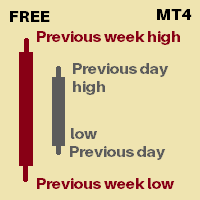
Its an indicator that will show you
Previous day high Previous day low Previous week high Previous week low You can set how many days of history you would like to see for previous day high low and previous week high low Currently 30 days of PDH/L will be marked 4 weeks of PWH/L will be marked You can change it from indicator settings. Dates are shown at marking lines to identify which date does that marking belongs to.
Thank you :) Always open to feedback and criticism if it helps me provide yo
FREE

A Fibonacci indicator is best used with other indicators like Pivots, Support/Resistance etc. Price tends to use Fibo levels as Support or Resistance lines. So, this indicator is very useful to know when price might reverse or if a level is crossed, price might continue the trend. Also, to find the best Take Profit and StopLoss lines. Don't use Fibo Indicator alone for trading as it might not always be accurate. Use it to make your strategies better as a supporting indicator.
Settings:
Auto Fib
FREE

This indicators automatically draws the Support and resistances levels for you once you've dropped it on a chart. It reduces the hustle of drawing and redrawing these levels every time you analysis prices on a chart. With it, all you have to do is dropped it on a chart, adjust the settings to your liking and let the indicator do the rest. But wait, it gets better; the indicator is absolutely free! Get the new and improved version here: https://youtu.be/rTxbPOBu3nY Parameters Time-frame -> T
FREE

FREE Heiken Ashi Smoothed indicator is fully adjustable, easy to use and comes with possibility to access the indicator via iCustom function so you can use it in your own trading software. Indicator can also pop up alerts when signal changes or send push notifications. For Metatrader 5 version click here: https://www.mql5.com/en/market/product/70825 For detailed information click: >>HERE<< Features
Easy to use Accessible via iCustom Fully adjustable Alerts and Push notifications Possib
FREE

This indicator can send alerts when a Heiken Ashi Smoothed color change occurs. Combined with your own rules and techniques, this indicator will allow you to create (or enhance) your own powerful system. Features Can send all types of alerts. Option to delay the alert one bar in order to confirm the color (trend) change. Input parameters Wait for candle close: 'true' or 'false'. Setting it to 'true' will delay the alert to the opening of the bar following the bar where the color change occurred.
FREE
AW Super Trend -This is one of the most popular classic trend indicators. It has a simple setting, allows you to work not only with the trend, but also displays the stop loss level, which is calculated by this indicator. Benefits:
Instruments: Currency pairs , stocks, commodities, indices, cryptocurrencies. Timeframe: М15 and higher. Trading time: Around the clock. Shows the direction of the current trend. Calculates the stop loss. It can be used when working with trading. Three types of noti
FREE

We provide indicators tailored to better meet your trading requirements. >> MT Magical <<
MT Supply Demand :
It is an indicator created to find supply and demand, which will be important support and resistance levels for the price. Supply Zone is a zone where the price has reached, it is often resisted. In other words, when the price reaches this zone, there will be more selling power to push the price back down.
Demand Zone is a zone where the price has reached, it is ofte
FREE

The indicator shows signals based on the terminal RSI oscillator on the chart. It is possible to filter out repeated signals.
Here the oscillator is used to search for a reverse signal. It is recommended as an entry point in swing strategies and trading from levels.
A multi-currency dashboard is available. With it, you can easily switch between charts. In product discussions, you can suggest an algorithm in which you can embed a dashboard.
Input parameters.
Main Settings. Bars Count – the n
FREE
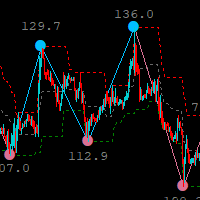
for noobs who dont read description : THE DOTS REPAINT AS THEY ARE BASED ON ZIGZAG ( DUUUH !!) BUT CHANNEL LINES DONT REPAINT. based on zigzag indicator , the zigzag high low channel indicator is a tool to alert the trader for a trend change , can also be used as dynamic support and resistance, ==========================
the indicator has multi time frame option to trade higher or lower time frames
channel on current time frame ,
============================================== Note: this indica
FREE
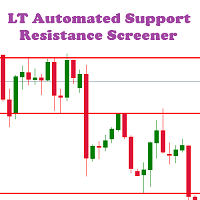
LT Automated Support Resistance Screener is a level indicator or a support resistance indicator that can be used to determine the level of support and resistance values. This indicator is free and easy to used in the Metatrader 4 platform which is built using the MQL4 programming language. Support resistance indicator is an important indicator that is often to used, but it is not available on the MT4 platform. This indicator can be used for all markets like forex, indices, gold etc and all time
FREE
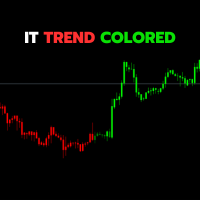
The IT Trend Colored indicator is a powerful tool designed by IT Trading (InfiniteTrades Software Corp) to assist traders in visually and effectively identifying market trends. This version is a custom indicator for the MetaTrader 4 trading platform.
Key Features:
• Trend Identification: The indicator uses a combination of simple moving averages (SMA) to determine the direction of the market trend.
• Intuitive Coloring: Upward trends are represented by bold green histograms, downward trends
FREE
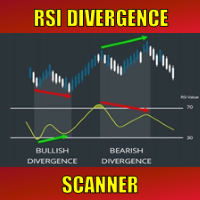
Special offer : ALL TOOLS , just $35 each! New tools will be $30 for the first week or the first 3 purchases ! Trading Tools Channel on MQL5 : Join my MQL5 channel to update the latest news from me In the dynamic financial markets, identifying trend reversal signals is essential for effective trading. The RSI Divergence Scanner is designed to help you detect RSI divergence signals across various currency pairs and timeframes accurately and efficiently. See more MT5 version at: R
FREE
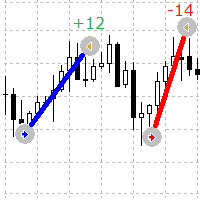
A simple yet useful indicator to visually see the entry and exit points of orders on the chart
This indicator shows current open orders and completed orders on symbol
Indicator parameters Lines Buy color - specifies color of lines for buy orders Lines Sell color - specifies color of lines for sell orders Lines Width - sets the line width, works for Solid style types Lines style - sets the style of lines Lines positive profit color - sets the color for positive profit texts Lines negative profit
FREE

VWAP Crossover Signal Indicator for MetaTrader 4 Unlock Precision Trading with the VWAP Crossover Signal Indicator! Elevate your trading strategy with the VWAP Crossover Signal Indicator , a powerful and intuitive tool designed for MetaTrader 4. Built for traders who demand accuracy and clarity, this custom indicator leverages the Volume Weighted Average Price (VWAP) to deliver actionable Buy and Sell signals directly on your chart. Perfect for day traders, scalpers, and swing traders, this ind
FREE

Unleash Your Trading Edge with TrendSight Pro! Tired of lagging indicators and confusing charts? TrendSight Pro: Signal Paint Engine is the solution you need. This smart indicator cuts through the market noise, giving you clear, high-probability trade signals right on your chart. It's designed to make your trading simpler, faster, and more profitable by combining quick momentum analysis with a powerful long-term trend filter. Key Advantages and Features Crystal-Clear Trade Signals: Forget compl
FREE

Smarter Trend Channel Indicator Description:
The Smarter Trend Channel Indicator is a powerful and adaptive tool designed to help traders visually identify key market trends by drawing dynamic support and resistance channels on the price chart. It uses advanced fractal calculations to plot trendlines that adjust based on market conditions, helping traders spot potential breakout zones and market turning points. Key Features: Customizable Trend Channel Display: Easily show or hide the trend chan
FREE

MP Squeeze Momentum is a volatility and momentum indicator derivated of "TTM Squeeze" volatility indicator introduced by John Carter. It capitalizes on the tendency for price to break out strongly after consolidating in a tight range. Introduction: The volatility component of MP Squeeze Momentum measures price compression using Bollinger Bands and Keltner Channels. If the Bollinger Bands are completely enclosed within the Keltner Channels, that indicates a period of very low volatility. This st
FREE

Monster reverse is a reverse trading indicator that gives powerful reversal points trades that have high probability to hit, the indicator doesn't repaint and signal is not delayed. Note : please combine the indicator with your system for best experience with the indicator indicator parameters : 1.signal periods 2.bands periods 3.arrow colors 4.alerts ----------
FREE

Индикатор MQLTA Supertrend Multi Timeframe сочетает в себе значения Supertrend, найденные на нескольких таймфреймах, чтобы подтвердить тренд пары. Для работы утилиты необходим бесплатный индикатор MQLTA Supertrend Line - https://www.mql5.com/en/market/product/25951.
Как он работает? Индикатор проверяет состояние Supertrend на всех выбранных таймфреймах и отображает результат в виде легко читаемой таблицы.
Как торговать с помощью индикатора Supertrend Multi Timeframe Покупку следует совершать,
FREE

Flag Pattern Indicator - Your Guide to Flagging Profitable Trade Setups Welcome to the world of precision trading with the "Flag Pattern Indicator." Designed for MetaTrader, this powerful tool is your go-to solution for identifying one of the most reliable and versatile chart patterns in technical analysis: the flag pattern. Whether you're a seasoned trader or just starting, this indicator simplifies the process of spotting flag patterns, giving you an edge in your trading decisions. Key Feature
FREE

Description: This indicator draw ZigZag Line in multiple time frame also search for Harmonic patterns before completion of the pattern.
Features: Five instances of ZigZag indicators can be configured to any desired timeframe and inputs. Draw Harmonic pattern before pattern completion. Display Fibonacci retracement ratios. Configurable Fibonacci retracement ratios. Draw AB=CD based on Fibonacci retracement you define. You can define margin of error allowed in Harmonic or Fibonacci calculations
FREE

AT LAST! A stochastic indicator for MT4 that shows multiple time frames on one chart ! See the actual position of the main and signal lines in 4 separate time frames instantly to help you make educated trading decisions.A true MTF stochastic indicator for traders that need to see visually what the indicator is telling them on multiple time frames, no arrows that just point up or down or numbers displayed. No more flicking between time frames to see where other stochastics are positioned! Stay on
FREE

Adjustable Fractal MT4 is a modification of Bill Williams' Fractals indicator. The fractal consists of a two sets of arrows - up (upper fractals) and down (lower fractals). Each fractal satisfies the following conditions: Upper fractal - maximum (high) of a signal bar exceeds or is equal to maximums of all bars from the range to the left and to the right; Lower fractal - minimum (low) of a signal bar is less or equal to minimums of all bars from the range to the left and to the right. Unlike a s
FREE

This indicator has been created for finding the probable reversal points of the symbol price. A small candlestick reversal pattern is used it its operation in conjunction with a filter of extremums. The indicator is not redrawn! If the extremum filter is disabled, the indicator shows all points that have a pattern. If the extremum filter is enabled, the condition works – if the history Previous bars 1 candles back contains higher candles and they are farther than the Previous bars 2 candle, such
FREE

If you are using the Inside Bar on Trading View, where spotting inside bars is easy and comforting, but found it missing in the MQL market – your search ends here. Why InsideBar Highlight? Easy as ABC: Inside bars made simple. Our tool focuses on the candle body, so you see what matters without any headaches. Your Style, Your Choice: Like it colorful or all the same? You decide. Spot upward or downward moves effortlessly. Fits Like a Glove: Our highlighting isn't just for show. It fits each c
FREE

as the name suggest Trend Maker Master is a trend scalping indicator that give long and short trading opportunity based on price action and ma style trend filter, the indicator Trend Period and Trend Extra Filter will change arrows signals quality and frequency, this leave a space for trader to come out with good combos for each pair. How to trade : Buy : when white buy arrow prints, set sl below recent swing low, and set tp to 1-1 Risk to reward ratio. Sell : when white Sell arrow prints, set
FREE
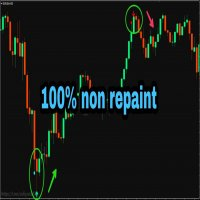
PLEASE NOTE You can customize the settings of K_period value, the oversold and the overbought value is customizable. You can change it as per your requirement. The accuracy will change as per your settings.
100% Non repaint indicator
Pre-alert (get ready) signals
Non-delay indications
24/7 signals
100% No lag
No recalculating The arrows wont repaint even if the signal fails, or you refresh or restart the mt4 Indicator is based on simple crossover strategy of main line and signal line of St
FREE

Necessary for traders: tools and indicators Waves automatically calculate indicators, channel trend trading Perfect trend-wave automatic calculation channel calculation , MT4 Perfect trend-wave automatic calculation channel calculation , MT5 Local Trading copying Easy And Fast Copy , MT4 Easy And Fast Copy , MT5 Local Trading copying For DEMO Easy And Fast Copy , MT4 DEMO Easy And Fast Copy , MT5 DEMO 砖图Renko PRO->>>
The display of the brick map on the main map.
The Renko chart ideally remove
FREE
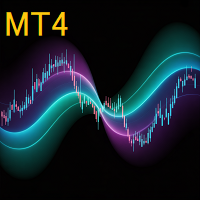
AP VWAP Bands Pro (MT4) Volume-weighted average price with ±σ bands for clear intraday bias, mean-reversion zones, and dynamic support/resistance. Works on crypto (incl. BTC), FX, indices, and metals. Uses tick-volume when real volume isn’t available.
What it shows VWAP line (volume-weighted mean price).
Two envelopes around VWAP (default ±1σ and ±2σ) to highlight balance vs. extension.
Reset modes: Day, Week, or Anchor Time (HH:MM) to start VWAP where you need it (e.g., exchange open).
Why
FREE

This indicator represents a genuine momentum oscillator according to the true definition of "Momentum", and as realised by the techniques of digital filtering. ( Note : download a complete set of true momentum oscillators here ). A scholarly paper on the subject by the current developer can be found here , but in this description we shall borrow only the minimum of conceptual and mathematical framework needed. In the process, we expose some long-held myths about indicators supposedly measurin
FREE
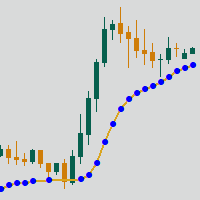
Adaptive Moving Average (AMA) is a trend indicator using moving average and market noise filter. Indicator feature are blue and red points, showing the power of trend. Recommendations for trading: Auxiliary Indicator Detecting trend Detecting power of trend Detecting potential reversal points Main indicator Shows entry points for swing trading Serves as dynamic support and resistance Recommendations for use: Any instrument Any timeframe Input parameters: Period - AMA period Fast Period - fast
FREE

After purchasing the Tpx Dash Supply Demand indicator, you must download this indicator which will link and feed market data to the Tpx Dash Supply Demand indicator and will provide all Supply Demand price signals, ATR Stop, VAH and VAL, trend values with the ADX, and POC prices and locations in the market. Just download it and Dash will locate the indicator to retrieve the information!
FREE

Sentinel Arrow Key Features:
⊗An exclusive algorithm for quickly and accurately identifying trends, reversals, and momentum changes. ⊗Designed for professional use, it features robust signal logic that eliminates delays or false updates. ⊗Suitable for various timeframes. ⊗Does not redraw, delete, or modify past signals. ⊗All BUY and SELL signals are generated on the candlestick itself and remain fixed. ⊗In real trading, there is no redrawing—signals appear instantly on the candlestick itself.
FREE

Head and Shoulders Pattern Indicator - Your Key to Recognizing Trend Reversals Unlock the power of pattern recognition with the "Head and Shoulders Pattern Indicator." This cutting-edge tool, designed for MetaTrader, is your trusted ally in identifying one of the most powerful chart patterns in technical analysis. Whether you're a novice or an experienced trader, this indicator simplifies the process of spotting the Head and Shoulders pattern, allowing you to make informed trading decisions. Key
FREE

The MACD Signal Candle indicator changes color according to the MACD trends. Colored Candles, based on MACD.
HOW IT WORKS
For a Buy: -If the indicator is above zero, the market is bullish. -If the market is bullish, you can take a stand with green candle signals. For a Sell: -If the indicator is below zero, the market is bearish. -If the market is bearish, you can take a stand with the red candles.
FREE

Check my p a id tools they work perfect please r ate Adjustable PIN BAR indicator is usefull tool alowing to search for pin bars you wish to find on the price chart, it has 2 parameters to filter out what type of pin bars you wish to search for: 1) MinTailProc 75% (default) which means to show pin bars that has minimum size of the Nose (Tail) as 75% of full candle size. If Upper Nose (Tail) size of the candle is minimum 75% of the candle size fully than candle is painted in RED. If Lower Nose
FREE

RT_TrendlineTool : Semi-AutoTrendline Tool on MT4 2 easy steps, just press the [T] button on your keyboard and click on the Swing High/Low that you're interested.
Then the indicator will try to draw a trendline that runs through only the wick, not cut through candlestick's body
and try to cross the swing point as much as possible with the least slope of the trendline. You can draw up to 10 trendlines.
You are able to get alert when price breakout these trendlines. Additional Hotkey : Press [M]
FREE
Volume Decomposition Index (VDI) VDI is a proprietary volume analysis indicator designed to identify the strength and direction of price movement based on the decomposition of volume into buying and selling activity. The indicator visualizes the ratio between buys and sells by projecting candlestick price data onto its volume, allowing traders to gain a more comprehensive view of market dynamics — namely, how much volume was driven by buyers and how much by sellers. Calculations are based on al
FREE
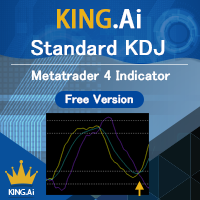
The standard KDJ indicator is presented by KING.Ai. This indicator were built base on the the theory of KDJ . KDJ is a very effective and useful strategy to trade especially in swing trading. Method to apply (please also refer to the graphic): 80/20 rule: Price from bottom to top 20 to 80. And price from top to bottom 80 to 20. Both is enter market signal. Indicator period: The indicator is made by period 9,3,3 KING.Ai Forex trader believe that such strategy must complement with other indicato
FREE
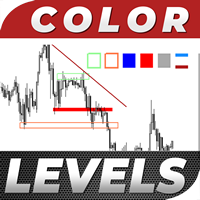
Color Levels is a convenient tool for traders using a Trendline and a Rectangle in their technical analysis. It allows setting two empty rectangles, three filled ones, and two tredlines. The indicator parameters are very simple and divided into numbered blocks: The ones beginning with 1 and 2 - empty rectangle (frame) parameters; 3, 4, and 5 - filled rectangle parameters; 6 and 7 - trendline parameters. Simply click a desired object and it will appear in the upper left corner. Main Adjustable Pa
FREE

Heikin Ashi Smoothed – MT4 Indicator Heikin Ashi Smoothed is a custom indicator for MetaTrader 4 (MT4) that enhances the traditional Heikin Ashi candlestick chart by applying an additional smoothing process using moving averages. This approach creates a much clearer visual representation of trends, significantly reducing chart noise and making it easier to identify the prevailing market direction as well as potential reversals. Main Features Displays smoothed Heikin Ashi candlesticks on the char
FREE
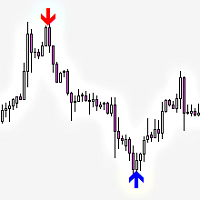
Railway Tracks Pattern — Reversal Pattern Indicator Railway Tracks Pattern is an indicator that automatically detects a powerful two-candle reversal pattern on the chart. It looks for two candles with opposite directions (bullish and bearish), similar in size, and with minimal wicks — a clear sign of momentum shift. How it works: The first candle is strong and directional. The second candle moves in the opposite direction and is of similar size. Both candles have small shadows (wicks). The
FREE
Streamline your trading analysis with the Day and Week Separator MT4, an intuitive tool designed to plot customizable daily and weekly separator lines, perfect for traders navigating broker time zone differences. Widely appreciated in trading communities like Forex Factory and Reddit’s r/Forex for its simplicity and effectiveness, this indicator addresses the common challenge of aligning chart timeframes with local or market-specific times, as highlighted in discussions on platforms like Invest
FREE
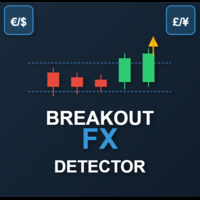
This is a powerful, session-aware breakout indicator designed for serious traders who thrive on volatility and structure. Engineered for precision, it identifies high-probability breakout zones during the London and New York trading sessions—where the market moves with intent. Key Features: Session Range Detection
Automatically detects and highlights the key price range of London and New York sessions. Breakout Confirmation
Identifies breakout candles after the session range, with cl
FREE
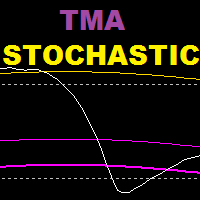
TMA Stochastic is an indicator based on stochastic oscillator and tma bands indicator , this indicator is based on a reversal strategy . Recommended time frame : 15 and above Recommended settings : lower values for scalping , higher values for swing trading Try the free version : https://www.mql5.com/en/market/product/108379 ======================================================================= Parameters : tma history : how many bars back to show tma bands on stochastic K period (Stochasti
FREE

Is This tools use able for free in Forex market ?
Accuracy Meter is useful and also free product, i made this product for free because i believe that any seller must have some good products for free not just release bad products as free tools.
What does Green koala logo mean :
Means Free Products , i ll release my free products by green koala logo, so when you see green koala, it means new free products is access able for you.
Accuracy Meter Introduction :
Accuracy Meter is powerful tool to
FREE
Trading Sessions 3: Visualize Global Market Activity Trading Sessions 3 is an intuitive indicator designed to clearly display the key intra-day trading sessions: Asia, London, and New York . Gain a clear understanding of global market activity and pinpoint periods of increased volatility for strategic trading decisions. Key Features: Global Session Visualization: Easily identify the active trading hours for the Asia, London, and New York sessions directly on your charts. Volatility Insights: Un
FREE

The indicator displays the probable ( Support and resistance ) levels. The indicator draws horizontal and trend levels of support and resistance. The indicator settings: Trends - the mode for displaying trend lines or horizontal lines of support and resistance Yes - display trend lines only No - display horizontal lines only UseResource - use the resources built into the indicator. Yes - use the ZigZag indicator from the resources of the product. No - use a custom ZigZag indicator. HistoryBar -
FREE
Achieve Trading Precision with Perfect Entry Signal ! Stop guessing and start trading with confidence! The Perfect Entry Signal indicator cuts through the market noise, giving you clear, high-probability entry points. Built on a powerful, non-lagging moving average and filtered by the gold-standard EMA 200, this tool is designed to catch trends early and confirm your trading direction. It's not just a line on your chart—it's your personalized trading edge, delivering immediate, actionable si
FREE

Necessary for traders: tools and indicators Waves automatically calculate indicators, channel trend trading Perfect trend-wave automatic calculation channel calculation , MT4 Perfect trend-wave automatic calculation channel calculation , MT5 Local Trading copying Easy And Fast Copy , MT4 Easy And Fast Copy , MT5 Local Trading copying For DEMO Easy And Fast Copy , MT4 DEMO Easy And Fast Copy , MT5 DEMO "Cooperative QQ:556024" "Cooperation wechat:556024" "Cooperative email:556024@qq.com" Strong
FREE
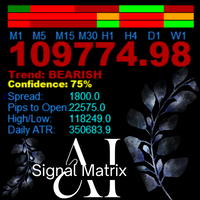
AanIsnaini Signal Matrix Multi-Timeframe Confidence Signal Dashboard AanIsnaini Signal Matrix is a powerful all-in-one indicator that analyzes market direction and confidence levels across multiple timeframes — allowing traders to see the overall bias of the market at a single glance. It combines signals from Price Action , Support–Resistance , and several proven technical tools (MACD, ADX, RSI, MA slope, ATR, and Volume Ratio), then calculates a confidence score showing how strongly th
FREE

BeST Oscillators Collection is a Composite MT4 Indicator including the Chaikin,Chande and TRIX Oscillators which by default are contained in MT5 but not in MT4 platform. It also provides the option of displaying or not a Mov. Avg. as a Signal Line and the resulting Signals as Arrows in a Normal (all arrows) or in a Reverse Mode (without showing up any resulting successive and of same type arrows). Analytically for each one of the specific Oscillators: The Chaikin Oscillator ( CHO ) is
FREE

Pivot trading:
1.pp pivot
2. r1 r2 r3, s1 s2 s3 Necessary for traders: tools and indicators Waves automatically calculate indicators, channel trend trading Perfect trend-wave automatic calculation channel calculation , MT4 Perfect trend-wave automatic calculation channel calculation , MT5 Local Trading copying Easy And Fast Copy , MT4 Easy And Fast Copy , MT5 Local Trading copying For DEMO Easy And Fast Copy , MT4 DEMO Easy And Fast Copy , MT5 DEMO
Strongly recommend trend indicators, auto
FREE

The indicator displays volume profiles based on the nesting principle. Profiles periods are pre-set so that each subsequent profile has a length twice as long as the length of the previous profile. In addition to profiles, the indicator displays volume clusters sorted by color, depending on the volume they contain.
Indicator operation features The indicator works on typical timeframes from M5 to MN, but for calculations uses historical data from smaller timeframes: M1 - for timeframes from M5
FREE

BeST_Gann Hi-Lo Strategy is an MT4 indicator that is based on the Gann Hi-Lo Activator the famous trend-following indicator that allow us to to enter a trade quite early while also stay in a trade as longer as we can for taking profit.While it is built of a moving average it helps traders determine the direction of the trends and to produce with-trend trading signals.
This indicator is in fact a simple moving average of the highs and lows of the previous period. It follows the trends in the mark
FREE

This indicator allows you to manage your exposure and see how the lot changes. You can choose the optimal lot value for your deposit without opening real positions. And also evaluate new trading instruments. If you trade manually, then risk management will help you avoid unexpected losses. The indicator includes the ability to receive a sound signal when a specified level is reached, as well as send push notifications and a message to the mail.
FREE

MQLTA Support Resistance Lines is an indicator that calculates the historical levels of Support and Resistance and display them as Lines on chart. It will also Alert you if the price is in a Safe or Dangerous zone to trade and show you the distance to the next level. The indicator is ideal to be used in other Expert Advisor through the iCustom function. This indicator can be tested LIVE on AUDNZD with the following DEMO https://www.mql5.com/en/market/product/26572
How does it work? The indicato
FREE
Candle Timer Indicator is a custom tool designed for the MetaTrader 4 (MQL4) trading platform. Its primary purpose is to display a moving timer on the chart, indicating the remaining time before the current candle closes. This feature is particularly useful for traders who need precise tracking of candle closing times for their technical analysis strategies. My indicators for free. I onl
FREE
Keltner Signals Pro: Trade Smarter, Earn More! Keltner Signals Pro Now available in EA format. Download Now. Boost your trading accuracy and eliminate false signals with Keltner Signals Pro – the advanced yet intuitive indicator designed for serious traders seeking consistent profits! Tired of misleading trading signals? Keltner Signals Pro masterfully combines the power of Keltner Channels for identifying crucial price breakouts with an unbeatable EMA200 Trend Filter . The result? More accurate
FREE

The Penta-O is a 6-point retracement harmonacci pattern which usually precedes big market movements. Penta-O patterns can expand and repaint quite a bit. To make things easier this indicator implements a twist: it waits for a donchian breakout in the right direction before signaling the trade. The end result is an otherwise repainting indicator with a very reliable trading signal. The donchian breakout period is entered as an input. [ Installation Guide | Update Guide | Troubleshooting | FAQ | A
FREE
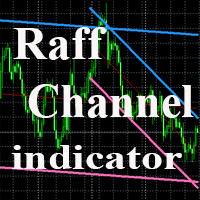
The indicator plots a trend channel using the technique by Gilbert Raff. The channel axis is a first-order regression. The upper and lower lines show the maximum distance the Close line had moved away from the axis line. Therefore, the upper and lower lines can be considered as resistance and support lines, respectively. A similar version of the indicator for the MT5 terminal
As a rule, most movements of the price occur within a channel, going beyond the support or resistance line only for a sh
FREE

The ZUP is based on two ideas. Idea 1 - combine a variety of methods for identifying extremums (minimums and maximums) on the market price charts in a single indicator. Idea 2 - make it possible to easily bind various graphical tools, which allow to analyze the market behavior, to the identified extremums. To implement the first idea , the following has been made in the indicator. Included multiple ZigZag algorithms. Standard ZIGZAG algorithm. The basis of this algorithm is taken from the ZigZag
FREE
Conquer the Markets with the Triple Threat Signal ! Tired of signals that leave you guessing? Introducing the Triple Threat Signal , the smart indicator that cuts through market noise to deliver high-probability trade setups. This isn't just another indicator; it's a complete, multi-layered system designed for traders who demand precision, confirmation, and confidence . Why You Need the Triple Threat Signal The market moves fast. You need a tool that confirms a trade from multiple angles before
FREE
Product Title Smart ZigZag (MT4) – part of the SmartView series
See also >> Smart ZigZag Pro Short Description A new-generation ZigZag indicator for MT4 with an on-chart Smart Control Panel, one-click visibility management, dynamic buffer value display on hover, and a modern inputs window. Features Dual‑color ZigZag that solves the single‑line color limitation; designed to work seamlessly with the full SmartView Indicators series. Overview Smart ZigZag focuses on user experience: a compact pa
FREE
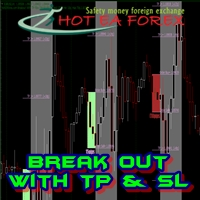
How To Trade
Execute your trades in 3 Easy Steps!
Step 1: Trade Setup Entry Buy in Signal price and TP1 in price indicator, You can use trailing stop in TP1. Entry Sell in Signal price and TP1 in price indicator, You can use trailing stop in TP1. Success Rate ≥ 75% 100:25 Step 2: Set Stop Loss Stop loss BUY ----> You can set stop loss on Line Order SELL. Stop loss SELL ----> You can set stop loss on Line Order BUY. Step 3: Set Take Profit Option 1: Take profit on TP1. Option 2: Partial take pr
FREE

The indicator display the maximum horizontal volume on the selected timeframe. Based on the UPD1 Volume Box indicator . The lines can be connected or separated. In the settings, you can enable smart touch alert. Such an indicator will be useful for those who trade according to the market profile and the concept of smart money.
Input parameters.
Main Settings. Bars Count - indicate the number of bars on which the TF POC will be drawn. Data Source - the time frame from which the ticks will be u
FREE
The MetaTrader Market is the best place to sell trading robots and technical indicators.
You only need to develop an application for the MetaTrader platform with an attractive design and a good description. We will explain you how to publish your product on the Market to offer it to millions of MetaTrader users.
You are missing trading opportunities:
- Free trading apps
- Over 8,000 signals for copying
- Economic news for exploring financial markets
Registration
Log in
If you do not have an account, please register
Allow the use of cookies to log in to the MQL5.com website.
Please enable the necessary setting in your browser, otherwise you will not be able to log in.