MetaTrader 4용 무료 기술 지표 - 4

TradingView에서 Inside Bar를 사용하여 Inside Bars를 쉽게 찾고 편안하게 느끼지만 MQL 시장에서 찾을 수 없다면, 당신의 검색이 여기서 끝납니다. InsideBar Highlight의 특징: ABC만큼 간단: Inside Bars 간단히 만들기. 저희 도구는 어려움 없이 중요한 내용이 보이도록 캔들 본체에 중점을 둡니다. 당신의 스타일, 당신의 선택: 다양한 색상이 좋습니까 아니면 전부 동일한 색이 좋습니까? 당신이 결정합니다. 상승 또는 하락 움직임을 쉽게 확인하세요. 맞춤화가 완벽하게 맞아 떨어집니다: 우리의 강조는 보기 좋을 뿐만 아니라 각 캔들에 완벽하게 맞아 떨어져 차트를 깔끔하고 읽기 쉽게 만듭니다. 도움의 손길: 도구 사용에 어려움이 있거나 질문이 있다면 언제든지 문의하세요. 당신의 메시지는 환영받을 뿐만 아니라 우리는 필요한 모든 것을 도울 준비가 되어 있습니다. InsideBar Highlight 4는 단순한 도구가 아니라 질문과 경험이 중
FREE
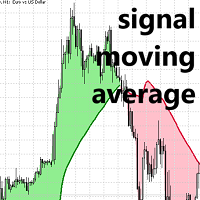
MT5용 신호 이동 평균 Lux 알고리즘
이동 평균 교차 시스템에서 신호선 사용을 위해 특별히 설계된 고유한 이동 평균 지표를 만나보세요. 이 고급 도구는 범위가 좁은 시장에서는 가격에서 벗어나는 반면, 추세가 있는 시장에서는 표준 이동 평균을 면밀히 반영한다는 점에서 차별화됩니다. 이러한 특징은 트레이더가 시장 변동으로 인한 불필요한 노이즈와 잠재적인 과매도를 방지하는 데 도움이 됩니다.
이동 평균은 범위가 좁은 시장에서는 가격에서 벗어나고, 추세가 있는 시장에서는 일반 이동 평균값에 도달합니다.
이동 평균 교차 전략은 일반적인 추세를 파악하는 데 사용되는 느린 이동 평균인 "신호선"에 의존하는 경우가 많습니다. 이 신호선은 빠른 이동 평균과 함께 사용되어 일반 가격과 신호선의 교차에서 발생할 수 있는 휩소 거래를 걸러냅니다.
제안된 지표는 범위가 좁은 기간 동안 가격에서 벗어나지 않으므로 가격과 신호선 사이에 발생하는 교차 횟수를 효과적으로 줄일 수 있습니다.
가격과
FREE
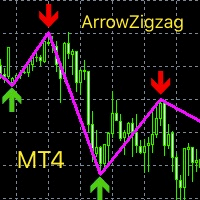
This index is based on the secondary development of zigzag, adding high and low point arrow indication, thickening the line and changing the color. Can be a good display of the current admission trading signals, current long or short. It can be combined with other indicators to determine the trading point, which has great reference value. Compared with the general trend index or oscillation batch standard, the accurate determination is higher from the perspective of historical data research and
FREE

indicators to facilitate analysis based on Oma Ally's BBMA strategy by displaying CSAK (CSD), CSM and Extreme labels on the chart 1. Displays the Bollinger Band line 2. LWMA 5-10 High and Low 3. EMA 50 4. Fibonacci 5. MHV . area 6. Alert & Show labels BBMA consists of the use of 2 indicators: Moving Averages Bollinger Bands BBMA consists of 3 types of entries: Extreme MHV Re-Entry Moving Average Settings: There are 5 MAs used in the system: 2 High Moving Averages, 2 Low Moving Averages and
FREE
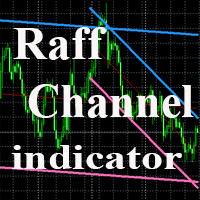
The indicator plots a trend channel using the technique by Gilbert Raff. The channel axis is a first-order regression. The upper and lower lines show the maximum distance the Close line had moved away from the axis line. Therefore, the upper and lower lines can be considered as resistance and support lines, respectively. A similar version of the indicator for the MT5 terminal
As a rule, most movements of the price occur within a channel, going beyond the support or resistance line only for a sh
FREE

MarketSessions Indicator The Essential Tool for Global Market Session Visualization The MarketSessions indicator is a powerful MT4 tool designed to help traders visualize major forex market sessions directly on their charts. By clearly displaying the active trading hours of Sydney, Tokyo, London, and New York markets, this indicator helps you identify optimal trading periods and understand market volatility patterns. Key Features: Clear visualization of all four major trading sessions (Sydney, T
FREE
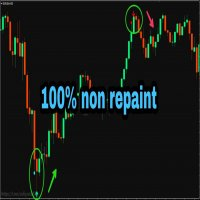
PLEASE NOTE You can customize the settings of K_period value, the oversold and the overbought value is customizable. You can change it as per your requirement. The accuracy will change as per your settings.
100% Non repaint indicator
Pre-alert (get ready) signals
Non-delay indications
24/7 signals
100% No lag
No recalculating The arrows wont repaint even if the signal fails, or you refresh or restart the mt4 Indicator is based on simple crossover strategy of main line and signal line of St
FREE

Detect strength for uptrends and downtrends by tracking Buy Power and Sell Power. Stay on the right side of the market by being able to determine whether the market is in a bull or bear trend and how strong the trend is.
Free download for a limited time! We hope you enjoy, with our very best wishes during this pandemic!
Trend Trigger Factor aims to ride out sideways movement, while positioning the trader in the correct side of the market to capture big trends when they occur. It was origin
FREE

Zig Zag 123 tells us when a reversal or continuation is more likely by looking at the shift in supply and demand. When this happens a signature pattern appears known as 123 (also known ABC) will often break out in direction of higher low or lower high.
Stop loss and take profit levels have been added. There is a panel that shows the overall performance of your trades for if you was to use these stop loss and take profit levels.
We get alerted if a pattern 123 appears and also if the price re
FREE
트레이딩 세션 3: 글로벌 시장 활동 시각화 트레이딩 세션 3 는 주요 일중 거래 세션인 아시아, 런던, 뉴욕 을 명확하게 표시하도록 설계된 직관적인 MQL5 지표입니다. 글로벌 시장 활동을 명확하게 이해하고 전략적인 거래 결정을 위해 변동성 증가 기간을 정확히 파악하십시오. 주요 기능: 글로벌 세션 시각화: 차트에서 아시아, 런던, 뉴욕 세션의 활성 거래 시간을 쉽게 식별할 수 있습니다. 변동성 통찰력: 각 세션 동안 어떤 통화가 일반적으로 가장 중요한 가격 변동을 경험하는지 이해하십시오. 아시아 세션: AUD, NZD 및 JPY 통화 쌍에서 종종 더 높은 변동성을 보입니다. 런던 세션: GBP 및 EUR 통화 쌍의 변동성 증가가 특징입니다. 뉴욕 세션: USD 는 일반적으로 이 세션 동안 가장 변동성이 큰 통화입니다. 사용자 정의 가능한 거래 시간: 유연한 HH:MM 입력 필드를 사용하여 세션 시간을 특정 요구 사항에 맞게 조정하십시오. 선택 가능한 표시 요일: 집중적인 분석을
FREE

A Fibonacci indicator is best used with other indicators like Pivots, Support/Resistance etc. Price tends to use Fibo levels as Support or Resistance lines. So, this indicator is very useful to know when price might reverse or if a level is crossed, price might continue the trend. Also, to find the best Take Profit and StopLoss lines. Don't use Fibo Indicator alone for trading as it might not always be accurate. Use it to make your strategies better as a supporting indicator.
Settings:
Auto Fib
FREE
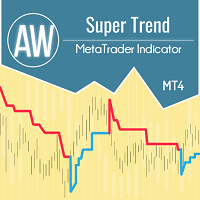
AW 슈퍼 트렌드 - 이것은 가장 인기 있는 클래식 트렌드 지표 중 하나입니다. 그것은 간단한 설정을 가지고 있으며 추세로 작업할 수 있을 뿐만 아니라 이 표시기로 계산되는 손절매 수준도 표시합니다. 이익:
악기: 통화 쌍 , 주식, 상품, 지수, 암호 화폐. 기간: М15 이상. 거래 시간: 24시간 내내. 현재 추세의 방향을 보여줍니다. 손절매를 계산합니다. 거래를 할 때 사용할 수 있습니다. 세 가지 유형의 알림: 푸시, 이메일, 경고. MT5 버전 -> 여기 / 뉴스 -> 여기 기능:
- 표시기는 해당 색상으로 현재 추세 방향을 표시합니다.
- 파란색은 현재 기간에 사용된 기호의 상승 추세를 나타냅니다.
- 선의 빨간색은 선택한 기호에서 사용된 기간의 하락 추세를 나타냅니다.
표시기를 사용하여 StopLoss를 설정할 수 있습니다.
표시선은 막대 위에 표시되지 않고 막대를 기준으로 약간 이동하여 표시됩니다. 추세선이 표시되는 이 곳은 트
FREE

Bitcoin Trader Pro Indicator is an advanced tool specifically designed for analyzing the cryptocurrency market, with a focus on BTCUSD. This indicator combines multiple technical analysis methods to generate precise and reliable trading signals. Perfect for both beginner and experienced traders, the Bitcoin Trader Pro Indicator provides everything you need to make informed trading decisions. My indicators for free. I only ask that leave your feedback to help me improve them or as a thank you. H
FREE
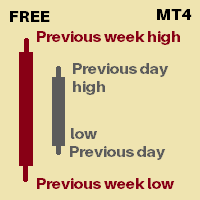
Its an indicator that will show you
Previous day high Previous day low Previous week high Previous week low You can set how many days of history you would like to see for previous day high low and previous week high low Currently 30 days of PDH/L will be marked 4 weeks of PWH/L will be marked You can change it from indicator settings. Dates are shown at marking lines to identify which date does that marking belongs to.
Thank you :) Always open to feedback and criticism if it helps me provide yo
FREE
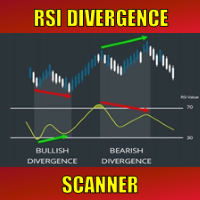
Special offer : ALL TOOLS , just $35 each! New tools will be $30 for the first week or the first 3 purchases ! Trading Tools Channel on MQL5 : Join my MQL5 channel to update the latest news from me 역동적인 금융 시장에서 추세 반전 신호를 식별하는 것은 효과적인 거래에 필수적입니다. RSI Divergence Scanner는 다양한 통화 쌍과 시간대에서 RSI 다이버전스 신호를 정확하고 효율적으로 감지하도록 설계되었습니다. MT5 버전 자세히 보기: RSI Divergence MT5 Scanner 더 많은 제품 보기: 모든 제품 1. RSI 다이버전스 이해하기 RSI (상대 강도 지수) 는 가격 모멘텀을 측정하는 기술 지표로, 트레이더들 사이에서 널리 사용됩니다. RSI 다이버전스는 가격 움직임과
FREE

Modified oscillator MACD. A classic indicator that combines a trend indicator with an oscillator to detect entry points. Has a multi-timeframe panel and 3 types of notifications
Benefits:
Works on all instruments and timeseries Trend indicator with oscillator for inputs Multi-period panel on all timeframes Pluggable arrows when signals appear Three types of notifications: push, email, alert
MT5 version -> HERE / Our news -> HERE
How the indicator works:
AW Classic MACD - Indicator of
FREE
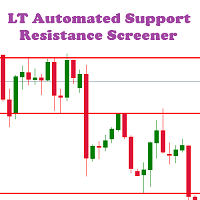
LT Automated Support Resistance Screener is a level indicator or a support resistance indicator that can be used to determine the level of support and resistance values. This indicator is free and easy to used in the Metatrader 4 platform which is built using the MQL4 programming language. Support resistance indicator is an important indicator that is often to used, but it is not available on the MT4 platform. This indicator can be used for all markets like forex, indices, gold etc and all time
FREE

Auto Fibonacci Retracement Indicator — Flexible and Reliable This is not just another Auto Fibonacci Retracement indicator — it’s one of the most flexible and dependable tools available . If you find it useful, please leave a review or comment to support the project. Check out my other helpful tools below: Timeframes Trend Scanner - Scan the trend of assets in difference timeframes with multiple indicators
Market Trend Scanner - Scan the trend of multiple-assets in with multiple indicators
FREE

이 표시기는 차트의 터미널 오실레이터를 기반으로 신호를 표시합니다. 반복되는 신호를 필터링 할 수 있습니다.
여기서 오실레이터는 역 신호를 검색하는 데 사용됩니다. 스윙 전략 및 거래 수준에서 진입 점으로 권장 됩니다.
다중 통화 대시 보드를 사용할 수 있습니다. 그것으로,당신은 쉽게 차트 사이를 전환 할 수 있습니다. 제품 토론에서 대시보드를 포함할 수 있는 알고리즘을 제안할 수 있습니다.
입력 매개변수.
기본 설정. Bars Count – 표시기가 작동하는 히스토리 바의 수. RSI Period – 발진기 기간. RSI Level – 발진기의 레벨. 오실레이터는 0 에서 100 사이입니다. 당신이 10 를 선정하는 경우에,신호는 10 의 위 그리고 90 이하 일 것입니다. RSI Applied Price. Repeat Signal - 반복 신호. Enable – 모든 반복 신호는 화살표/아이콘이 될 것입니다. No Signal – 반복되는 모든 것들은 무시됩니다.
시각
FREE

Velocity Trend Sniper Stop chasing the market. Start anticipating it. Are you tired of indicator that react too late? Do you find yourself entering a trade just as the trend is ending? Velocity Trend Sniper is the solution you have been waiting for. This is not just another indicator; it is a precision trading system. By combining advanced Zero-Lag Technology with a smart EMA Trend Filter , Velocity Trend Sniper gives you the earliest possible entry signals while keeping you safe from choppy, f
FREE

Heikin Ashi Smoothed – MT4 인디케이터 Heikin Ashi Smoothed 는 MetaTrader 4(MT4)용 맞춤형 인디케이터로, 전통적인 Heikin Ashi(평균가) 캔들 차트에 이동평균 기반의 추가적인 스무딩 과정을 적용합니다. 이 방식은 차트의 노이즈를 크게 줄이고, 추세의 방향성을 훨씬 더 명확하고 부드럽게 시각화하여 시장의 주요 흐름과 반전 신호를 쉽게 포착할 수 있게 해줍니다. 주요 특징 계산된 Heikin Ashi 값을 추가 이동평균으로 한 번 더 스무딩하여 차트에 부드러운 캔들 형태로 표시 작은 가격 변동과 그림자(윅)를 효과적으로 필터링하여 주요 추세가 즉시 눈에 띄게 표현됨 추세 전환 포착이 쉬워지며, 시장의 노이즈에 의한 불필요한 매매 신호를 줄여줌 모든 타임프레임과 상품(외환, CFD, 지수 등)에 적용 가능 가볍고 효율적이어서 여러 차트나 시간대에 동시에 사용해도 MT4 성능 저하가 거의 없음 작동 원리 Heikin Ashi Smoo
FREE

핍스 헌터 프로는 수년에 걸쳐 개발되었으며 이전 버전보다 개선된 버전입니다. 이 강력한 지표는 시장과 가격 이력을 분석하여 매수 및 매도 항목을 생성합니다. 이러한 항목의 계산을 위해 함께 작동하는 다양한 지표와 덜 유리한 항목을 필터링하고 제거하는 복잡한 통계 로그를 사용합니다 / MT5 버전 .
특징 다시 칠하지 않음
이 인디케이터는 새 데이터가 도착해도 값이 변경되지 않습니다
지연 없음 이 표시기는 지연되지 않습니다 거래 쌍
모든 외환 쌍 (가급적 EURGBP)
타임프레임
모든 차트주기
매개변수 ===== 표시 =====
화살표 거리 // 신호(화살표)와 캔들스틱 사이의 거리
===== 알림 =====
팝업 알림 // MT4 터미널용 알림
푸시 알림 알림 // 휴대폰용 알림
이메일 알림 // 이메일 알림
===== 차트 설정 =====
차트에서 캔들 스틱의 색상을 변경하는 옵션
경고 저는 MQL5.com에서만 제품을 판매합니다. 누군가 내
FREE

Necessary for traders: tools and indicators Waves automatically calculate indicators, channel trend trading Perfect trend-wave automatic calculation channel calculation , MT4 Perfect trend-wave automatic calculation channel calculation , MT5 Local Trading copying Easy And Fast Copy , MT4 Easy And Fast Copy , MT5 Local Trading copying For DEMO Easy And Fast Copy , MT4 DEMO Easy And Fast Copy , MT5 DEMO 砖图Renko PRO->>>
The display of the brick map on the main map.
The Renko chart ideally remove
FREE

Adjustable Fractal MT4 is a modification of Bill Williams' Fractals indicator. The fractal consists of a two sets of arrows - up (upper fractals) and down (lower fractals). Each fractal satisfies the following conditions: Upper fractal - maximum (high) of a signal bar exceeds or is equal to maximums of all bars from the range to the left and to the right; Lower fractal - minimum (low) of a signal bar is less or equal to minimums of all bars from the range to the left and to the right. Unlike a s
FREE
Day and Week Separator MT4로 거래 분석을 간소화하세요. 사용자 지정 가능한 일일 및 주간 분리선을 그리는 직관적인 도구로, 브로커의 타임존 차이를 다루는 트레이더에게 이상적입니다. Forex Factory와 Reddit의 r/Forex와 같은 거래 커뮤니티에서 간단함과 효율성으로 높이 평가받으며, Investopedia와 TradingView 같은 플랫폼에서 논의된 바와 같이 차트 타임프레임을 로컬 또는 시장별 시간과 정렬하는 일반적인 문제를 해결합니다. 트레이더들은 차트 명확성을 향상시키는 능력을 칭찬하며, 세션을 명확히 표시함으로써 세션 기반 분석이 개선되고 거래 계획이 최대 20% 향상되었다고 보고합니다, 특히 타임존 오프셋이 큰 지역(예: 유럽 브로커를 사용하는 아시아 태평양 트레이더)에서 유용합니다. 이점으로는 일일 및 주간 시장 전환의 정확한 시각화, 로컬 또는 전략적 시간에 맞춘 사용자 지정 가능한 시간 오프셋, 모든 거래 설정에 원활하게 통합되는
FREE

Pullback Power: Catch the Trend, Maximize Your Profit! Tired of chasing trades and getting caught in market noise? The Pullback Power indicator is your essential tool for finding high-probability entries in a trending market. It's not about guessing; it's about trading with confidence, knowing you have a system designed to confirm genuine trend continuation after a brief pullback . This smart indicator combines the reliability of EMA Crosses for established trend direction with the dynamic conf
FREE

Trade History for MT4 This indicator is specially developed for that traders want to display his trades on the charts. Shows history and current deals on the chart. Trades show on the chart with a dotted line, and profit will show realtime. Buy trades are displayed in bull color, Sell trades in bear color.
Tip: The historical order displayed by the indicator is associated with the "Account History", so please set the historical order display in the "Account History" of MT software.
If you a
FREE
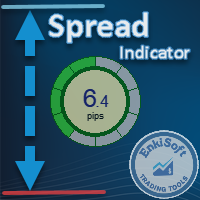
Custom Spread Indicator *Please write a review, thanks!
Also MT5 version is available
Spread Indicator show the current spread in pips with color codes. Handle 3 levels, Low, Medium, High. You can set levels and colors for each level (eg. Low: Green, Medium: Orange, High: Red), and can choose display position on the chart.
There is two spread calculation mode: -> Server spread value -> Ask - Bid value
Can set opacity, for better customization. When spread jump bigger, then display do not
FREE

CandleStick Countdown – 캔들 잔여 시간 표시 인디케이터 CandleStick Countdown은 현재 캔들이 마감되기까지 남은 분과 초를 실시간으로 카운트다운하여 보여주는 간단하고 실용적인 MT4 인디케이터입니다. 트레이딩 타이밍의 정확성을 높이는 데 도움을 주며, 많은 트레이더들이 활용하고 있습니다. 주요 기능 현재 캔들의 잔여 시간을 "분:초" 형식으로 표시 차트 상에 텍스트로 표시되어 가독성이 뛰어남 현재 가격 근처에 자동으로 위치가 조정되어 쉽게 확인 가능 글꼴 크기와 글자 색상을 자유롭게 변경 가능 모든 시간 프레임에서 사용 가능 (M1부터 MN까지 지원) 활용 포인트 캔들 마감 시간을 한눈에 확인하여 진입 및 청산 시점 판단에 도움 단기 트레이더나 스캘퍼 등 시간 타이밍이 중요한 스타일에 최적 트레이드 정확도 향상에 기여하며 조기 진입이나 조기 청산 방지 지원 파라미터 파라미터명 설명 기본값 LabelColor 표시되는 텍스트 색상 노란색 (Yellow
FREE

US30 Revolt a Technical indicator that is 100% non-repaint and appears on the current candlestick works on all timeframes (recommended M15,M30,H1) The indicator is made for US30 but it can be used on other pairs as well When a blue arrow appears look for buying opportunities When a orange arrow appears look for selling opportunities Please watch the YouTube video on how to properly set up and use the indicator
FREE

Overview
The TTM Squeeze indicator helps identify low volatility periods (squeeze) that often precede price breakouts. It uses Bollinger Bands (BB) and Keltner Channels (KC) to determine when the market is "coiling" and ready to move. Configuration Guide Volatility Settings The indicator uses Bollinger Bands to measure market volatility. When BBs are inside Keltner Channels, a squeeze is detected. The squeeze suggests the market is consolidating and may soon break out. True Range Option Optiona
FREE

This Indicator is a affordable trading tool because with the help of Popular Developers & Support of M Q L Platform I have programmed this strategy. I tried to combine logic of Moving Averages, Parabolic Stop And Reverse, Trend Strength, Oversold, Overbought . Furthermore, I have also care about Support Resistance that Trader can easily get in touch with market by selecting one indicator only. What is in for Trader?
Trading Modes: This selection is for activate whole strategy "Power Average" Sp
FREE

The Indicator show Daily Pivot Points. It is possible to specify the number of days to display. For forex it doesn't consider the sunday session data. It is possibile to modify the color, style and width for every level.It is better to use this indicator with timeframe not higher than Н1. 4 Levels of support and resistance with also Intermediate Levels that is possible to hide.
FREE

MQLTA Support Resistance Lines is an indicator that calculates the historical levels of Support and Resistance and display them as Lines on chart. It will also Alert you if the price is in a Safe or Dangerous zone to trade and show you the distance to the next level. The indicator is ideal to be used in other Expert Advisor through the iCustom function. This indicator can be tested LIVE on AUDNZD with the following DEMO https://www.mql5.com/en/market/product/26572
How does it work? The indicato
FREE

이것은 무료 제품이므로 필요에 따라 사용하시면 됩니다!
긍정적인 별 5개 평가를 남겨주시면 정말 감사하겠습니다! 감사합니다! 여기를 클릭하여 고품질 트레이딩 로봇과 지표를 확인하세요! ............................................................................. MT4용 외환 지표 스프레드 디스플레이, 훌륭한 보조 거래 도구. ............................................................................. - 스프레드 디스플레이 지표는 부착된 외환 쌍의 현재 스프레드를 표시합니다. - 차트의 어느 모서리에서나 스프레드 디스플레이 값을 찾을 수 있습니다. - 색상과 글꼴 크기도 설정할 수 있습니다. 이 MQL5 웹사이트에서만 제공되는 오리지널 제품입니다.
FREE

Monster reverse is a reverse trading indicator that gives powerful reversal points trades that have high probability to hit, the indicator doesn't repaint and signal is not delayed. Note : please combine the indicator with your system for best experience with the indicator indicator parameters : 1.signal periods 2.bands periods 3.arrow colors 4.alerts ----------
FREE

We provide indicators tailored to better meet your trading requirements. >> MT Magical <<
MT Supply Demand :
It is an indicator created to find supply and demand, which will be important support and resistance levels for the price. Supply Zone is a zone where the price has reached, it is often resisted. In other words, when the price reaches this zone, there will be more selling power to push the price back down.
Demand Zone is a zone where the price has reached, it is ofte
FREE
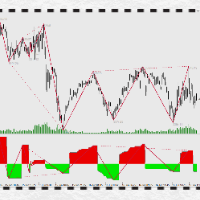
Introduction to PowerTrapezoid:
The application of market Power deviation system is not a secret, such as volume price deviation, MACD deviation, Chanlun deviation and so on. However, how to correctly understand and calculate, and accurately judge the increase or decrease of POWER is a threshold in application, which is difficult to cross with the conventional system. How to avoid reciting? How to implement multi level backflow parallel computing? How to intuitively show the range of backtrack
FREE

The Penta-O is a 6-point retracement harmonacci pattern which usually precedes big market movements. Penta-O patterns can expand and repaint quite a bit. To make things easier this indicator implements a twist: it waits for a donchian breakout in the right direction before signaling the trade. The end result is an otherwise repainting indicator with a very reliable trading signal. The donchian breakout period is entered as an input. [ Installation Guide | Update Guide | Troubleshooting | FAQ | A
FREE

이 인디케이터는 MetaTrader 4 및 5용 인터랙티브 엘리엇 파동 라벨링 도구입니다.
차트에 표시된 메뉴에서 라벨 크기, 색상, 파동 유형(ABC 조정파, 5파동 임펄스 또는 WXY 구조)을 선택하여 차트에 직접 파동 라벨을 수동으로 배치할 수 있습니다.
차트를 한 번 클릭하면 선택한 가격과 시간 위치에 맞는 파동 라벨이 순차적으로 배치되어, 트레이더가 엘리엇 파동 구조를 시각적으로 표시하고 정리하는 데 도움을 줍니다. 마음에 드신다면 평가해 주세요! 이 인디케이터는 MetaTrader 4 및 5용 인터랙티브 엘리엇 파동 라벨링 도구입니다.
차트에 표시된 메뉴에서 라벨 크기, 색상, 파동 유형(ABC 조정파, 5파동 임펄스 또는 WXY 구조)을 선택하여 차트에 직접 파동 라벨을 수동으로 배치할 수 있습니다.
차트를 한 번 클릭하면 선택한 가격과 시간 위치에 맞는 파동 라벨이 순차적으로 배치되어, 트레이더가 엘리엇 파동 구조를 시각적으로 표시하고 정리하는 데 도움을 줍니다. 마음
FREE
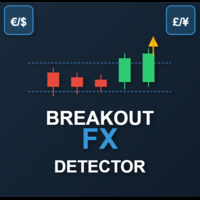
This is a powerful, session-aware breakout indicator designed for serious traders who thrive on volatility and structure. Engineered for precision, it identifies high-probability breakout zones during the London and New York trading sessions—where the market moves with intent. Key Features: Session Range Detection
Automatically detects and highlights the key price range of London and New York sessions. Breakout Confirmation
Identifies breakout candles after the session range, with cl
FREE

FREE Heiken Ashi Smoothed indicator is fully adjustable, easy to use and comes with possibility to access the indicator via iCustom function so you can use it in your own trading software. Indicator can also pop up alerts when signal changes or send push notifications. For Metatrader 5 version click here: https://www.mql5.com/en/market/product/70825 For detailed information click: >>HERE<< Features
Easy to use Accessible via iCustom Fully adjustable Alerts and Push notifications Possib
FREE

이 프로그램을 사용하면 여러 시간대를 보다 편리하게 분석할 수 있습니다.
동일한 기호를 표시하기 위해 다른 시간대 동기화 차트의 모든 차트를 동기화하는 데 도움이 됩니다. 동일한 특정 기간 및 동기화 그리기 개체 모든 차트에 동시에 표시
이 에디션에는 모든 차트를 동기화할 수 있는 개체 유형이 6개뿐입니다.
그리기 개체 유형 지원: 수직/수평선, 추세선, 직사각형, 화살표, Fibo-Retracement
추가 기능: 추세선 경고 가격이 추세선에 닿을 때 경고를 받으려면 설명 필드에 추세선 속성이라는 단어를 alert 입력하기만 하면 됩니다. 가격이 추세선에 도달하면 MT4에 경고 메시지 팝업이 표시되고 MT4 앱을 통해 알림을 받습니다.
이용방법 >> https://youtu.be/NEHUW7v1h1c
다음에서 문제를 보고하거나 최신 버전 업데이트를 따르십시오.
웹사이트: www.RookieTraders.com LineID : @RookieTraders
FREE

This is a signal dashboard based on SMA and WMA. Bull and Bear signals indicate that the price has likely changed direction (not just a temporary correction). Trap signals indicate that the price is likely only undergoing a correction, so do not rush to take an opposite position. For effective use, focus only on the timeframe column where you trade. You may observe all timeframes if you are accustomed to multi-timeframe analysis. The displayed signals are not intended to tell you to buy or sell
FREE
XAU Scalper MT4 MT5 버전 골드 쌍에서 단기적인 가격 움직임 을 관찰하기 위한 분석 도구입니다. XAU Scalper 지표는 캔들 안정성, RSI, 단기 모멘텀을 기반으로 매수 및 매도 신호 를 제공합니다. 이는 트레이더가 XAU 쌍의 짧은 시장 움직임 동안 잠재적인 진입점 을 식별하는 데 도움을 주기 위해 설계되었습니다. 기능 캔들 안정성 지수 ( Candle Stability Index ): 캔들 몸통과 꼬리 사이의 비율을 측정하여 가격 움직임의 신뢰도를 평가합니다. RSI 지수 ( RSI Index ): 상대 강도를 추적하여 잠재적인 과매수 또는 과매도 상태를 나타냅니다. 캔들 델타 길이 ( Candle Delta Length ): 방향성 변화를 감지하기 위해 분석되는 최근 캔들의 수를 정의합니다. 신호 필터링 ( Signal Filtering ): 집중적인 차트 분석을 위해 반복되는 알림을 피하는 옵션입니다. 알림 ( Alerts ): 팝업, 소리, 이메일, 모
FREE

마침내! 하나의 차트에 여러 시간 프레임을 표시하는 MT4의 확률 지표! 4개의 별도 시간 프레임에서 메인 및 신호 라인의 실제 위치를 즉시 확인하여 교육받은 거래 결정을 내리는 데 도움이 됩니다. 표시기가 여러 시간 프레임에서 표시하는 내용을 시각적으로 확인해야 하는 트레이더를 위한 진정한 MTF 확률 표시기입니다. 위 또는 아래를 가리키거나 숫자가 표시됩니다. 더 이상 다른 스토캐스틱의 위치를 확인하기 위해 시간 프레임을 휙휙 넘기지 않아도 됩니다! 좋아하는 시간대에 머물면서 전체 개요를 확인하세요!
다른 확률적 지표의 위 또는 아래 화살표가 주 또는 신호선인지, 실제로 가리키는 각도인지 더 이상 궁금해하지 마십시오!
확장되거나 정확하지 않아 가치 있는 차트 공간을 차지하는 MTF 확률론은 더 이상 필요하지 않습니다!
거래 차트에서 모든 시간대에 교차가 발생했는지 여부를 확인하십시오!
특징
M1에서 월간까지 원하는 기간(총 4개까지)을 선택하십시오. 나란히 표시된
FREE
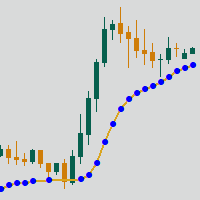
Adaptive Moving Average (AMA) is a trend indicator using moving average and market noise filter. Indicator feature are blue and red points, showing the power of trend. Recommendations for trading: Auxiliary Indicator Detecting trend Detecting power of trend Detecting potential reversal points Main indicator Shows entry points for swing trading Serves as dynamic support and resistance Recommendations for use: Any instrument Any timeframe Input parameters: Period - AMA period Fast Period - fast
FREE
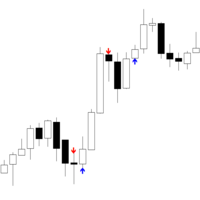
짧은 문구:
Iceblock — 가격 움직임은 작지만 거래량이 높은 클러스터를 식별하는 MT4 지표(아이스버그 유사 행동). TF:
모든 타임프레임에서 작동 (M1 ~ D1). 종목:
Forex, 지수, 금, CFD와 호환. 설정: VolumeLookback – 평균 거래량 계산용 캔들 수 VolumeThreshold – 비정상적 거래량 판단 배수 ClusterSize – 클러스터 확인을 위한 인접 캔들 수 RangeComparisonPeriod – 캔들 범위(High–Low) 평균 기간 간단 결론:
Iceblock은 거래량은 높으나 가격 변동은 작은 구역을 강조합니다. 아이스버그 주문과 유사한 현상을 시사하지만 MT4의 거래량과 가격 데이터에만 근거합니다. 화살표는 이상 활동 표시이며 매매 신호가 아닙니다.
FREE

자기 가격 탐색기 지표는 가격이 되돌아가려는 경향이 있는 평균 가격입니다. XAUUSD H1에 최적화되었습니다. 3개의 선이 있으며, 중앙선은 가격이 목표로 삼아야 할 지점입니다. 역사적 데이터에 따르면, 기본 설정으로 평균 가격으로 되돌아가는 성공률은 92% 이상이었습니다. 그 외의 경우에는 기본 설정된 손절매가 발동했습니다. 진입 지점과 진입 시간은 대략 하루의 시작 부분이며, 편의를 위해 새 날의 첫 번째 캔들은 자기 선보다 아래에서 시작했는지 위에서 시작했는지에 따라 화살표로 표시됩니다. 이 지표는 평균 회귀에 중점을 둔 일중 단일 진입 거래 전략뿐만 아니라 그리드 전략에도 적합합니다. 사용 가능한 설정: Candles: 세부 조정을 위한 캔들 수. 12-24-48 값을 사용하거나 기본값으로 두는 것을 권장합니다. ATR 설정: 전략에 맞춰 손절매를 세부 조정하는 데 필요합니다. ShowLabels: 선 오른쪽에 마커 텍스트를 표시합니다. LabelOffsetBars: 텍스트
FREE

Easy Scalp System Pro: Never Miss an Entry Again! Are you tired of complex trading setups that leave you guessing? Introducing the Easy Scalp System Pro —your ultimate, high-accuracy tool for capturing fast profits in any market! This powerful indicator combines the best of trend confirmation (Multiple EMAs) and momentum timing (MACD) into clear, non-repainting Buy and Sell arrows right on your chart. It's designed for scalpers and day traders who demand speed and precision. Why Choose Easy Sca
FREE
Time your Entry and Exits with Average True Range (ATR) Trailing Stops ATR Trailing Stops are primarily used to protect capital and lock in profits on individual trades but they can also be used, in conjunction with a trend filter, to signal entries. The indicator will help make your calculation of stop loss easier as it will be visually aiding you in choosing where to put your stoploss level on the chart by calculating the current value of ATR indicator. For those who are unfamiliar with ATR, i
FREE

Head and Shoulders Pattern Indicator - Your Key to Recognizing Trend Reversals Unlock the power of pattern recognition with the "Head and Shoulders Pattern Indicator." This cutting-edge tool, designed for MetaTrader, is your trusted ally in identifying one of the most powerful chart patterns in technical analysis. Whether you're a novice or an experienced trader, this indicator simplifies the process of spotting the Head and Shoulders pattern, allowing you to make informed trading decisions. Key
FREE
Signal King: Your Supreme Trend Indicator Ever felt lost in the noise of the market? The "Signal King" indicator cuts through the chaos, delivering clear, high-probability buy and sell signals directly to your chart. This isn't just another trend indicator; it's a powerful tool designed to give you an edge by combining the robust Supertrend with a reliable EMA filter . The Supertrend excels at identifying the overall market direction, while the EMA acts as a powerful confirmation filter. This du
FREE

RT_TrendlineTool : Semi-AutoTrendline Tool on MT4 2 easy steps, just press the [T] button on your keyboard and click on the Swing High/Low that you're interested.
Then the indicator will try to draw a trendline that runs through only the wick, not cut through candlestick's body
and try to cross the swing point as much as possible with the least slope of the trendline. You can draw up to 10 trendlines.
You are able to get alert when price breakout these trendlines. Additional Hotkey : Press [M]
FREE
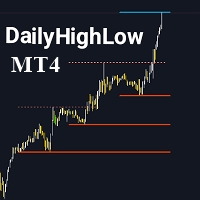
지표를 평가하여 가시성 향상에 도움을 주시기 바랍니다. DailyHighLow 지표는 MetaTrader 4 (MT4) 플랫폼을 위해 개발되었으며, 트레이더가 일일 가격 움직임을 모니터링하는 데 도움을 줍니다. 이 지표는 특정 기간의 최고 및 최저 가격을 기반으로 자동으로 추세선을 그려주어 시장에 대한 시각적 통찰을 제공합니다. 주요 특징: 맞춤형 추세선: 추세선의 색상, 스타일 및 두께를 원하는 대로 조정할 수 있습니다. 비파괴 추세선과 파괴된 추세선을 모두 구성할 수 있습니다. 동적 업데이트: 최신 시장 데이터를 기반으로 추세선이 자동으로 업데이트되며, 파손 시각적 표시기를 제공합니다. 유연한 파라미터: 표시할 일수, 파손 후 선의 종료 시간 및 최고 및 최저 가격의 추세선 외관을 조정할 수 있습니다. 명확한 시각 효과: 파손된 추세선과 비파손된 추세선을 색상과 스타일로 구분하여 중요한 시장 수준을 신속하게 식별할 수 있습니다. DailyHighLow 지표는 거래 전략을 지원하
FREE
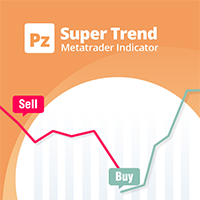
A top-quality implementation of the famous Super Trend indicator, which needs no introduction. It is completely loyal to the original algorithm, and implements many other useful features such as a multi-timeframe dashboard. [ Installation Guide | Update Guide | Troubleshooting | FAQ | All Products ] Easy to trade It implements alerts of all kinds It implements a multi-timeframe dashboard It is non-repainting and non-backpainting Input Parameters
ATR Period - This is the average true range perio
FREE

VWAP 크로스오버 신호 지표 for MetaTrader 4
VWAP 크로스오버 신호 지표로 정밀한 트레이딩을 열어보세요!
VWAP 크로스오버 신호 지표로 당신의 트레이딩 전략을 한 단계 끌어올리세요. 이 MetaTrader 4용으로 설계된 강력하고 직관적인 도구는 정확성과 명확성을 요구하는 트레이더를 위해 만들어졌습니다. 이 맞춤형 지표는 거래량 가중 평균 가격(VWAP)을 활용하여 차트에 직접 실행 가능한 매수 및 매도 신호를 제공합니다. 데이 트레이더, 스캘퍼, 스윙 트레이더에게 이상적인 이 지표는 높은 확률의 진입 및 청산 지점을 쉽게 식별할 수 있게 도와줍니다. 주요 기능: 동적 VWAP 계산: 사용자 지정 가능한 기간(기본값: 14)을 기반으로 VWAP를 계산하여 거래량으로 가중된 평균 가격을 정확히 반영합니다. 명확한 시각적 신호: 가격이 VWAP를 상향 돌파하면 녹색 상향 화살표와 "매수" 레이블이 표시되고, 하향 돌파하면 빨간색 하향 화살표와 "매도" 레이블이
FREE

BeST Oscillators Collection is a Composite MT4 Indicator including the Chaikin,Chande and TRIX Oscillators which by default are contained in MT5 but not in MT4 platform. It also provides the option of displaying or not a Mov. Avg. as a Signal Line and the resulting Signals as Arrows in a Normal (all arrows) or in a Reverse Mode (without showing up any resulting successive and of same type arrows). Analytically for each one of the specific Oscillators: The Chaikin Oscillator ( CHO ) is
FREE

Unlock Precision Trading with Pinpoint Extreme Swing! Are you tired of missing out on crucial market reversals? Do you wish you had a reliable tool to spot high-probability swing trading opportunities? Look no further! The Pinpoint Extreme Swing indicator is your ultimate partner in navigating the dynamic world of trading, designed to give you the edge you need to succeed. This powerful MQL4 indicator is engineered to identify significant market turning points by intelligently combining the Mon
FREE
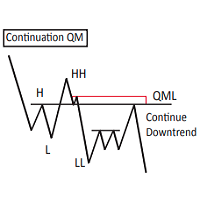
This Custom Mapping Tool is an innovative MT4 indicator that simplifies the process of marking and mapping charts. With this tool, you no longer have to waste time rewriting repetitive words, rectangles, and trendline colors every time. New Feature V5.60:
Draw path - Same as the TV Path drawing mode, which is very useful for naked chart trader. You can draw zigzag, draw your patterns manually. Change style in indicator setting. Crop function disabled by default. Can be enabled and show button c
FREE
제품 제목 ZigZag Colored (MT4)
See also >> Smart ZigZag Pro , Smart ZigZag (free)
간단 설명 MT4용 이중 색상 ZigZag. 단일 선 색상 제한을 해결하고, 각 바의 현재 다리 값과 방향을 EA가 읽을 수 있는 버퍼로 제공합니다. 개요 기존 ZigZag 경로를 상승/하락 두 색상으로 분리 표시; 바‑별 값은 EA/지표에서 활용 가능. 주요 기능 이중 색상 다리; EA 버퍼 ZigZag Up , ZigZag Down , ZigZag Per Bar ; 기본 동작; 경량 렌더링; 모든 종목/시간 프레임. 입력 기본 ZigZag 입력: Depth, Deviation, Backstep; 추가로 상승/하락 색상 설정. 버퍼 표준 ZigZag 버퍼와 추가 바‑별 버퍼를 포함: ZigZag Up ; ZigZag Down ; ZigZag Per Bar . 사용 사례 구조/스윙의 빠른 판독; EA에 바‑별 값/방향 제공; 최근
FREE
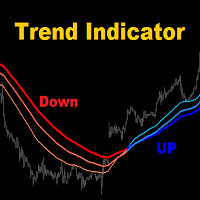
MA3 Trend - is the good trend indicator on three MAs. Benefits of the indicator: The indicator produces signals with high accuracy.
The confirmed signal of the indicator does not disappear and is not redrawn.
You can trade on the MetaTrader 4 trading platform of any broker.
You can trade any assets (currencies, metals, cryptocurrencies, stocks, indices etc.).
You can trade on any timeframes (M5-M15 scalping and day trading / M30-H1 medium-term trading / H4-D1 long-term trading). Individua
FREE
The TPX Supply Demand indicator will alert you to detect supply and demand areas. With the risk/reward filter, you'll only receive alerts if they match your chosen configuration. With the first-touch filter, alerts will only be issued in colored areas that haven't been touched yet, meaning they haven't yet been settled and have the greatest potential for reaction. Once the area is touched, only the border remains. Entry and stop-loss values are available both in the alerts and on the screen.
FREE

Super trend is one of the best trend indicators in metatrader 4 (MT4). Triple SuperTrend indicator is an indicator that consist of three super trend indicator that can be aranged. This indicator is built by mql4 language and doesn't provided by MT4 platform. Highly recommended using EMA SuperTrend Strategy Indicator if you want to get better result in here:
https://www.mql5.com/en/market/product/91664
This indicator is easy to use, power full and has many benefits, there are: Using three indic
FREE
Tipu RSI Features 28 symbols, multi-time frame powerful Dashboard for the full market view Customizable Buy/Sell alerts, push alerts, email alerts, and visual on-screen alerts. Marked overbought and oversold levels. Three colors RSI that marks the normal, oversold and overbought levels. The relative strength index (RSI) is an oscillator devised by J. Welles Wilder in his famous book New Concepts in Technical Trading Systems in 1978.1 He also introduced Parabolic SAR (see Tipu Parabollic SAR Pane
FREE

BeST_Gann Hi-Lo Strategy is an MT4 indicator that is based on the Gann Hi-Lo Activator the famous trend-following indicator that allow us to to enter a trade quite early while also stay in a trade as longer as we can for taking profit.While it is built of a moving average it helps traders determine the direction of the trends and to produce with-trend trading signals.
This indicator is in fact a simple moving average of the highs and lows of the previous period. It follows the trends in the mark
FREE

Spline Searcher MT5 — 가격 스플라인 및 관심 지점의 조기 탐지를 위한 다중 통화 지표 복잡한 가격 형성의 초기 단계를 자동으로 탐지하고 시각화하는 보조 도구입니다. 이 지표는 오직 수동 트레이딩을 위해 설계되었으며, 더 복잡한 시장 형상이나 트렌드(그 구성 요소로 단순한 형성이 포함될 수 있음)를 조기에 포착하려는 트레이더에게 적합합니다. 최대 6가지 유형의 초기 형상을 탐지합니다: 원격 캔들과 근접 캔들에 정점이 있는 포물선, 감쇠 조절이 가능한 조화 진동, 선형 파형 등입니다. 모든 형상은 정확도, 크기, 지속 시간, 견고성 기준에 따라 평가됩니다. 외관에 대한 유연한 사용자 정의와 고급 검색 로직이 제공됩니다. 추가 기능을 얻는 데 도움이 되는 링크 다음과 같은 목적이 있으신 경우: MetaTrader 5 용 지표 버전 질문하거나 지원받기 이 지표는 누구를 위한 것인가요? 흥미로운 시장 상황을 조기에 탐지하고 다양한 접근법을 시도하고자 하는 트레이더용입니다.
FREE

Индикатор MQLTA Supertrend Multi Timeframe сочетает в себе значения Supertrend, найденные на нескольких таймфреймах, чтобы подтвердить тренд пары. Для работы утилиты необходим бесплатный индикатор MQLTA Supertrend Line - https://www.mql5.com/en/market/product/25951.
Как он работает? Индикатор проверяет состояние Supertrend на всех выбранных таймфреймах и отображает результат в виде легко читаемой таблицы.
Как торговать с помощью индикатора Supertrend Multi Timeframe Покупку следует совершать,
FREE

BREAKOUT-SESSION-BOX LONDON EU US ASIA Open
watch the expectation of a volatile movement above or under the opening range We take the high of the range as Entry for a long trade and SL will be the low of the range and vice versa the low of the range as Entry for a short trade and the high for SL The size of the range is the distance to the TP (Take Profit) The range of the opening hours should not be larger than about 1/3 of the average daily range 4 breakout examples are already predefined: A
FREE
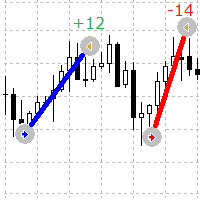
차트에서 주문의 시작점과 종료점을 시각적으로 볼 수 있는 간단하면서도 유용한 지표
이 표시기는 기호에 대한 현재 열린 주문 및 완료된 주문을 보여줍니다.
표시기 매개변수
Lines Buy color - 구매 주문에 대한 라인 색상을 지정합니다. Lines Sell color - 판매 주문에 대한 라인 색상을 지정합니다. Lines Width - 선 너비를 설정하고 솔리드 스타일 유형에 대해 작동합니다. Lines style - 선의 스타일을 설정합니다. Lines positive profit color - 양수 이익 텍스트의 색상을 설정합니다. Lines negative profit color - 음수 이익 텍스트의 색상을 설정합니다. Lines profit value font type - 이익 텍스트의 글꼴 유형을 설정합니다. 컴퓨터에 설치된 글꼴 유형 중 하나를 설정할 수 있습니다. Lines profit font size - 수익 텍스트의 글꼴 크기를 설정합니다. Lin
FREE
MetaTrader 마켓 - 거래자를 위한 로봇 및 기술 지표는 거래 터미널에서 바로 사용할 수 있습니다.
The MQL5.community 결제 시스템은 MQL5.com 사이트의 모든 등록된 사용자가 MetaTrader 서비스에서 트랜잭션을 수행할 수 있습니다. 여러분께서는 WebMoney, 페이팔, 또는 은행 카드를 통해 자금을 예치하거나 인출하실 수 있습니다.
트레이딩 기회를 놓치고 있어요:
- 무료 트레이딩 앱
- 복사용 8,000 이상의 시그널
- 금융 시장 개척을 위한 경제 뉴스
등록
로그인
계정이 없으시면, 가입하십시오
MQL5.com 웹사이트에 로그인을 하기 위해 쿠키를 허용하십시오.
브라우저에서 필요한 설정을 활성화하시지 않으면, 로그인할 수 없습니다.