Konstenfreie technische Indikatoren für den MetaTrader 4 - 4
Renko Chart mit gleitendem Durchschnitt. Klassische Renko-Chart-Idee. Es wird auf dem Hauptdiagramm dargestellt und der Gleitende Durchschnitt kann angewendet werden. Die Preise für die Balken werden von einem niedrigeren Zeitrahmen verwendet. Parameter: BarsBack - wie viele Bars des unteren Zeitrahmens verwendet werden sollen. Wenn der Wert Null ist, werden alle verfügbaren Balken verwendet. LTF - unterer Zeitrahmen. BrickSize - Renko-Balken in Punkten. BullishColor - Farbe für die Bullenkerze
FREE

Dieser Indikator zeichnet automatisch die Unterstützungs- und Widerstandsniveaus für Sie, sobald Sie ihn auf einem Chart abgelegt haben. So müssen Sie diese Ebenen nicht jedes Mal neu zeichnen, wenn Sie die Preise in einem Chart analysieren. Alles, was Sie tun müssen, ist, den Indikator auf einem Diagramm abzulegen, die Einstellungen nach Ihren Wünschen anzupassen und ihn den Rest machen zu lassen. Aber es kommt noch besser: Der Indikator ist absolut kostenlos! Holen Sie sich die neue und verbes
FREE

Bitcoin Trader Pro Indicator ist ein fortschrittliches Tool, das speziell für die Analyse des Kryptowährungsmarktes entwickelt wurde, wobei der Schwerpunkt auf BTCUSD liegt. Dieser Indikator kombiniert mehrere technische Analysemethoden, um präzise und zuverlässige Handelssignale zu generieren. Der Bitcoin Trader Pro Indicator eignet sich sowohl für Anfänger als auch für erfahrene Trader und bietet alles, was Sie brauchen, um fundierte Handelsentscheidungen zu treffen. Meine Indikatoren sind ko
FREE

Der Indikator zeigt das maximale horizontale Volumen im ausgewählten Zeitrahmen an. Basierend auf dem Indikator UPD1 Volume Box . Linien können verbunden oder getrennt werden. In den Einstellungen können Sie eine intelligente Berührungswarnung aktivieren. Ein solcher Indikator wird für diejenigen nützlich sein, die mit dem Marktprofil und dem Konzept von Smart Money handeln.
Eingangsparameter.
Grundlegende Einstellungen. Bars Count - gibt die Anzahl der Balken an, auf denen der TF-POC gezeich
FREE

Pips Hunter PRO wurde über mehrere Jahre entwickelt und ist eine verbesserte Version seines Vorgängers. Dieser leistungsstarke Indikator analysiert den Markt- und Kursverlauf, um Kauf- und Verkaufseinstiege zu generieren. Für die Berechnung dieser Einträge verwendet er verschiedene Indikatoren, die zusammenarbeiten, sowie einen komplexen statistischen Logarithmus, der weniger günstige Einträge herausfiltert und sie eliminiert / MT5-Version .
Merkmale Kein Repainting
Dieser Indikator ändert se
FREE

Heikin Ashi Smoothed – MT4-Indikator Heikin Ashi Smoothed ist ein benutzerdefinierter Indikator für MetaTrader 4 (MT4), der das klassische Heikin Ashi-Kerzenchart durch einen zusätzlichen Glättungsprozess mit gleitenden Durchschnitten verbessert. Dieses Verfahren sorgt für eine deutlich klarere und gleichmäßigere Trenddarstellung, reduziert Marktrauschen erheblich und erleichtert die Erkennung sowohl der vorherrschenden Marktrichtung als auch möglicher Umkehrpunkte. Hauptmerkmale Zeigt geglättet
FREE
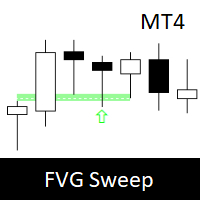
Fair Value Gap Sweep ist ein einzigartiger und leistungsfähiger Indikator, der Fair-Value-Lücken auf Ihrem Diagramm einzeichnet und Sie warnt, wenn eine Lücke vom Kurs übersprungen wurde. Eine Fair-Value-Lücke ist eine Kurslücke, die auftritt, wenn der Markt auf einem anderen Niveau eröffnet als der vorherige Schlusskurs, wodurch ein Ungleichgewicht zwischen Käufern und Verkäufern entsteht. Ein Gap Sweep liegt vor, wenn sich der Kurs zurückbewegt, um die Lücke zu schließen, was auf eine Änderun
FREE

Dieser Indikator kann Alarme senden, wenn ein Heiken Ashi Smoothed Farbwechsel auftritt. In Kombination mit Ihren eigenen Regeln und Techniken können Sie mit diesem Indikator Ihr eigenes leistungsstarkes System erstellen (oder verbessern). Merkmale Kann alle Arten von Alarmen senden. Option, den Alarm um einen Balken zu verzögern, um den Farbwechsel (Trend) zu bestätigen. Eingabe-Parameter Warten auf Kerzenschluss: 'true' oder 'false'. Die Einstellung 'true' verzögert den Alarm bis zur Eröffnung
FREE

Candlestick-Zähler dieser Indikator zählt Kerzen, die sich auf dem Chart eines beliebigen Zeitrahmens befinden eine kostenlose Bartheke, die Sie auf mt4 herunterladen können der Candlestick-Zähler zählt, wie viele Kerzen sich in einem größeren Chart befinden mit diesem Kerzenzähler können Sie die automatische Kerzenzählung durchführen kostenloser Candlestick-Zählindikator zum automatischen Herunterladen und Zählen von Balken bar counter to count the bars count candle counter indicator mt4 count
FREE
AP VWAP Bands Pro (MT4) Volumengewichteter Durchschnittspreis mit ±σ-Bändern für klare Intraday-Bias, Mittelwert-Umkehrzonen und dynamische Unterstützung/Widerstand. Funktioniert bei Kryptowährungen (inkl. BTC), FX, Indizes und Metallen. Verwendet das Tick-Volumen, wenn das reale Volumen nicht verfügbar ist.
Was es zeigt VWAP-Linie (volumengewichteter Durchschnittspreis).
Zwei Hüllkurven um den VWAP (standardmäßig ±1σ und ±2σ) zur Hervorhebung des Gleichgewichts gegenüber der Ausdehnung.
Mod
FREE

Magnetischer Preisfinder-Indikator, der Durchschnittspreis, zu dem der Preis tendiert zurückzukehren. Optimiert für XAUUSD H1. Er hat 3 Linien, wobei die zentrale Linie der Preis ist, an dem man sich orientieren sollte. Auf historischen Daten betrug die Erfolgsrate der Rückkehr zum Durchschnittspreis über 92% mit den Standardeinstellungen; in den anderen Fällen wurde der standardmäßig eingestellte Stop Loss ausgelöst. Der Einstiegspunkt und die Einstiegszeit liegen ungefähr zu Beginn des Tages,
FREE
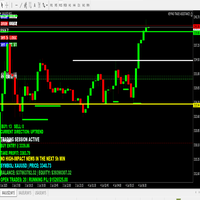
HANDELSSTRATEGIELEITFADEN LIEFERUNG Der vollständige Handelsstrategie-Leitfaden wird Ihnen nach dem Kauf direkt zugesandt.
Schreiben Sie mir einfach eine Nachricht auf MQL5 und fordern Sie ihn an - Sie erhalten ihn sofort, zusammen mit vorrangigem Support und Einrichtungshilfe. Powered Market Scanner für intelligente Handelsentscheidungen Keypad Support & Resistance ist ein MT4-Handelssystem der nächsten Generation, das für seriöse Trader entwickelt wurde, die Präzision, Zuverlässigkeit und
FREE

Dieser benutzerdefinierte Indikator, den ich für Metatrader 4 entworfen habe, um die Eastern Standard Time (Ortszeit von New York) von jedem Metatrader 4-Server aus leicht identifizieren zu können. Sie können dies jedoch verwenden, um Ihre Ortszeit zu identifizieren, indem Sie die Zeitzone aus dem Dropdown-Menü ändern. Es ermöglicht Ihnen, jeder bestimmten Zeit in der ausgewählten Zeitzone Ihrer Wahl eine vertikale Linie in einer beliebigen Farbe hinzuzufügen. Sie können horizontale automatisch
FREE
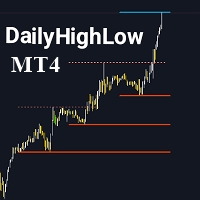
Bitte vergessen Sie nicht, den Indikator zu bewerten, um mir bei der Sichtbarkeit zu helfen. Der DailyHighLow Indikator ist für die MetaTrader 4 (MT4) Plattform entwickelt und hilft Tradern, tägliche Preisbewegungen zu überwachen. Dieser Indikator zeichnet automatisch Trendlinien basierend auf den Höchst- und Tiefstwerten eines bestimmten Zeitraums und bietet so visuelle Einblicke in den Markt. Hauptmerkmale: Anpassbare Trendlinien: Passen Sie die Farbe, den Stil und die Breite der Trendlinien n
FREE

SX Trend Impulse Channels ist ein präzise konzipiertes Trendfolgesystem, das die Trendentwicklung durch unterschiedliche, volatilitätsangepasste Schritte darstellt. Anstatt sich auf traditionelle, auf der Steigung basierende Methoden zu verlassen, verwendet es einen strukturierten Schrittmechanismus, der nur dann vorankommt, wenn die Preisbewegung das Momentum über einen ATR-basierten Auslöser schlüssig bestätigt.
Dieser Indikator eignet sich gut für Händler, die eine strukturierte, schrittwei
FREE

Überblick Happy Lion ist ein Smart-Money-Zone-Indikator, der historische Daten scannt, um bestimmte Kerzenmuster zu identifizieren. Dies sind die Bereiche, in denen große Institutionen (Banken/Hedgefonds) bedeutende "Fußabdrücke" in Form von nicht ausgeführten Aufträgen hinterlassen. Demand Zones (Bullish): Hebt die letzte rückläufige Kerze vor einem starken, impulsiven Ausbruch nach oben hervor. Angebotszonen (bärisch): Hebt die letzte bullische Kerze vor einem starken, impulsiven Ausbruch nach
FREE
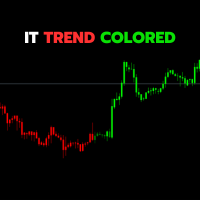
Der IT Trend Colored Indikator ist ein leistungsfähiges Werkzeug, das von IT Trading (InfiniteTrades Software Corp) entwickelt wurde, um Händler bei der visuellen und effektiven Identifizierung von Markttrends zu unterstützen. Diese Version ist ein benutzerdefinierter Indikator für die Handelsplattform MetaTrader 4.
Hauptmerkmale :
- Trend-Identifikation: Der Indikator verwendet eine Kombination aus einfachen gleitenden Durchschnitten (SMA), um die Richtung des Markttrends zu bestimmen.
- In
FREE

Volatilitätskanal-Indikator Reiten Sie die Wellen der Marktvolatilität mit Präzision ... bitte hinterlassen Sie eine 5-Sterne-Bewertung, wenn Sie dieses Produkt lieben Der Indikator ist kostenlos. Der Quellcode ist für nur 30usd erhältlich.
Sind Sie es leid, zu früh oder zu spät in den Handel einzusteigen? Verpassen Sie Ausbrüche? Sich in falschen Signalen zu verfangen? Der Volatilitätskanal-Indikator verwandelt chaotische Kursbewegungen in kristallklare Handelsmöglichkeiten. Was Si
FREE
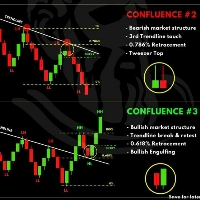
HANDELSFLUSS MIT AUTOMATISCHER TRENDLINIE KOSTENLOS 1. Automatisch die Marktstruktur erkennen Achten Sie auf wichtige Preisaktionsstrukturen: BOS (Bruch der Struktur) CHoCH (Veränderung des Charakters) EQH / EQL (Equal High / Low)
Diese helfen Ihnen, die aktuelle Marktphase (Umkehr oder Fortsetzung) basierend auf dem Smart Money Konzept zu verstehen. 2. Auto Trend Line verwenden Trendlinien werden automatisch auf Basis der gültigen Struktur gezeichnet. A usbruch aus einer Trend
FREE

Handelsverlauf für MT4 Dieser Indikator wurde speziell für Trader entwickelt, die ihre Trades auf den Charts anzeigen möchten. Zeigt die Historie und die aktuellen Geschäfte auf dem Chart an. Trades werden auf dem Chart mit einer gepunkteten Linie angezeigt, und der Gewinn wird in Echtzeit angezeigt. Gekaufte Trades werden in Bullenfarbe angezeigt, verkaufte Trades in Bärenfarbe.
Tipp: Die vom Indikator angezeigte historische Order ist mit der "Account History" verknüpft. Bitte stellen Sie die
FREE

Auto-Fibonacci-Retracement-Indikator - Flexibel und verlässlich Dies ist nicht nur ein weiterer Auto Fibonacci Retracement Indikator - es ist eines der flexibelsten und zuverlässigsten Tools, die es gibt . Wenn Sie ihn nützlich finden, hinterlassen Sie bitte eine Bewertung oder einen Kommentar, um das Projekt zu unterstützen. Sehen Sie sich meine anderen hilfreichen Tools unten an: Timeframes Trend Scanner - Scannen Sie den Trend von Vermögenswerten in verschiedenen Zeitrahmen mit mehreren Indi
FREE

Scalping-Indikator. Er berücksichtigt die Volatilität, die Preisbewegung im lokalen Intervall und die Richtung des aktuellen Trends. Empfohlener Zeitrahmen - M5. Vorteile: Geringe Volatilität beim Erscheinen eines Signals sorgt für minimale Bewegung gegen eine offene Position. Der Indikator zeichnet seine Signale nicht neu. Es gibt Alarmsignale. Er ist ein hervorragendes Instrument für den Daytrading.
Einstellungen: Name Beschreibung Zeitraum Zeitraum des Indikators Bereich eines jeden Balkens
FREE
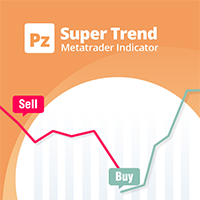
Eine hochwertige Implementierung des berühmten Super-Trend-Indikators , der keiner Einführung bedarf. Er ist dem ursprünglichen Algorithmus vollständig treu und implementiert viele weitere nützliche Funktionen wie z.B. ein Multi-Timeframe-Dashboard. [ Installationsanleitung | Updateanleitung | Fehlerbehebung | FAQ | Alle Produkte ] Einfach zu handeln Es implementiert alle Arten von Alarmen Es implementiert ein Multi-Zeitrahmen-Dashboard Kein Re-Painting und kein Back-Painting Eingabe-Parameter
A
FREE

Tipu Heikin-Ashi Panel ist die modifizierte Version des ursprünglichen Heiken-Ashi-Indikators, der von MetaQuotes hier veröffentlicht wurde. Eine professionelle Version dieses Indikators ist hier erhältlich.
Merkmale Ein einfach zu bedienendes Panel, das den Heiken Ashi-Trend des ausgewählten Zeitrahmens anzeigt. Anpassbare Kauf-/Verkaufswarnungen, Push-Warnungen, E-Mail-Warnungen oder visuelle Warnungen auf dem Bildschirm. Anpassbares Panel. Das Panel kann an eine beliebige Stelle im Chart ver
FREE
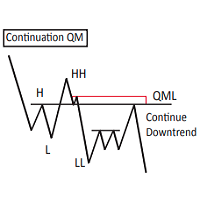
Dieses Custom Mapping Tool ist ein innovativer MT4-Indikator, der das Markieren und Kartieren von Charts vereinfacht. Mit diesem Tool müssen Sie keine Zeit mehr damit verschwenden, sich wiederholende Wörter, Rechtecke und Trendlinienfarben jedes Mal neu zu schreiben. Neue Funktion V5.60:
Pfad zeichnen - Wie der TV-Pfad-Zeichenmodus, der für den nackten Chart-Händler sehr nützlich ist. Sie können Zickzack zeichnen, zeichnen Sie Ihre Muster manuell. Ändern Sie den Stil in den Indikatoreinstellunge
FREE
Der TPX Supply Demand Indikator warnt Sie, wenn Sie Angebots- und Nachfragebereiche erkennen. Mit dem Risiko/Ertrags-Filter erhalten Sie nur dann Warnungen, wenn diese mit der von Ihnen gewählten Konfiguration übereinstimmen. Mit dem First-Touch-Filter werden nur Warnungen in farbigen Bereichen ausgegeben, die noch nicht berührt wurden, d.h. sie wurden noch nicht abgewickelt und haben das größte Potenzial für eine Reaktion. Sobald der Bereich berührt wird, bleibt nur noch die Grenze übrig. Einst
FREE
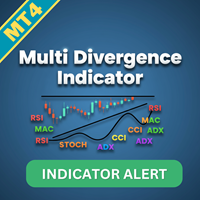
Multi-Divergenz-Indikator für MT4 - Benutzerhandbuch Einführung Überblick über den Multi-Divergenz-Indikator und seine Möglichkeiten zur Erkennung von Divergenzen bei mehreren Indikatoren.
Bedeutung der Divergenzerfassung für die Verbesserung von Handelsstrategien und Entscheidungsfindung.
Liste der Indikatoren RSI
CCI
MACD
STOCHASTIC
AWSOME
MFI
ACCELERATOR
OSMA
MOMENTUM
WPR( Williams %R)
RVI Indikator-Merkmale
Indikatorauswahl: Aktivieren/Deaktivieren bestimmter Indikatoren (RSI, CCI, MACD usw
FREE

Der Indikator zeigt Volumenprofile an, die auf dem Schachtelprinzip basieren. Die Perioden der Profile sind so voreingestellt, dass jedes nachfolgende Profil doppelt so lang ist wie das vorhergehende Profil. Zusätzlich zu den Profilen zeigt der Indikator Volumencluster an, die je nach dem darin enthaltenen Volumen farblich sortiert sind.
Merkmale des Indikatorbetriebs Der Indikator arbeitet auf typischen Zeitrahmen von M5 bis MN, verwendet aber für Berechnungen historische Daten aus kleineren
FREE

This Indicator is a affordable trading tool because with the help of Popular Developers & Support of M Q L Platform I have programmed this strategy. I tried to combine logic of Moving Averages, Parabolic Stop And Reverse, Trend Strength, Oversold, Overbought . Furthermore, I have also care about Support Resistance that Trader can easily get in touch with market by selecting one indicator only. What is in for Trader?
Trading Modes: This selection is for activate whole strategy "Power A
FREE

Dark Inversion ist ein Indikator für den Intraday-Handel. Dieser Indikator basiert auf der Counter Trend Strategie, nutzt aber auch die Volatilität. Mit diesem Indikator kann man bei guten Kursen einsteigen, um die Inversionen auf dem aktuellen Instrument zu verfolgen. Hey, I made an Expert Advisor based on this indicator, if you are interested: Dark Titan
Wichtigste Vorteile
Leicht sichtbare Inversions-Linien Intuitive Richtungspfeile Automatisierte Anpassung für jeden Zeitrahmen und jedes In
FREE
Dieser Indikator ist einzigartig in seiner Art, er eignet sich hervorragend für Scalping auf XAUUSD und auch für den Handel auf höheren Zeitskalen!
. Die Benachrichtigung informiert Sie über die wichtigsten Einstiegspunkte, so dass Sie auf den Trend hin handeln sollten. Ideal für Scalping! The Best Trend Signals ist ein Trendindikator für mehrere Währungen, der für alle Finanzinstrumente, Währungen, Kryptowährungen, Metalle, Aktien und Indizes verwendet werden kann. Empfohlener Zeitrahmen M15,
FREE

Indikatoren zur Erleichterung der Analyse auf der Grundlage der BBMA-Strategie von Oma Ally durch Anzeige von CSAK (CSD), CSM und Extreme auf dem Chart 1. Zeigt die Bollinger Band Linie an 2. LWMA 5-10 Hoch und Tief 3. EMA 50 4. Fibonacci 5. MHV . Bereich 6. Warn- und Anzeigeetiketten BBMA besteht aus der Verwendung von 2 Indikatoren : Gleitende Durchschnitte Bollinger Bänder BBMA besteht aus 3 Arten von Einträgen : Extreme MHV Wiedereinstieg Einstellungen des gleitenden Durchschnitts : Im Syst
FREE

Wir bieten Ihnen Indikatoren, die auf Ihre Handelsanforderungen zugeschnitten sind: >> MT Magical <<
MT Supply Demand :
Es ist ein Indikator, der geschaffen wurde, um Angebot und Nachfrage zu finden, die wichtige Unterstützungs- und Widerstandsniveaus für den Preis darstellen. Supply Zone ist eine Zone, wo der Preis erreicht hat, ist es oft widerstanden. Mit anderen Worten, wenn der Preis diese Zone erreicht, gibt es mehr Verkaufskraft, um den Preis wieder nach unten zu drücken.
Die Nac
FREE

Unser RSI-Indikator verfügt über eine leistungsstarke Multi-Zeitrahmen-Funktion (MTF) , die es Ihnen ermöglicht, RSI-Werte aus anderen Zeitrahmen (z.B. H1, H4, D1) direkt in Ihrem aktuellen Arbeitschart (z.B. M15) anzuzeigen. Vorteile des MTF RSI : Senior Timeframe Context: Verstehen Sie den globalen Trend und die überkauften/überverkauften Niveaus von Senior Timeframes, ohne die Charts zu wechseln. Dies hilft dabei, Signale auf den niedrigeren TFs herauszufiltern und in Richtung der Hauptbewegu
FREE
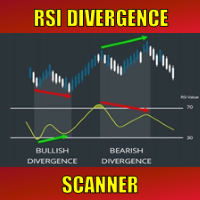
Special offer : ALL TOOLS , just $35 each! New tools will be $30 for the first week or the first 3 purchases ! Trading Tools Channel on MQL5 : Join my MQL5 channel to update the latest news from me In den dynamischen Finanzmärkten ist die Identifizierung von Trendwende-Signalen für effektives Trading unerlässlich. Der RSI Divergence Scanner ist darauf ausgelegt, Ihnen dabei zu helfen, RSI-Divergenzsignale über verschiedene Währungspaare und Zeitrahmen hinweg genau und effizient zu
FREE
Optimieren Sie Ihre Handelsanalyse mit dem Day and Week Separator MT4, einem intuitiven Tool, das anpassbare Tages- und Wochentrennlinien zeichnet, ideal für Trader, die mit Zeitunterschieden zwischen Brokern zu kämpfen haben. In Handelsgemeinschaften wie Forex Factory und Reddit’s r/Forex wird dieses Tool für seine Einfachheit und Effektivität geschätzt, da es die häufige Herausforderung löst, Chart-Zeitrahmen mit lokalen oder marktspezifischen Zeiten abzustimmen, wie es in Diskussionen auf Pla
FREE
Evolutionieren Sie Ihren Handel mit dem UT Alert Bot Indikator für MQL4 Der UT Alert Bot Indicator ist Ihr ultimativer Handelsbegleiter, der sorgfältig entwickelt wurde, um Ihnen in der schnelllebigen Welt der Finanzmärkte einen Vorteil zu verschaffen. Angetrieben durch das renommierte UT-System, kombiniert dieses innovative Tool fortschrittliche Analysen, Echtzeit-Warnungen und anpassbare Funktionen, um sicherzustellen, dass Sie nie eine profitable Gelegenheit verpassen. Ob Sie nun mit Devisen
FREE
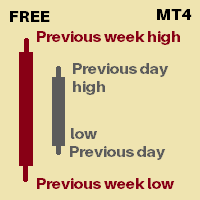
Es ist ein Indikator, der Ihnen zeigt
Hoch vom Vortag Vortagestief Hoch der Vorwoche Vorwoche tief Sie können einstellen, wie viele Tage der Historie Sie für das Hoch-Tief des Vortages und das Hoch-Tief der Vorwoche sehen möchten Derzeit werden 30 Tage PDH/L markiert 4 Wochen PWH/L werden markiert Sie können dies in den Indikatoreinstellungen ändern. An den Markierungslinien werden Daten angezeigt, um zu erkennen, zu welchem Datum die Markierung gehört.
Vielen Dank :) Ich bin immer offen für Fe
FREE
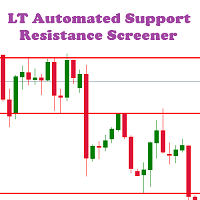
LT Automated Support Resistance Screener ist ein Level-Indikator oder ein Support-Resistance-Indikator, der zur Bestimmung des Niveaus von Unterstützungs- und Widerstandswerten verwendet werden kann. Dieser Indikator ist kostenlos und einfach in der Metatrader 4 Plattform zu verwenden, die mit der MQL4 Programmiersprache aufgebaut ist. Der Support-Resistance-Indikator ist ein wichtiger Indikator, der oft verwendet wird, aber auf der MT4-Plattform nicht verfügbar ist. Dieser Indikator kann für al
FREE
Wie man handelt
Führen Sie Ihre Trades in 3 einfachen Schritten aus!
Schritt 1: Handelsaufbau Einstieg Kaufen bei Signalpreis und TP1 im Preisindikator, Sie können den Trailing-Stop in TP1 verwenden. Einstieg Verkaufen im Signalpreis und TP1 im Preisindikator, Sie können den Trailing-Stop in TP1 verwenden. Erfolgsquote ≥ 75% 100:25 Schritt 2: Stop Loss setzen Stop Loss BUY ----> Sie können Stop Loss auf Line Order SELL setzen. Stop Loss SELL ----> Sie können den Stop Loss für die Line Order BUY
FREE
Hauptmerkmale des Indikators: Kauf- und Verkaufssignale: Der Indikator generiert Kauf- und Verkaufssignale auf der Grundlage bestimmter Bedingungen. Er verwendet den Crossover des Fast Moving Average (Fast MA) und des Slow Moving Average (Slow MA), um Markteintritte zu bestimmen. Der RSI (Relative Strength Index) wird verwendet, um Kaufsignale zu erkennen, wenn der RSI über 50 und unter 75 liegt. Es werden auch Unterstützungs- und Widerstandsniveaus zur zusätzlichen Bestätigung von Signalen berü
FREE

Der Indikator erstellt Orderblöcke (BZ) nach dem Handelssystem von Roman (TS). Die Blöcke werden gleichzeitig in zwei Zeitrahmen gesucht: dem aktuellen und dem älteren (in den Einstellungen definiert). Um veraltete Blöcke zu optimieren und zu ignorieren, können Sie in den Einstellungen eine Begrenzung der Anzahl der Tage festlegen, innerhalb derer Blöcke gesucht werden. Die Blöcke werden nach den TS-Regeln gebildet, die aus drei Schritten bestehen: welche Kerze wurde herausgenommen (was?); welch
FREE

VWAP-Crossover-Signalindikator für MetaTrader 4
Entfesseln Sie präzises Trading mit dem VWAP-Crossover-Signalindikator!
Heben Sie Ihre Handelsstrategie mit dem VWAP-Crossover-Signalindikator auf ein neues Level – einem leistungsstarken und intuitiven Tool, das speziell für MetaTrader 4 entwickelt wurde. Entworfen für Trader, die Genauigkeit und Klarheit verlangen, nutzt dieser benutzerdefinierte Indikator den Volume Weighted Average Price (VWAP), um direkt auf Ihrem Chart aktionsfähige Kauf-
FREE

Detect strength for uptrends and downtrends by tracking Buy Power and Sell Power. Stay on the right side of the market by being able to determine whether the market is in a bull or bear trend and how strong the trend is.
Free download for a limited time! We hope you enjoy, with our very best wishes during this pandemic!
Trend Trigger Factor zielt darauf ab, Seitwärtsbewegungen zu überstehen, während sich der Händler auf der richtigen Seite des Marktes positioniert, um große Trends zu erfassen
FREE

Market Profile 3 MetaTrader 4 Indikator - ist eine klassische Marktprofil-Implementierung, die die Preisdichte im Laufe der Zeit anzeigen kann, indem sie die wichtigsten Preisniveaus, den Wertbereich und den Kontrollwert einer bestimmten Handelssitzung umreißt. Dieser Indikator kann mit Zeitrahmen zwischen M1 und D1 verbunden werden und zeigt das Marktprofil für tägliche, wöchentliche, monatliche oder sogar Intraday-Sessions an. Niedrigere Zeitrahmen bieten eine höhere Präzision. Höhere Timefram
FREE

Dies ist ein Signal-Dashboard, das auf SMA und WMA basiert. Bullen- und Bärensignale weisen darauf hin, dass der Kurs wahrscheinlich seine Richtung geändert hat (nicht nur eine vorübergehende Korrektur). Trap-Signale deuten darauf hin, dass sich der Kurs wahrscheinlich nur in einer Korrektur befindet, so dass Sie sich nicht beeilen sollten, eine entgegengesetzte Position einzunehmen. Für eine effektive Nutzung sollten Sie sich nur auf die Spalte des Zeitrahmens konzentrieren, in dem Sie handeln.
FREE

MarketSessions Indikator Das unverzichtbare Werkzeug zur Visualisierung globaler Marktsessions Der MarketSessions-Indikator ist ein leistungsstarkes MT4-Tool, das Tradern hilft, die wichtigsten Forex-Marktsessions direkt auf ihren Charts zu visualisieren. Durch die klare Darstellung der aktiven Handelszeiten der Märkte in Sydney, Tokio, London und New York unterstützt dieser Indikator Sie dabei, optimale Handelsperioden zu identifizieren und Marktvolatilitätsmuster zu verstehen. Hauptfunktionen:
FREE

HiLoTren IQ7 – Intelligente Marktgrenzen und Pivot-Mapping Definieren Sie Ihre Handelsebenen mit KI-Präzision.
HiLoTren IQ7 ist ein intelligenter , pivotbasierter Indikator , der Pivot-Punkte , Widerstands- (R1–R3) und Unterstützungszonen (S1–S3) automatisch direkt in Ihr Diagramm einzeichnet.
Es bietet einen klaren visuellen Rahmen zur Identifizierung von Marktgrenzen, Umkehrzonen und Trendfortsetzungsniveaus – alles in Echtzeit berechnet. Hauptmerkmale Auto-Pivot-Engine
FREE
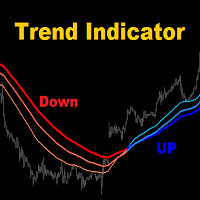
MA3 Trend - ist der gute Trendindikator auf drei MAs. Vorteile des Indikators: Der Indikator erzeugt Signale mit hoher Genauigkeit.
Das bestätigte Signal des Indikators verschwindet nicht und wird nicht neu gezeichnet.
Sie können auf der Handelsplattform MetaTrader 4 eines beliebigen Brokers handeln.
Sie können mit beliebigen Vermögenswerten handeln (Währungen, Metalle, Kryptowährungen, Aktien, Indizes usw.).
Sie können auf beliebigen Zeitrahmen handeln (M5-M15 Scalping und Daytrading / M30-
FREE
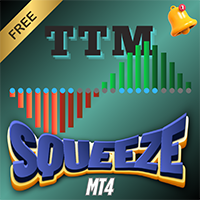
Überblick
Der TTM Squeeze-Indikator hilft bei der Identifizierung von Perioden geringer Volatilität (Squeeze), die häufig Kursausbrüchen vorausgehen. Er verwendet Bollinger Bänder (BB) und Keltner-Kanäle (KC), um festzustellen, wann sich der Markt "windet" und bereit ist, sich zu bewegen. Leitfaden zur Konfiguration Volatilitätseinstellungen Der Indikator verwendet Bollinger Bänder, um die Marktvolatilität zu messen. Wenn sich die BBs innerhalb der Keltner-Kanäle befinden, wird ein Squeeze erka
FREE

Dominion-Levels: Der Architekt der "Marktstruktur"
Perfekt für Gold (XAUUSD)
Das definitive Werkzeug zur Identifizierung von "harten" Unterstützungs- und Widerstandsniveaus, die tatsächlich halten. Die meisten Händler ziehen Unterstützungs- und Widerstandslinien auf der Grundlage von Gefühlen oder vagen Zonen. Das Ergebnis? Unübersichtliche Charts, subjektive Entscheidungen und Ausstiegsmöglichkeiten durch "Lärm". Dominion Levels löst dieses Problem, indem es die Subjektivität beseitigt. Es ha
FREE

CandleStick Countdown – Kerzenrestzeit-Anzeige CandleStick Countdown ist ein einfaches und praktisches MT4-Indikator, das in Echtzeit einen Countdown anzeigt, wie viele Minuten und Sekunden bis zum Abschluss der aktuellen Kerze verbleiben. Es hilft, die Genauigkeit des Trade-Timings zu verbessern und wird von vielen Tradern genutzt. Hauptfunktionen Zeigt die verbleibende Zeit der aktuellen Kerze im Format „Minuten:Sekunden“ an Als Text auf dem Chart dargestellt, für hohe Sichtbarkeit Position wi
FREE

Grebenka MQL4 ist ein Chart Markup Assistent für die MetaTrader 4 Plattform.
Funktionsweise: 1. Ermöglicht das kontinuierliche Zeichnen von ZigZag-Linien im manuellen Modus durch Mausklicks. 2. ermöglicht es Ihnen, den Modus einzuschalten, in dem jede Trendlinie, die gerade bearbeitet wird, horizontal ausgerichtet ist.
Hotkeys: [Z] - aktiviert/deaktiviert den Modus des manuellen Zeichnens von ZigZag-Linien [ X] - horizontalen Trendlinienmodus ein-/ausschalten [ C] - schneller Farbwechsel der
FREE
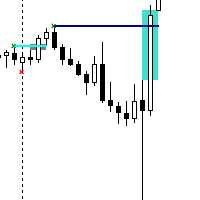
Der Kontraktions-/Expansions-Breakout-Indikator für MetaTrader 4 (MT4) ist ein leistungsstarkes Tool, das den Ausbruch von bullischen und bearischen Kontraktions- oder Expansionsformationen auf den Finanzmärkten erkennt und signalisiert. Mithilfe fortschrittlicher algorithmischer Berechnungen unterstützt dieser Indikator Händler bei der Erkennung signifikanter Kursbewegungen, die häufig mit diesen Formationen einhergehen, und liefert wertvolle Erkenntnisse für strategische Handelsentscheidungen.
FREE
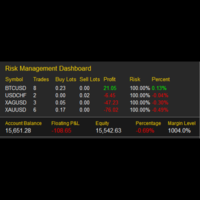
Mein Risikomanagement Das Risikomanagement-Dashboard ist ein visuelles Instrument, das den Händlern hilft, das Risiko in Echtzeit zu überwachen. Mit seinem klaren und kompakten Layout bietet es einen sofortigen Überblick über die Handelsaktivitäten und ermöglicht eine diszipliniertere und fundiertere Entscheidungsfindung. Hauptmerkmale Zusammenfassung aktiver Symbole
Zeigt alle gehandelten Symbole mit der Anzahl der Trades, den gesamten Kauf-/Verkaufs-Lots und dem aktuellen Gewinn/Verlust an. R
FREE
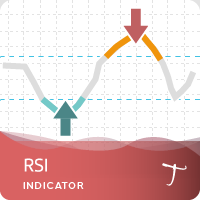
Tipu RSI Merkmale 28 Symbole, leistungsstarkes Dashboard mit mehreren Zeitfenstern für eine vollständige Marktübersicht Anpassbare Kauf-/Verkaufswarnungen, Push-Warnungen, E-Mail-Warnungen und visuelle Bildschirmwarnungen. Markierte überkaufte und überverkaufte Niveaus. Dreifarbiger RSI, der die normalen, überverkauften und überkauften Niveaus markiert. Der Relative Strength Index (RSI) ist ein Oszillator, der 1978 von J. Welles Wilder in seinem berühmten Buch New Concepts in Technical Trading S
FREE

Sind Sie bereit, der Sherlock Holmes des Forex-Handels zu werden? ️️ Wir präsentieren das ultimative Trading-Toolkit: Den Lisek Levels and Channels Indikator!!! Vergessen Sie das Jonglieren mit mehreren Indikatoren wie in einer Zirkusnummer. Wir haben alles, was Sie brauchen, in eine spektakuläre Show gepackt: Preisniveaus? Check! Preiskanäle? Wetten! Preis-VWAP? Oh ja! On-Balance-Volumen? Alles da! Und das Sahnehäubchen obendrauf? Alarme und Push-Benachrichtigungen, die Sie schne
FREE

Dieser Indikator basiert auf der GMMA-Strategie von Guppy. Er zeigt Pfeile an, wenn sich GMMA-Linien nach oben oder unten kreuzen. Um diesen Indikator zu nutzen und Warnungen für mehrere Zeitrahmen und mehrere Paare zu erhalten, können Sie die Demo dieses GMMA Trend Scanner Indikators ausprobieren: https://www.mql5.com/en/market/product/38747
Über GMMA in Kürze:
GMMA versucht, Trends zu erkennen, indem er zwei Gruppen von gleitenden Durchschnitten mit unterschiedlichen Zeiträumen kombiniert: Di
FREE
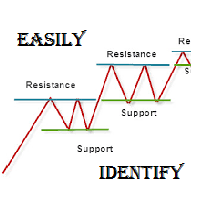
Wie der Name leicht erkennen lässt, ist dieser Indikator ein erschwingliches Handelsinstrument denn mit der Hilfe von Beliebte Entwickler & Unterstützung der M Q L Plattform Ich habe diese Strategie programmiert. Ich habe versucht, 4 Arten und 3 Perioden der Berechnung in Bezug auf Support Resistance, Darüber hinaus habe ich auch Pflege über Trendlinien dass Trader auch auf andere Weise leicht mit dem Markt in Kontakt kommen können. Was ist für Trader drin?
Trading Modes: Diese Auswahl ist für
FREE
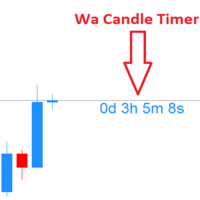
Wa Candle Timer MT4 ist ein leistungsstarker und benutzerfreundlicher Indikator, der die verbleibende Zeit bis zur nächsten Kerze auf deinem MT4-Chart anzeigt. Er unterstützt Trader bei der besseren Überwachung von Kerzenschlusszeiten für präzisere Entscheidungen. Hauptfunktionen :
Countdown-Anzeige für die aktuelle Kerze
Farbwechsel, wenn die verbleibende Zeit unter einen definierten Prozentsatz fällt
Neu in Version 3.00: Anpassbarer Alarm bei Erreichen eines bestimmten Prozentsatzes
FREE

ZU GUTER LETZT! Ein stochastischer Indikator für MT4, der mehrere Zeitrahmen auf einem Chart anzeigt! Zeigen Sie sofort die tatsächliche Position der Haupt- und Signalleitungen in 4 verschiedenen Zeitrahmen an, um fundierte Handelsentscheidungen zu treffen.
Ein echter stochastischer MTF-Indikator für Händler, die visuell sehen müssen, was der Indikator ihnen in mehreren Zeitrahmen sagt, keine Pfeile, die nur nach oben oder unten zeigen oder Zahlen anzeigen. Kein Wechseln mehr zwischen den Zeit
FREE

Der Keltner-Kanal ist ein bekannter Indikator, der nicht in der Standard-Indikatorenliste von MT4 enthalten ist (Sie können ihn irgendwie von Ihrem Broker erhalten). Dieser Indikator hilft Ihnen, den Trend und manchmal überkaufte/überverkaufte Preise während eines flachen Trends zu definieren. Eingabe Beschreibung: EMA-Periode: Periode des gleitenden Durchschnitts, die für den Indikator verwendet wird. Muss größer als 1 sein. ATR-Zeitraum: Für den Indikator verwendete Average True Range-Periode.
FREE
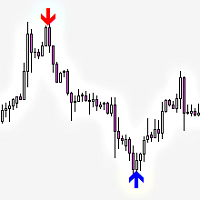
Railway Tracks Pattern - Umkehrmuster-Indikator Railway Tracks Pattern ist ein Indikator, der automatisch ein starkes Zwei-Kerzen-Umkehrmuster auf dem Chart erkennt. Er sucht nach zwei Kerzen mit entgegengesetzten Richtungen (bullish und bearish), die ähnlich groß sind und nur minimale Dochte aufweisen - ein klares Zeichen für einen Momentumwechsel. So funktioniert es: Die erste Kerze ist stark und richtungsweisend. Die zweite Kerze bewegt sich in die entgegengesetzte Richtung und ist von
FREE

Ichimoku Trend Alert ist der Ichimoku Kinko Hyo Indikator mit Alerts und Signalfiltern.
Ichimoku Trend Alert Funktionen: Optionale Überprüfung von Ichimoku-Wolke, Tenkan sen (Umkehrlinie), Kijun sen (Basislinie), Senkou-Spanne A, Senkou-Spanne B und Chikou-Spanne relativ zum Preis und mehr. Popup-, E-Mail- und Telefon-Benachrichtigungen für ausgewählte Symbole und Zeitrahmen.
Es gibt 9 klassische Ichimoku-Trendfilter, die Sie in den Einstellungen aktivieren/deaktivieren können: Preis/Wolkenauf
FREE

Der MQLTA Supertrend Multi Timeframe-Indikator kombiniert Supertrend-Werte, die auf mehreren Timeframes gefunden wurden, um den Trend eines Paares zu bestätigen. Das Tool erfordert den kostenlosen MQLTA Supertrend Line Indikator - https://www.mql5.com/en/market/product/25951.
Wie funktioniert es? Der Indikator prüft den Supertrend-Status in allen ausgewählten Zeitrahmen und zeigt das Ergebnis in Form einer leicht zu lesenden Tabelle an.
Wie man mit dem Supertrend Multi Timeframe Indikator hand
FREE

Das Matrix Arrow Indicator Multi Timeframe Panel MT4 ist ein kostenloses Add-On und eine großartige Bereicherung für Ihren Matrix Arrow Indicator MT4 . Es zeigt das aktuelle Matrix Arrow Indicator MT4 -Signal für 5 benutzerdefinierte Zeitrahmen und für insgesamt 16 veränderbare Symbole/Instrumente. Der Benutzer hat die Möglichkeit, jeden der 10 Standardindikatoren, aus denen der Matrix Arrow Indicator MT4 besteht, zu aktivieren/deaktivieren. Alle der 10 Standardindikatorattribute sind ebenfalls
FREE

BeST Oscillators Collection ist ein zusammengesetzter MT4-Indikator, der die Chaikin-, Chande- und TRIX-Oszillatoren enthält , die standardmäßig in MT5, aber nicht in der MT4-Plattform enthalten sind. Er bietet auch die Möglichkeit, einen Mov. Avg. als Signallinie und die daraus resultierenden Signale als Pfeile in einem normalen (alle Pfeile) oder in einem umgekehrten Modus (ohne Anzeige von aufeinanderfolgenden und gleichartigen Pfeilen). Analytisch für jeden der spezifischen Oszillatoren: Der
FREE

Der VWAP-Level-Indikator ist ein technisches Analyseinstrument, das den gewichteten Durchschnittspreis für das gehandelte Volumen eines bestimmten Vermögenswerts berechnet. Der VWAP liefert Händlern und Anlegern den Durchschnittspreis eines Vermögenswerts über einen bestimmten Zeitraum.
Er wird häufig von Anlegern verwendet, um Daten zu "passiven" Handelsgeschäften wie Pensionsfonds und Investmentfonds zu vergleichen, aber auch von Händlern, die überprüfen wollen, ob ein Vermögenswert zu einem
FREE

Dieser Indikator findet Three-Drives-Muster. Das Three-Drives-Muster ist ein 6-Punkte-Umkehrmuster, das durch eine Reihe höherer Hochs oder tieferer Tiefs gekennzeichnet ist, die an einer 127%- oder 161,8%-Fibonacci-Erweiterung enden. Es signalisiert, dass der Markt erschöpft ist und ein Umschwung stattfinden kann. [ Installationsanleitung | Update-Anleitung | Fehlerbehebung | FAQ | Alle Produkte ] Anpassbare Mustergrößen
Anpassbare Farben und Größen
Anpassbare Ausbruchsperioden Anpassbare 1-2-3
FREE

Beschreibung: Der Indikator misst mit Hilfe des Zickzack-Indikators die Trend- oder Korrekturniveaus. Er zeigt im Diagramm die Niveaus eines jeden festgestellten Tiefs oder Hochs an. KEY LINKS: Anleitung zur Installation - Häufige Fragen - Alle Produkte Wie nützlich ist dieser Indikator? Dieser Indikator bestimmt, abhängig vom Zigzag-Parameter, ob ein Trend beginnt, sich entwickelt oder endet Dieser Indikator bestimmt die Richtung des Trends Bestandteile Levels als positive oder negative Zahlen,
FREE
MetaTrader Market bietet jedem Entwickler eine einfache und bequeme Plattform für den Verkauf von Programmen.
Wir unterstützen Sie bei der Veröffentlichung des Produkts und beraten Sie gerne, wie man eine Beschreibung für den Market vorbereitet. Alle Produkte, die im Market verkauft werden, sind durch eine zusätzliche Verschlüsselung geschützt und können nur auf dem Rechner des Kunden gestartet werden. Illegales Kopieren ist ausgeschlossen.
Sie verpassen Handelsmöglichkeiten:
- Freie Handelsapplikationen
- Über 8.000 Signale zum Kopieren
- Wirtschaftsnachrichten für die Lage an den Finanzmärkte
Registrierung
Einloggen
Wenn Sie kein Benutzerkonto haben, registrieren Sie sich
Erlauben Sie die Verwendung von Cookies, um sich auf der Website MQL5.com anzumelden.
Bitte aktivieren Sie die notwendige Einstellung in Ihrem Browser, da Sie sich sonst nicht einloggen können.