Watch the Market tutorial videos on YouTube
How to buy а trading robot or an indicator
Run your EA on
virtual hosting
virtual hosting
Test аn indicator/trading robot before buying
Want to earn in the Market?
How to present a product for a sell-through
Free Technical Indicators for MetaTrader 4 - 3
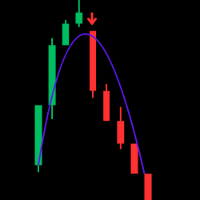
Trend WTS — Advanced Modular Trend & Signal Indicator for XAUUSD (M5 Optimized) Unlock precise trading insights with Trend WTS , a powerful and modular trend and signal indicator designed specifically for XAUUSD on the M5 timeframe. Built for traders seeking accuracy and clarity, Trend WTS combines fast moving average crossovers with a long-term EMA filter to deliver reliable buy and sell signals tailored for the gold market. Key Features: Dual Moving Average Trend Detection: Detect strong trend
FREE
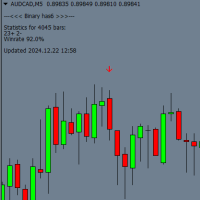
Binary has 6 is an indicator for binary options trading in MT4 that works on any timeframe and with any currency pair. It can also be used for Forex trading. Key Features: Expiration: By default, set to 1 candle, but users can adjust it to a period from 1 to 3 candles in the settings. Trend-based trading: The indicator generates signals following the current trend. Signals: Before the current candle closes, an arrow (red or blue) appears on the chart as a signal for entry. These signals are avai
FREE
BBRSI Quantum (Free Edition) BBRSI Quantum is a powerful, 100% Non-Repainting indicator for MetaTrader 4 that generates clear Buy and Sell arrows based on an advanced momentum strategy. This tool is designed for traders who want to identify precise entry points during overbought or oversold conditions. This is the fully functional FREE edition. The Core Strategy: Bollinger Bands on RSI Unlike standard indicators, BBRSI Quantum does not apply Bollinger Bands to the price. Instead, it applies th
FREE
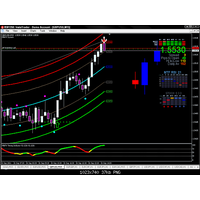
Gravity Timing Indicator -GTI-
GTI indicator is the easiest and most accurate indicator so far.it uses support and resistance in a gravity way .Working on it is so easy, it consists of 7 lines, the most powerful of which are the lowest and the highest lines , so when the indicator rebounds , it is the best time to enter. it works on all pairs with no excaption for time frame , i prefer small time frames like 5 minutes and 15 minutes for scalping .
FREE
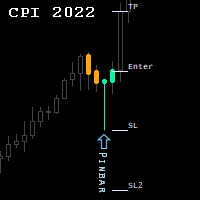
Candlestick Patterns Indicator.
NEW! FREE Candlestick Patterns Expert Advisor > https://www.mql5.com/en/market/product/105634?source=Site +Profile
The Indicator draws colored candlestick patterns, their description and future levels of Stop Loss / Take Profit. Combined with other market analysis, can greatly improve trading results. Indicator can be highly customized by the user including change of colors, fonts, levels, candle sizes etc...
developed, tested and optimized on " VantageMark
FREE

Dual Timeframe VWAP Indicator for MT4
Description Professional VWAP indicator that displays both **Daily** and **Weekly** VWAP simultaneously on your chart.
Features: - Dual VWAP Lines: Blue for Daily, Red for Weekly - Configurable Bands: Two deviation bands for each timeframe - Session Control: Customizable trading hours for Daily VWAP - Clean Visuals: Solid lines for main VWAP, dashed for bands - Optimizable: Parameters can be optimized using Genetic Algorithm
Key Settings: - Enable/di
FREE

The VR Donchian indicator is an improved version of the Donchian channel. Improvements affected almost all functions of the channel, but the main operating algorithm and channel construction were preserved. A change in the color of levels has been added to the ball indicator depending on the current trend - this clearly shows the trader a change in trend or flat. The ability to inform the trader about the breakout of one of two channel levels on a smartphone, email, or in the MetaTrader terminal
FREE
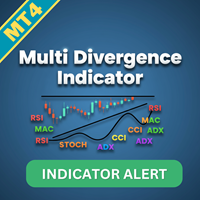
Multi Divergence Indicator for MT4 - User Guide Introduction Overview of the Multi Divergence Indicator and its capabilities in identifying divergences across multiple indicators.
Importance of divergence detection in enhancing trading strategies and decision-making.
List of Indicators RSI
CCI
MACD
STOCHASTIC
AWSOME
MFI
ACCELERATOR
OSMA
MOMENTUM
WPR( Williams %R)
RVI Indicator Features
Indicator Selection: How to enable/disable specific indicators (RSI, CCI, MACD, etc.) for divergence detectio
FREE
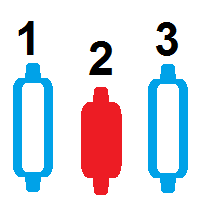
candlestick counter indicator this indicator counts candles that are on the chart of any timeframe a free bar counter for you to download on mt4 the candlestick counter counts how many candles there are inside a larger chart with this candle counter you can do the automatic candlestick count free candlestick count indicator for you to download and count bars automatically bar counter to count the bars count candle counter indicator mt4 count candle bar counter for MT5 If you are interested in th
FREE

Title: Price Action Pro - Advanced Multi-Timeframe Reversal Scanner "Experience the full power of 'Price Action Pro' completely FREE on EURUSD!" Product Overview: Price Action Pro is not just another candlestick pattern indicator. It is a complete trading system designed to detect high-probability reversal setups. Unlike standard indicators that spam signals on every pattern, Price Action Pro uses a Smart Swing Filter to ensure patterns are only detected at valid swing highs or lows. Combined wi
FREE
A personal implementation of the famous Bollinger bands indicator as a trend following mechanism, which uses a moving average and the standard deviation to define what a trend is and when it changes. Bollinger bands are usually used as an oversold/overbought indicator only, but in my opinion, the trading approach is more complete using the trend variant as an exit strategy. [ Installation Guide | Update Guide | Troubleshooting | FAQ | All Products ] Easy to trade Customizable colors and sizes It
FREE

This is a Multi pair and Multi time frame dashboard. The founder of the system is Mr. Oma Ally, which is a system based from Bollinger Band and Moving Average(BBMA). BBMA consists of the use of 2 indicators: Moving Averages Bollinger Bands BBMA consists of 3 types of entries: Extreme MHV Re-Entry Rejection EMA50 This Dashboard Help you to scan current Extreme, Reentry setup, Rejection EMA50 and also MHV How to read signals:
find the same color in 3 different timeframes in succession
For exampl
FREE

It works based on the Stochastic Indicator algorithm. Very useful for trading with high-low or OverSold/Overbought swing strategies. StochSignal will show a buy arrow if the two lines have crossed in the OverSold area and sell arrows if the two lines have crossed in the Overbought area. You can put the Stochastic Indicator on the chart with the same parameters as this StochSignal Indicator to understand more clearly how it works. This indicator is equipped with the following parameters: Inputs d
FREE
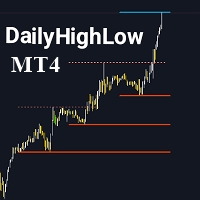
Please remember to rate the indicator to help me with visibility.
The DailyHighLow Indicator for MetaTrader 4 (MT4) provides a sophisticated tool for tracking daily price movements. Designed for traders who need clear, actionable insights into market highs and lows, this indicator automatically plots trend lines based on the highest and lowest prices over a customizable number of days. Key Features: Trend Lines Customization: Define colors, line styles, and widths for both broken and unbroken
FREE

Evolutionize Your Trading with the UT Alert Bot Indicator for MQL4 The UT Alert Bot Indicator is your ultimate trading companion, meticulously designed to give you an edge in the fast-paced world of financial markets. Powered by the renowned UT system, this cutting-edge tool combines advanced analytics, real-time alerts, and customizable features to ensure you never miss a profitable opportunity. Whether you’re trading forex, stocks, indices, or commodities, the UT Alert Bot Indicator is your k
FREE
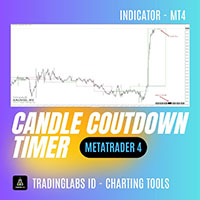
Candle Timer Countdown (CTC) – Minimalist & Precise Candle Timer Candle Timer Countdown (CTC) is a lightweight and non-intrusive MetaTrader indicator that displays the remaining time of the current candlestick on your chart. Designed with simplicity and clarity in mind, this tool helps traders stay aware of candle closures without cluttering the chart. Key Features: Real-Time Candle Countdown
Always know how many seconds are left before the current candle closes – works on all timeframes. Minima
FREE
NYXORA SIGNAL – Precision Scalping Power for XAUUSD (M1) NYXORA SIGNAL is an advanced scalping indicator designed exclusively for XAUUSD (Gold) on the M1 timeframe .
It automatically detects potential reversal zones and refines them into a precise 30-pip area , giving traders fast and accurate entries in the ultra-volatile Gold market. Main Features Auto Reversal Zone Detection – Smart algorithm that identifies and refines potential reversal areas into a consistent 30-pip zone. Custom SL & TP Le
FREE

This indicator help to mark the high and low of the session Asian,London,Newyork , with custom hour setting
This indicator is set to count from minute candle so it will move with the current market and stop at the designated hour and create a accurate line for the day.
below is the customization that you can adjust :
Input Descriptions EnableAsian Enables or disables the display of Asian session high and low levels.
EnableLondon Enables or disables the display of London session high and
FREE
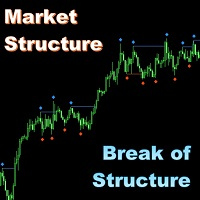
Market Structure - Break of Structure (MS-BOS) for MT4
All my indicators work only at closed bars, they do not repaint any values (if it is not otherwise mentioned in the description). So that they are fully compatible with autotrading, and are ready for making qualitative technical analysis. Market Structure - Break of Structure. The indicator is based on pivotal points (so-called "fractals"), which it paints on chart with "diamonds" above and below the price in the points, where that pivot
FREE
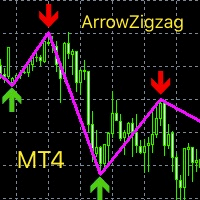
This index is based on the secondary development of zigzag, adding high and low point arrow indication, thickening the line and changing the color. Can be a good display of the current admission trading signals, current long or short. It can be combined with other indicators to determine the trading point, which has great reference value. Compared with the general trend index or oscillation batch standard, the accurate determination is higher from the perspective of historical data research and
FREE

A simple indicator that automatically highlights all FVGs (Fair Value Gaps) formed on the chart, as well as FVGs on history. It is possible to select colors for FVGs of different directions (long or short), select the time interval, select the color of middle point and you can also choose whether to delete filled FVGs or leave them on the chart (the option is beneficial for backtesting). The indicator can be very useful for those, who trade according to the concept of smart money, ICT, or simply
FREE

This tool gives you the opportunity to display pivot point support and resistance levels as well as the daily open, weekly close and monthly close levels on your chart with high levels of customization.
Pivot points are important horizontal support and resistance levels that get calculated using the high, low and closing price of the previous period (for example D1). With this indicator, you can choose between hourly to monthly timeframes to base your pivot point calculation on.
There is a va
FREE
Signal King: Your Supreme Trend Indicator Ever felt lost in the noise of the market? The "Signal King" indicator cuts through the chaos, delivering clear, high-probability buy and sell signals directly to your chart. This isn't just another trend indicator; it's a powerful tool designed to give you an edge by combining the robust Supertrend with a reliable EMA filter . The Supertrend excels at identifying the overall market direction, while the EMA acts as a powerful confirmation filter. This du
FREE

This indicator finds Three Drives patterns. The Three Drives pattern is a 6-point reversal pattern characterised by a series of higher highs or lower lows that complete at a 127% or 161.8% Fibonacci extension. It signals that the market is exhausted and a reversal can happen. [ Installation Guide | Update Guide | Troubleshooting | FAQ | All Products ] Customizable pattern sizes
Customizable colors and sizes
Customizable breakout periods Customizable 1-2-3 and 0-A-B ratios
It implements visual/s
FREE
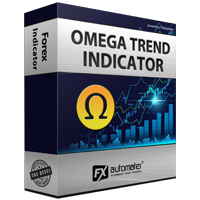
The Omega Trend Indicator is an advanced tool that has been specifically designed to detect market trends early, and follow them efficiently. The indicator draws two lines. The main (thicker) Trend Line represents the presumed lower or upper volatility limits of the current market trend. A break in the main Trend Line indicates a potential reversal or shift in the movement of the trend. The Trend Line also indicates the best point to place a stop loss order. In Omega Trend Indicator, the Trend L
FREE

Master market trends with the SuperTrend Alert MT4, a powerful indicator designed to deliver precise trend-following signals for forex, stocks, crypto, and commodities trading. Celebrated in trading communities like Forex Factory and Reddit’s r/Forex, and praised in discussions on Investopedia and TradingView for its robust trend detection, this indicator is a go-to tool for traders seeking reliable entries and exits. Users report up to 90% accuracy in identifying trend directions when combinin
FREE
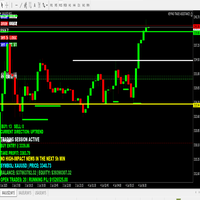
TRADING STRATEGY GUIDE DELIVERY The full Trading Strategy Guide will be sent directly to you after purchase.
Just message me on MQL5 and ask for it — you'll receive it instantly, along with priority support and setup help. Powered Market Scanner for Smart Trading Decisions Keypad Support & Resistance is a next-generation MT4 trading system built for serious traders who demand precision, reliability, and clarity. It combines advanced smart filters with real-time price structure logic to gener
FREE
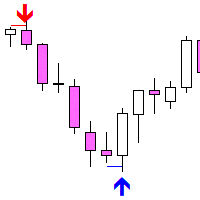
Fakey Detector — False Breakout (Fakey) Indicator Fakey Detector is an indicator that automatically detects the classic Fakey pattern (false breakout of an inside bar) from Price Action and displays it on the chart using an arrow and breakout level. How it works: The Fakey pattern consists of three candles: Mother Bar — the largest by range Inside Bar — fully contained within the Mother Bar's range Fakey Candle — breaks out (up or down), but then closes back inside the range The indicator
FREE

Dark Inversion is an Indicator for intraday trading. This Indicator is based on Counter Trend strategy but use also Volatility. We can enter in good price with this Indicator, in order to follow the inversions on the current instrument. Hey, I made an Expert Advisor based on this indicator, if you are interested: Dark Titan
Key benefits
Easily visible Inversion Lines Intuitive directional arrows Automated adjustment for each timeframe and instrument Easy to use even for beginners Never repai
FREE
HTF MACD – Trend-Aligned Signals (one subwindow, arrows on chart) What it does
This indicator keeps you trading with the higher-timeframe trend while using MACD crosses for precise entries. In a single subwindow it shows: HTF Trend Histogram — green = uptrend, red = downtrend (neutral is hidden for a cleaner view) MACD Lines — blue = MACD main, orange = MACD signal Arrows on the price chart when a valid, trend-aligned MACD cross occurs Optional alerts on bar close Entry logic (strict, closed-ba
FREE

Fractals Dynamic Fractals Dynamic – is a modified free fractal indicator by Bill Williams, in which you can manually set the number of bars on the left and right, thereby building unique patterns on the chart. Now all trading strategies based on or based on the Fractals Dynamic indicator will have an additional signal.
In addition, fractals can act as support and resistance levels. And in some trading strategies, show liquidity levels. For this purpose, levels were introduced in this version
FREE

HiLoTren IQ7 — Smart Market Boundaries & Pivot Mapping Define your trading levels with AI precision. HiLoTren IQ7 is an intelligent pivot-based indicator that automatically plots Pivot Points , Resistance (R1–R3) , and Support (S1–S3) zones directly on your chart.
It provides a clear visual framework to identify market boundaries, reversal zones, and trend continuation levels — all calculated in real time. Main Features Auto Pivot Engine — calculates daily pivots, R/S levels
FREE
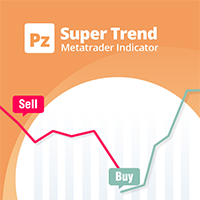
A top-quality implementation of the famous Super Trend indicator, which needs no introduction. It is completely loyal to the original algorithm, and implements many other useful features such as a multi-timeframe dashboard. [ Installation Guide | Update Guide | Troubleshooting | FAQ | All Products ] Easy to trade It implements alerts of all kinds It implements a multi-timeframe dashboard It is non-repainting and non-backpainting Input Parameters
ATR Period - This is the average true range perio
FREE

I prepared an indicator Showing BUY and SELL probability by checking Higher Time Frames... It’s quick, easy to read, and free. Enjoy, and let me know how it boosts your trading! By tweaking the timeframe weightings , smoothing , and support/resistance influence , you can adapt the indicator’s Buy/Sell probabilities to your personal trading style. Keep an eye on both the on-chart labels and subwindow histogram to quickly see when the bias shifts, then combine this with your own trading rules for
FREE
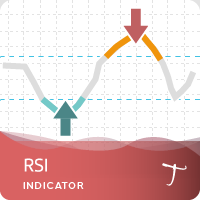
Tipu RSI Features 28 symbols, multi-time frame powerful Dashboard for the full market view Customizable Buy/Sell alerts, push alerts, email alerts, and visual on-screen alerts. Marked overbought and oversold levels. Three colors RSI that marks the normal, oversold and overbought levels. The relative strength index (RSI) is an oscillator devised by J. Welles Wilder in his famous book New Concepts in Technical Trading Systems in 1978.1 He also introduced Parabolic SAR (see Tipu Parabollic SAR Pane
FREE
The TPX Supply Demand indicator will alert you to detect supply and demand areas. With the risk/reward filter, you'll only receive alerts if they match your chosen configuration. With the first-touch filter, alerts will only be issued in colored areas that haven't been touched yet, meaning they haven't yet been settled and have the greatest potential for reaction. Once the area is touched, only the border remains. Entry and stop-loss values are available both in the alerts and on the screen.
FREE

Super Trend Pro Its simple. as you see in product picture you can find out how it work. We Use Several MA and use Statistics and Probability inside the code to draw nice, great and pure Trend Detection. Do you like it? Yes me too Here, Super trend pro with 100% non-repainting indicator
Input Parameter is clear and simple.
Inputs Period 1 --------------------------->>>> Use for mathematical calculating
Period 2 --------------------------->>>> MA Period
Indicator Type ------------------->>>> Use
FREE

Ichimoku Trend Alert is the Ichimoku Kinko Hyo indicator with Alerts and signal filters.
Ichimoku Trend Alert features: Optional check of Ichimoku cloud, Tenkan sen(Conversion Line), Kijun sen(Base Line), Senkou span A, Senkou span B, and Chikou span relative to price, and more. Popup, email, and phone notification alerts for selected symbols and timeframes.
There are 9 classic Ichimoku trend filters you can enable/disable in settings: Price/Cloud Order: Checks the price position relative to t
FREE
Candle Timer Countdown to Next Bar MT 4 Free by DigitalPrime A reliable, lightweight candle timer showing the exact time remaining until the next bar – now available for free with core functionality. Used and trusted by hundreds of traders – over 800 downloads! Key Features Real-time countdown to the next candle close (for M1, M15, and H1 only) Updates independently of market tick activity Minimal CPU usage – works smoothly on all supported charts Simple, always visible, fixed position (top lef
FREE
The indicator shows the vertical volume. In the settings there are 2 coefficients for determining high and extreme volume and 1 for determining low volume. A similar algorithm is also used in the UDP1 Volume Pixel indicator . When the specified volume is detected, the histogram is painted in the appropriate color. The width of the histogram is selected automatically, depending on the scale. As a rule, the price reacts to the maximum and minimum volume. But it is necessary to use confirmation si
FREE

The indicator identifies when a divergence occurs between price and an indicator or oscillator. It identifies bullish and bearish hidden or regular (classical) divergences. Combined with your own rules and techniques, this indicator will allow you to create (or enhance) your own powerful system. For higher probability setups I can recommend you to use my Supply Demand indicator and trade only if the divergence occurs inside a zone. Supply zone for bearish div and demand zone for bullish div. T
FREE

Previous Day's Close and Bar Shift Indicator for MetaTrader! The Previous Day's Close and Bar Shift Indicator is a tool designed to enhance technical analysis and decision-making in trading. With this indicator, you will have access to detailed information about the opening, high, low, and closing levels of any bar, allowing for precise and comprehensive analysis of market movements. Imagine having the ability to nest one timeframe within another, enabling detailed analysis of each bar across di
FREE

Detect strength for uptrends and downtrends by tracking Buy Power and Sell Power. Stay on the right side of the market by being able to determine whether the market is in a bull or bear trend and how strong the trend is.
Free download for a limited time! We hope you enjoy, with our very best wishes during this pandemic!
Trend Trigger Factor aims to ride out sideways movement, while positioning the trader in the correct side of the market to capture big trends when they occur. It was origin
FREE
The Flower Indicator is a technical analysis tool primarily used to identify trends and assist with scalping or intraday trading strategies. The Flower Indicator is a signal trend indicator based on technical and price dynamics analysis. It visually signals trends using colored flowers—blue flowers indicate an uptrend , while red flowers indicate a downtrend Each levels can act like support & resistance ( watch for +/- 200 levels & the dots when appear on the chart ) You can set the dots to appe
FREE

Unlock Precision Trading with Pinpoint Extreme Swing! Are you tired of missing out on crucial market reversals? Do you wish you had a reliable tool to spot high-probability swing trading opportunities? Look no further! The Pinpoint Extreme Swing indicator is your ultimate partner in navigating the dynamic world of trading, designed to give you the edge you need to succeed. This powerful MQL4 indicator is engineered to identify significant market turning points by intelligently combining the Mon
FREE

Description Helps you detect the structure of the market, using different types of Smart Money concepts. This should help you to upgrade your trading strategy in every way. MT5 Version Here Smart Money Features: Color candle to signal the type of structure Shows CHOCH and BOS Equal Lows and Highs Order Blocks Internal and Swings Weak and strongs high and lows Fair Value Gaps High and Lows in daily weekly and monthly timeframes Premium and discount Zones KEY LINKS: How to Install – Frequent
FREE

Info Plus is a simple tool that displays the current status on an asset class. The information displayed by Info Plus includes: Bid Price The high and low of the day. Candle time left. Current spread. Selected timeframe. Asset class selected (Symbol). Pip value. Open Positions. Total pips booked. Pips per trade. Session times (they may not be accurate and are subject to changes). Date and time.
How it Works When loaded onto any chart, Info Plus automatically gets the following parameters: Bid P
FREE

BREAKOUT-SESSION-BOX LONDON EU US ASIA Open
watch the expectation of a volatile movement above or under the opening range We take the high of the range as Entry for a long trade and SL will be the low of the range and vice versa the low of the range as Entry for a short trade and the high for SL The size of the range is the distance to the TP (Take Profit) The range of the opening hours should not be larger than about 1/3 of the average daily range 4 breakout examples are already predefined: A
FREE

''A professional trader is a greedy trader: he buys at lows and sells at highs with minimal risks and high returns,,
Neuro Scalper is developed exactly for such trading approach . It's a universal indicator for tracking reversals and uses price action patterns, discrepancy of custom indicators and a multi-layered formula for identifying reversal structures. The indicator is very easy to use; it only shows arrows where is recommended to buy or sell. The indicator is universal and suitable f
FREE

Indicator determines the direction of price movement, calculates the possibility of entering the market using an internal formula and displays a breakout entry signal. Indicator signals appear both at the beginning of trend movements and in the opposite direction, which allows you to open and close orders as efficiently as possible in any of the market conditions. Version for МТ5: https://www.mql5.com/en/market/product/58980
Benefits: a unique signal calculation formula; high signal accuracy; d
FREE
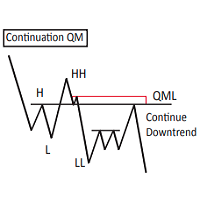
This Custom Mapping Tool is an innovative MT4 indicator that simplifies the process of marking and mapping charts. With this tool, you no longer have to waste time rewriting repetitive words, rectangles, and trendline colors every time. New Feature V5.60:
Draw path - Same as the TV Path drawing mode, which is very useful for naked chart trader. You can draw zigzag, draw your patterns manually. Change style in indicator setting. Crop function disabled by default. Can be enabled and show button c
FREE

Market Profile 3 MetaTrader 4 indicator — is a classic Market Profile implementation that can show the price density over time, outlining the most important price levels, value area, and control value of a given trading session. This indicator can be attached to timeframes between M1 and D1 and will show the Market Profile for daily, weekly, monthly, or even intraday sessions. Lower timeframes offer higher precision. Higher timeframes are recommended for better visibility. It is also possible t
FREE

Наш индикатор RSI оснащен мощной мультитаймфреймовой (MTF) функцией , которая позволяет вам отображать значения RSI с других таймфреймов (например, H1, H4, D1) прямо на вашем текущем рабочем графике (например, M15). Преимущества MTF RSI: Контекст Старшего Таймфрейма: Понимайте глобальный тренд и уровни перекупленности/перепроданности со старших таймфреймов, не переключая графики. Это помогает фильтровать сигналы на младших ТФ и входить в сделки по направлению основного движения. Раннее Обнаружен
FREE

This Indicator is a affordable trading tool because with the help of Popular Developers & Support of M Q L Platform I have programmed this strategy. I tried to combine logic of Moving Averages, Parabolic Stop And Reverse, Trend Strength, Oversold, Overbought . Furthermore, I have also care about Support Resistance that Trader can easily get in touch with market by selecting one indicator only. What is in for Trader?
Trading Modes: This selection is for activate whole strategy "Power Average" Sp
FREE
Product Title ZigZag Colored (MT4)
See also >> Smart ZigZag Pro , Smart ZigZag (free)
Short Description Dual‑color ZigZag for MT4 that solves the single‑line color limitation and provides EA‑ready buffers with current leg value and direction per bar. Overview Renders the classic ZigZag path as two color‑coded legs (up/down) for instant structure reading; per‑bar values exposed for EAs/indicators. Key Features Dual‑color legs (user colors); EA‑ready buffers ZigZag Up , ZigZag Down , ZigZag
FREE
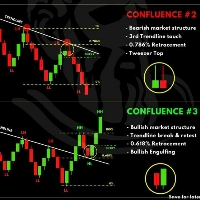
TRADING FLOW WITH AUTO TREND LINE FREE 1. Identify Market Structure Automatically Watch for key price action structures: BOS (Break of Structure) CHoCH (Change of Character) EQH / EQL (Equal High / Low)
These help you understand the current market phase (reversal or continuation) based on Smart Money Concept. 2. Use Auto Trend Line Trendlines are automatically drawn based on valid structure. Breakout of a trendline → potential trend change Rejection from a trendline → possib
FREE

We provide indicators tailored to better meet your trading requirements. >> MT Magical <<
MT Supply Demand :
It is an indicator created to find supply and demand, which will be important support and resistance levels for the price. Supply Zone is a zone where the price has reached, it is often resisted. In other words, when the price reaches this zone, there will be more selling power to push the price back down.
Demand Zone is a zone where the price has reached, it is ofte
FREE

Индикатор строит блоки заказов (БЗ) по торговой системе (ТС) Романа. Поиск блоков осуществляется одновременно на двух таймфремах: текущем и старшем (определяемым в настройках). Для оптимизации и игнорирования устаревших блоков в настройках задается ограничение количества дней в пределах которых осуществляется поиск блоков. Блоки строятся по правилам ТС состоящем из трех шагов: какую свечу вынесли (что?); какой свечой вынесли (чем?); правило отрисовки (как?).
FREE
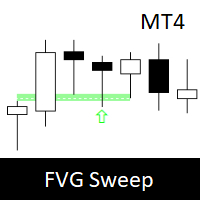
Fair Value Gap Sweep is a unique and powerful indicator that draws fair value gaps on your chart and alerts you when a gap has been swept by the price. A fair value gap is a price gap that occurs when the market opens at a different level than the previous close, creating an imbalance between buyers and sellers. A gap sweep is when the price moves back to fill the gap, indicating a change in market sentiment and a potential trading opportunity.
Fair Value Gap Sweep indicator has the following
FREE
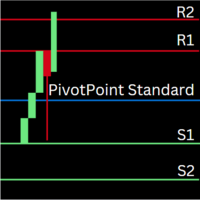
Pivot Point Indicator for MetaTrader 4 (MT4) Overview The Pivot Point Indicator calculates daily, weekly, and monthly pivot points and plots key support and resistance levels on your charts. This indicator helps traders identify potential reversal points and key areas of interest for price action, making it a valuable tool for both short-term and long-term trading strategies. Key Features Daily, Weekly, and Monthly Pivot Points : Easily switch between daily, weekly, and monthly pivot points by a
FREE

RSI divergence indicator is a multi-timeframe and multi-symbol indicator that help us find divergences between price chart and RSI indicator. Always use the divergence indicators with other technical assets like support resistance zones, candlestick patterns and price action to have a higher possibility to find trend reversals. This indicator will identify the peaks and troughs of both price and the RSI indicator. You can adjust the parameters to adjust the strength and weakness of these peaks a
FREE
FREE Heiken Ashi Smoothed indicator is fully adjustable, easy to use and comes with possibility to access the indicator via iCustom function so you can use it in your own trading software. Indicator can also pop up alerts when signal changes or send push notifications. For Metatrader 5 version click here: https://www.mql5.com/en/market/product/70825 For detailed information click: >>HERE<< Features
Easy to use Accessible via iCustom Fully adjustable Alerts and Push notifications Possib
FREE

The VWAP Level indicator is a technical analysis tool that calculates the weighted average price for the traded volumes of a specific asset. The VWAP provides traders and investors with the average price of an asset over a specific time frame.
It is commonly used by investors to compare data on "passive" trading operations, such as pension funds and mutual funds, but also by traders who want to check if an asset has been bought or sold at a good market price.
To calculate the VWAP level we us
FREE
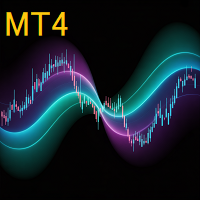
AP VWAP Bands Pro (MT4) Volume-weighted average price with ±σ bands for clear intraday bias, mean-reversion zones, and dynamic support/resistance. Works on crypto (incl. BTC), FX, indices, and metals. Uses tick-volume when real volume isn’t available.
What it shows VWAP line (volume-weighted mean price).
Two envelopes around VWAP (default ±1σ and ±2σ) to highlight balance vs. extension.
Reset modes: Day, Week, or Anchor Time (HH:MM) to start VWAP where you need it (e.g., exchange open).
Why
FREE

Bitcoin Trader Pro Indicator is an advanced tool specifically designed for analyzing the cryptocurrency market, with a focus on BTCUSD. This indicator combines multiple technical analysis methods to generate precise and reliable trading signals. Perfect for both beginner and experienced traders, the Bitcoin Trader Pro Indicator provides everything you need to make informed trading decisions. My indicators for free. I only ask that leave your feedback to help me improve them or as a thank you. H
FREE

The MT4 Sessions Indicator indicator highlights trading sessions directly on the chart by displaying them with colored candles.
It helps traders quickly see when price action occurred during specific market sessions or times of day. It’s especially useful for traders who work with volume profile, supply & demand zones, or level-based strategies, where the timing of a move is just as important as the price level.
By visually separating sessions, it becomes easier to spot patterns, compare sessi
FREE

Modified oscillator MACD. A classic indicator that combines a trend indicator with an oscillator to detect entry points. Has a multi-timeframe panel and 3 types of notifications
Benefits:
Works on all instruments and timeseries Trend indicator with oscillator for inputs Multi-period panel on all timeframes Pluggable arrows when signals appear Three types of notifications: push, email, alert
MT5 version -> HERE / Our news -> HERE
How the indicator works:
AW Classic MACD - Indicator of
FREE

Zig Zag 123 tells us when a reversal or continuation is more likely by looking at the shift in supply and demand. When this happens a signature pattern appears known as 123 (also known ABC) will often break out in direction of higher low or lower high.
Stop loss and take profit levels have been added. There is a panel that shows the overall performance of your trades for if you was to use these stop loss and take profit levels.
We get alerted if a pattern 123 appears and also if the price re
FREE

Trade History for MT4 This indicator is specially developed for that traders want to display his trades on the charts. Shows history and current deals on the chart. Trades show on the chart with a dotted line, and profit will show realtime. Buy trades are displayed in bull color, Sell trades in bear color.
Tip: The historical order displayed by the indicator is associated with the "Account History", so please set the historical order display in the "Account History" of MT software.
If you a
FREE

indicators to facilitate analysis based on Oma Ally's BBMA strategy by displaying CSAK (CSD), CSM and Extreme labels on the chart 1. Displays the Bollinger Band line 2. LWMA 5-10 High and Low 3. EMA 50 4. Fibonacci 5. MHV . area 6. Alert & Show labels BBMA consists of the use of 2 indicators: Moving Averages Bollinger Bands BBMA consists of 3 types of entries: Extreme MHV Re-Entry Moving Average Settings: There are 5 MAs used in the system: 2 High Moving Averages, 2 Low Moving Averages and
FREE
The MetaTrader Market is a simple and convenient site where developers can sell their trading applications.
We will help you post your product and explain you how to prepare your product description for the Market. All applications on the Market are encryption-protected and can only be run on a buyer's computer. Illegal copying is impossible.
You are missing trading opportunities:
- Free trading apps
- Over 8,000 signals for copying
- Economic news for exploring financial markets
Registration
Log in
If you do not have an account, please register
Allow the use of cookies to log in to the MQL5.com website.
Please enable the necessary setting in your browser, otherwise you will not be able to log in.