Guarda i video tutorial del Market su YouTube
Come acquistare un Robot di Trading o un indicatore
Esegui il tuo EA
hosting virtuale
hosting virtuale
Prova un indicatore/robot di trading prima di acquistarlo
Vuoi guadagnare nel Market?
Come presentare un prodotto per venderlo con successo
Indicatori tecnici gratuiti per MetaTrader 4 - 4
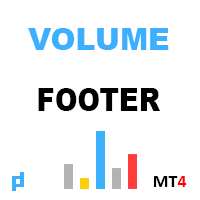
L'indicatore mostra il volume verticale. Nelle impostazioni ci sono 2 fattori per determinare l'alto e l'estremo e 1 per determinare il basso volume. Un algoritmo simile viene utilizzato anche nell'indicatore UPD1 Volume Pixel . Quando viene rilevato un volume specificato, l'istogramma viene colorato nel colore corrispondente. La larghezza dell'istogramma viene selezionata automaticamente, a seconda della scala. Di norma, il prezzo reagisce al volume massimo e minimo. Ma è necessario utilizzare
FREE

US30 Revolt a Technical indicator that is 100% non-repaint and appears on the current candlestick works on all timeframes (recommended M15,M30,H1) The indicator is made for US30 but it can be used on other pairs as well When a blue arrow appears look for buying opportunities When a orange arrow appears look for selling opportunities Please watch the YouTube video on how to properly set up and use the indicator
FREE
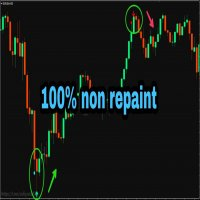
PLEASE NOTE You can customize the settings of K_period value, the oversold and the overbought value is customizable. You can change it as per your requirement. The accuracy will change as per your settings.
100% Non repaint indicator
Pre-alert (get ready) signals
Non-delay indications
24/7 signals
100% No lag
No recalculating The arrows wont repaint even if the signal fails, or you refresh or restart the mt4 Indicator is based on simple crossover strategy of main line and signal line of St
FREE
HTF MACD – Trend-Aligned Signals (one subwindow, arrows on chart) What it does
This indicator keeps you trading with the higher-timeframe trend while using MACD crosses for precise entries. In a single subwindow it shows: HTF Trend Histogram — green = uptrend, red = downtrend (neutral is hidden for a cleaner view) MACD Lines — blue = MACD main, orange = MACD signal Arrows on the price chart when a valid, trend-aligned MACD cross occurs Optional alerts on bar close Entry logic (strict, closed-ba
FREE

The indicator draws the time scale on the chart. You can specify the time offset, adjust the size and font to display on the chart (it is displaying your local time on your chart instead of MT time). You can also select the desired format for displaying the date and time. While holding down the middle mouse button, and moving the cursor, a slider will appear on the scale. You may be interested in my other product , which contains a more advanced version of the Time Scale.
You can also find my o
FREE

Effettuando il Backtest da gennaio 2023 a oggi si ottengono buoni risultati di rilevamento delle tendenze per i seguenti asset e time frame:
EURUSD Time frame: m15, m30, H1
AUDUSD Time frame: m15, m30 NASDAQ Time frame: m15 S&P 500 Time frame: m15, m30 XAUUSD Time frame: m30 BTCUSD Time frame: H4
Questi sono solo alcuni degli asset testati (si prega di notare che i risultati passati non garantiscono risultati futuri). Nota: questa non è una strategia completa, puoi usare questo indicatore c
FREE
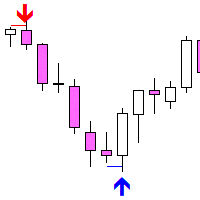
Fakey Detector — False Breakout (Fakey) Indicator Fakey Detector is an indicator that automatically detects the classic Fakey pattern (false breakout of an inside bar) from Price Action and displays it on the chart using an arrow and breakout level. How it works: The Fakey pattern consists of three candles: Mother Bar — the largest by range Inside Bar — fully contained within the Mother Bar's range Fakey Candle — breaks out (up or down), but then closes back inside the range The indicator
FREE

Detect strength for uptrends and downtrends by tracking Buy Power and Sell Power. Stay on the right side of the market by being able to determine whether the market is in a bull or bear trend and how strong the trend is.
Free download for a limited time! We hope you enjoy, with our very best wishes during this pandemic!
Trend Trigger Factor aims to ride out sideways movement, while positioning the trader in the correct side of the market to capture big trends when they occur. It was origin
FREE

Heikin Ashi Smoothed – Indicatore per MT4 Heikin Ashi Smoothed è un indicatore personalizzato per MetaTrader 4 (MT4) che migliora la rappresentazione dei grafici Heikin Ashi tradizionali applicando un ulteriore processo di smoothing tramite medie mobili. Questo metodo consente una visualizzazione molto più chiara e fluida delle tendenze, riducendo notevolmente il “rumore” del grafico e facilitando l’identificazione sia della direzione principale del mercato sia dei potenziali punti di inversione
FREE

Ichimoku Trend Alert is the Ichimoku Kinko Hyo indicator with Alerts and signal filters.
Ichimoku Trend Alert features: Optional check of Ichimoku cloud, Tenkan sen(Conversion Line), Kijun sen(Base Line), Senkou span A, Senkou span B, and Chikou span relative to price, and more. Popup, email, and phone notification alerts for selected symbols and timeframes.
There are 9 classic Ichimoku trend filters you can enable/disable in settings: Price/Cloud Order: Checks the price position relative to t
FREE

Indicatore Smarter Trend Channel Descrizione:
L'indicatore Smarter Trend Channel è uno strumento potente e flessibile progettato per aiutare i trader a identificare visivamente le principali tendenze di mercato tracciando dinamicamente linee di supporto e resistenza sui grafici dei prezzi. Utilizzando calcoli fractali avanzati, l'indicatore regola automaticamente le linee di tendenza in base alle condizioni di mercato, consentendo ai trader di individuare rotture e potenziali punti di inversion
FREE

Segui l'onda del trend – Un segnale chiaro per cavalcare la tendenza Nei mercati finanziari, le opportunità più affidabili di profitto si presentano quando c’è una tendenza ben definita. Tuttavia, anche per i trader esperti, non è facile identificare e seguire con precisione queste onde di mercato. Ride the Trend Signal è un indicatore di segnali progettato per individuare punti d'ingresso durante i ritracciamenti nelle fasi di trend. Invece di puntare sull'inizio del movimento, aspetta una conf
FREE
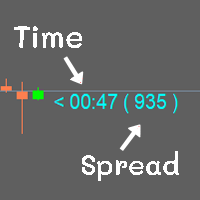
Show the time of candlesticks and spread. All data will be displayed in a rod. Can change color Can fix the size as needed
MT4 : Link https://www.mql5.com/en/market/product/102742 MT5 : Link https://www.mql5.com/en/market/product/102834
Most free code on various websites I didn't write it myself. I only do a little bit.
If you like it, please give 5 stars with it. Thank you.
FREE

Evolutionize Your Trading with the UT Alert Bot Indicator for MQL4 The UT Alert Bot Indicator is your ultimate trading companion, meticulously designed to give you an edge in the fast-paced world of financial markets. Powered by the renowned UT system, this cutting-edge tool combines advanced analytics, real-time alerts, and customizable features to ensure you never miss a profitable opportunity. Whether you’re trading forex, stocks, indices, or commodities, the UT Alert Bot Indicator is your k
FREE

RSI TrendGate 3MA è un indicatore da visualizzare sul grafico che aiuta a confermare la direzione del trend utilizzando RSI e tre medie mobili (MA).
Quando, in base alle condizioni selezionate, lo stato viene considerato “prevalentemente rialzista” o “prevalentemente ribassista”, l’indicatore disegna una freccia nella finestra del grafico. Questo prodotto non è progettato per usare le frecce come segnale di ingresso autonomo. L’uso consigliato è confermare la direzione su un timeframe superiore
FREE

This program will make analysing multiple timeframes more convenient.
It will help to sync all charts in a different Timeframe sync charts to show same symbol, same specific time period and sync drawing objects Show on all charts at the same time
How to use it >> https://youtu.be/NEHUW7v1h1c In this edition there are only 6 object types that can be synced all chart. Drawing Object Type Support : Vertical/Horizontal Line, Trendline, Rectangle, Arrow, Fibo-Retracement
Additional Feature: T
FREE

Keltner Channel is a well known indicator that not in MT4's indicators default lineup (You can get this from your broker somehow). This indicator helps you to define trend and sometimes overbought/oversold prices during flat trend. Input Description: EMAperiod: Moving Average period used for indicator. Must be higher than 1. ATRperiod: Average True Range period used for indicator. Must be higher than 1. multiplier: Multiplier used for determine channel's wide. Must be higher than 0 but may not b
FREE

BREAKOUT-SESSION-BOX LONDON EU US ASIA Open
watch the expectation of a volatile movement above or under the opening range We take the high of the range as Entry for a long trade and SL will be the low of the range and vice versa the low of the range as Entry for a short trade and the high for SL The size of the range is the distance to the TP (Take Profit) The range of the opening hours should not be larger than about 1/3 of the average daily range 4 breakout examples are already predefined: A
FREE
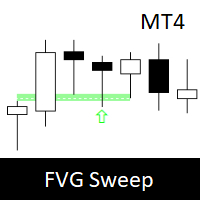
Fair Value Gap Sweep is a unique and powerful indicator that draws fair value gaps on your chart and alerts you when a gap has been swept by the price. A fair value gap is a price gap that occurs when the market opens at a different level than the previous close, creating an imbalance between buyers and sellers. A gap sweep is when the price moves back to fill the gap, indicating a change in market sentiment and a potential trading opportunity.
Fair Value Gap Sweep indicator has the following
FREE
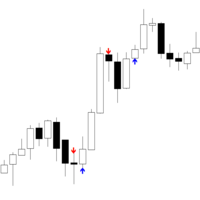
Frase breve:
Iceblock — indicatore MT4 che identifica cluster di alto volume con limitato movimento di prezzo (comportamento simile a iceberg). TF:
Funziona su tutti i timeframe (M1–D1). Coppie:
Compatibile con Forex, indici, oro e CFD. Impostazioni: VolumeLookback – numero di candele per la media del volume VolumeThreshold – moltiplicatore per considerare il volume anormale ClusterSize – numero di candele vicine per confermare un cluster RangeComparisonPeriod – periodo per la media degli int
FREE
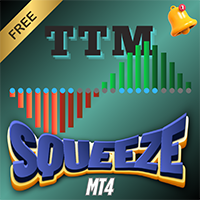
Overview
The TTM Squeeze indicator helps identify low volatility periods (squeeze) that often precede price breakouts. It uses Bollinger Bands (BB) and Keltner Channels (KC) to determine when the market is "coiling" and ready to move. Configuration Guide Volatility Settings The indicator uses Bollinger Bands to measure market volatility. When BBs are inside Keltner Channels, a squeeze is detected. The squeeze suggests the market is consolidating and may soon break out. True Range Option Optiona
FREE

PLEASE NOTE You can customize the settings of Fast EMA, Slow EMA, MACD SMA & Main SMA. The accuracy will change as per your settings.
100% Non repaint indicator
Pre-alert (get ready) signals
Non-delay indications
24/7 signals
100% No lag
No recalculating The arrows wont repaint even if the signal fails, or you refresh or restart the mt4 Indicator is based on simple crossover strategy of main line and signal line of MACD indicator in consideration with zero line and Main SMA. The best thing
FREE
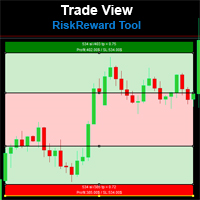
Risk Reward Tool , It is easy to use. With this tool you can see the rates of profit loss profit. You can see your strategy and earnings reward status of your goals.Double calculation can be done with single tool. Move with drag and drop. You can adjust the lot amount for calculations. The calculation results are shown in the comment section. There may sometimes be graphical errors during movements. Calculations works at all currency. Calculations All CFD works. Updates and improvements will co
FREE
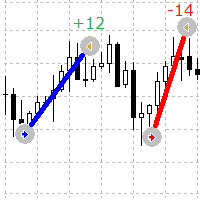
Un indicatore semplice ma utile per vedere visivamente i punti di entrata e di uscita degli ordini sul grafico
Questo indicatore mostra gli ordini aperti correnti e gli ordini completati sul simbolo
Parametri indicatori
Lines Buy color - specifica il colore delle linee per gli ordini di acquisto Lines Sell color - specifica il colore delle linee per gli ordini di vendita Lines Width - imposta la larghezza della linea, funziona per i tipi di stile Solido Lines style - imposta lo stile delle
FREE

Индикатор MQLTA Supertrend Multi Timeframe сочетает в себе значения Supertrend, найденные на нескольких таймфреймах, чтобы подтвердить тренд пары. Для работы утилиты необходим бесплатный индикатор MQLTA Supertrend Line - https://www.mql5.com/en/market/product/25951.
Как он работает? Индикатор проверяет состояние Supertrend на всех выбранных таймфреймах и отображает результат в виде легко читаемой таблицы.
Как торговать с помощью индикатора Supertrend Multi Timeframe Покупку следует совершать,
FREE

Indicatore di Segnale di Incrocio VWAP per MetaTrader 4
Sblocca la Precisione nel Trading con l'Indicatore di Segnale di Incrocio VWAP!
Migliora la tua strategia di trading con l'Indicatore di Segnale di Incrocio VWAP, uno strumento potente e intuitivo progettato per MetaTrader 4. Creato per i trader che richiedono precisione e chiarezza, questo indicatore personalizzato utilizza il Prezzo Medio Ponderato per Volume (VWAP) per fornire segnali di acquisto e vendita direttamente sul tuo grafico
FREE
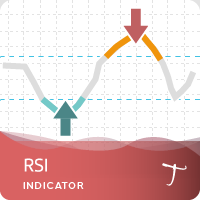
Tipu RSI Features 28 symbols, multi-time frame powerful Dashboard for the full market view Customizable Buy/Sell alerts, push alerts, email alerts, and visual on-screen alerts. Marked overbought and oversold levels. Three colors RSI that marks the normal, oversold and overbought levels. The relative strength index (RSI) is an oscillator devised by J. Welles Wilder in his famous book New Concepts in Technical Trading Systems in 1978.1 He also introduced Parabolic SAR (see Tipu Parabollic SAR Pane
FREE

Unlock Precision Trading with Pinpoint Extreme Swing! Are you tired of missing out on crucial market reversals? Do you wish you had a reliable tool to spot high-probability swing trading opportunities? Look no further! The Pinpoint Extreme Swing indicator is your ultimate partner in navigating the dynamic world of trading, designed to give you the edge you need to succeed. This powerful MQL4 indicator is engineered to identify significant market turning points by intelligently combining the Mon
FREE

This is an implementation of the well known SuperTrend Indicator. With this indicator you can see exactly the same values which will be alerted by the following SuperTrend Scanners:
SuperTrend Scanner SuperTrend Scanner FREE
Parameters SuperTrendATRPeriod: the period setting for the calculation of the SuperTrend SuperTrendMultiplier: the multiplier setting for the calculation of the SuperTrend
FREE
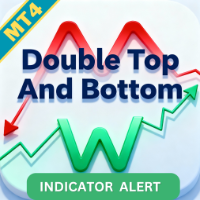
Double top and bottom indicator is a pattern scanning indicator which scans the tops and bottoms using zig zag pattern. When it find price bouncing back from the same point twice after a long trend then it generate arrow signals whenever the last resistance points is broken for double bottom and last support price broken for double top. Unlike other top bottom scanner it does not give only 1 signal. it alerts user when ever the last support /resistance is broker from double top/bottom pattern un
FREE

RSI divergence indicator is a multi-timeframe and multi-symbol indicator that help us find divergences between price chart and RSI indicator. Always use the divergence indicators with other technical assets like support resistance zones, candlestick patterns and price action to have a higher possibility to find trend reversals. This indicator will identify the peaks and troughs of both price and the RSI indicator. You can adjust the parameters to adjust the strength and weakness of these peaks a
FREE
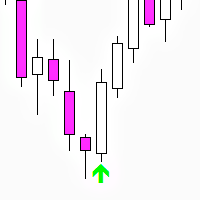
Three Bar Reversal (MT4) — free indicator Three Bar Reversal is a simple and effective MetaTrader 4 indicator that detects the classic three-bar reversal candlestick pattern with additional filtering based on ATR and candle body sizes.
Arrows are displayed on the last closed candle of the pattern, and push notifications are also sent. An automated trading robot Three Bar Reversal EA has been developed based on this indicator. The indicator works on all currency pairs and timeframes but pe
FREE

Zig Zag 123 tells us when a reversal or continuation is more likely by looking at the shift in supply and demand. When this happens a signature pattern appears known as 123 (also known ABC) will often break out in direction of higher low or lower high.
Stop loss and take profit levels have been added. There is a panel that shows the overall performance of your trades for if you was to use these stop loss and take profit levels.
We get alerted if a pattern 123 appears and also if the price re
FREE

Tipu Trend is a non-lag, non-repaint, smart indicator, that shows the trend of selected time frames.
Features Customizable Buy/Sell alerts, push alerts, email alerts, or visual on-screen alerts. As easy to trade indicator that smooths the noise in the price action. Highlights ranging markets. Add Tipu Panel (found here ) and unlock the following additional features. An easy to use Panel that shows the trend + signal of the selected time frames. Customizable Panel. The panel can be moved to any
FREE
This is a powerful, session-aware breakout indicator designed for serious traders who thrive on volatility and structure. Engineered for precision, it identifies high-probability breakout zones during the London and New York trading sessions—where the market moves with intent. Key Features: Session Range Detection
Automatically detects and highlights the key price range of London and New York sessions. Breakout Confirmation
Identifies breakout candles after the session range, with cl
FREE

''A professional trader is a greedy trader: he buys at lows and sells at highs with minimal risks and high returns,,
Neuro Scalper is developed exactly for such trading approach . It's a universal indicator for tracking reversals and uses price action patterns, discrepancy of custom indicators and a multi-layered formula for identifying reversal structures. The indicator is very easy to use; it only shows arrows where is recommended to buy or sell. The indicator is universal and suitable f
FREE

Overview Happy Lion is a Smart Money Zone indicator, it scans historical data to identify specific candlestick patterns, these are the areas where large institutions (banks/hedge funds) leave behind significant "footprints" in the form of unfilled orders. Demand Zones (Bullish): Highlights the last bearish candle before a strong, impulsive upward breakout. Supply Zones (Bearish): Highlights the last bullish candle before a strong, impulsive downward breakout. Automatic Drawing: Once a valid zon
FREE

Indicatore di sessione Ziwox World Map per MetaTrader 4 Porta la consapevolezza del mercato globale direttamente nei tuoi grafici!
Il nostro indicatore World Map Session mostra una mappa mondiale in tempo reale come sfondo del tuo grafico MT4, perfettamente sincronizzata con la sessione di trading corrente. Funzionalità principali: Sincronizzazione della sessione in tempo reale : vedi esattamente dove ti trovi nella timeline globale; la candela corrente è allineata alla sua posizione sulla mappa
FREE

Stochastic RSI Indicator - Master the Art of Timing Elevate your trading game with the "Stochastic RSI Indicator." This powerful tool marries the Stochastic oscillator with the Relative Strength Index (RSI), offering precise insights into market dynamics. It's your key to mastering the art of timing in trading. About the Indicator : The Stochastic RSI Indicator combines two robust indicators - Stochastic and RSI - to provide traders with an exceptional tool for identifying entry and exit points
FREE
How To Trade
Execute your trades in 3 Easy Steps!
Step 1: Trade Setup Entry Buy in Signal price and TP1 in price indicator, You can use trailing stop in TP1. Entry Sell in Signal price and TP1 in price indicator, You can use trailing stop in TP1. Success Rate ≥ 75% 100:25 Step 2: Set Stop Loss Stop loss BUY ----> You can set stop loss on Line Order SELL. Stop loss SELL ----> You can set stop loss on Line Order BUY. Step 3: Set Take Profit Option 1: Take profit on TP1. Option 2: Partial take pr
FREE

Questo indicatore è uno strumento interattivo di etichettatura delle Onde di Elliott per MetaTrader 4 e 5.
Consente all’utente di posizionare manualmente le etichette delle onde direttamente sul grafico, selezionando la dimensione dell’etichetta, il colore e il tipo di onda (correzioni ABC, impulsi a 5 onde o strutture WXY) da un menu sul grafico.
Con un solo clic sul grafico, l’indicatore posiziona in modo sequenziale le etichette delle onde appropriate nel prezzo e nel tempo scelti, aiutando i
FREE

Il Matrix Arrow Indicator Multi Timeframe Panel MT4 è un componente aggiuntivo gratuito e una grande risorsa per il tuo Matrix Arrow Indicator MT4 . Mostra l'attuale segnale Matrix Arrow Indicator MT4 per 5 timeframe personalizzati dall'utente e per 16 simboli/strumenti modificabili in totale. L'utente ha la possibilità di abilitare/disabilitare uno qualsiasi dei 10 indicatori standard di cui è composto il Matrix Arrow Indicator MT4 . Anche tutti i 10 attributi degli indicatori standard sono re
FREE

The MACD 2 Line Indicator is a powerful, upgraded version of the classic Moving Average Convergence Divergence (MACD) indicator.
This tool is the embodiment of versatility and functionality, capable of delivering comprehensive market insights to both beginner and advanced traders. The MACD 2 Line Indicator for MQL4 offers a dynamic perspective of market momentum and direction, through clear, visually compelling charts and real-time analysis. Metatrader5 Version | How-to Install Product | How-to
FREE
Keltner Signals Pro: Trade Smarter, Earn More! Keltner Signals Pro Now available in EA format. Download Now. Boost your trading accuracy and eliminate false signals with Keltner Signals Pro – the advanced yet intuitive indicator designed for serious traders seeking consistent profits! Tired of misleading trading signals? Keltner Signals Pro masterfully combines the power of Keltner Channels for identifying crucial price breakouts with an unbeatable EMA200 Trend Filter . The result? More accurate
FREE
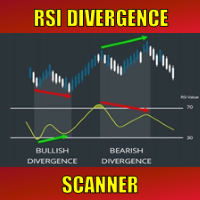
Special offer : ALL TOOLS , just $35 each! New tools will be $30 for the first week or the first 3 purchases ! Trading Tools Channel on MQL5 : Join my MQL5 channel to update the latest news from me Nei mercati finanziari dinamici, identificare i segnali di inversione di tendenza è essenziale per un trading efficace. L'RSI Divergence Scanner è progettato per aiutarti a rilevare segnali di divergenza RSI su varie coppie di valute e timeframe in modo accurato ed efficiente. Vedi più v
FREE
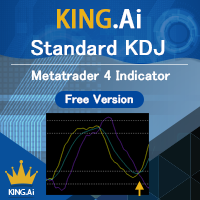
The standard KDJ indicator is presented by KING.Ai. This indicator were built base on the the theory of KDJ . KDJ is a very effective and useful strategy to trade especially in swing trading. Method to apply (please also refer to the graphic): 80/20 rule: Price from bottom to top 20 to 80. And price from top to bottom 80 to 20. Both is enter market signal. Indicator period: The indicator is made by period 9,3,3 KING.Ai Forex trader believe that such strategy must complement with other indicato
FREE
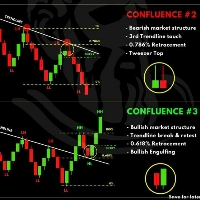
TRADING FLOW WITH AUTO TREND LINE FREE 1. Identify Market Structure Automatically Watch for key price action structures: BOS (Break of Structure) CHoCH (Change of Character) EQH / EQL (Equal High / Low)
These help you understand the current market phase (reversal or continuation) based on Smart Money Concept. 2. Use Auto Trend Line Trendlines are automatically drawn based on valid structure. Breakout of a trendline → potential trend change Rejection from a trendline → possib
FREE

Trade History for MT4 This indicator is specially developed for that traders want to display his trades on the charts. Shows history and current deals on the chart. Trades show on the chart with a dotted line, and profit will show realtime. Buy trades are displayed in bull color, Sell trades in bear color.
Tip: The historical order displayed by the indicator is associated with the "Account History", so please set the historical order display in the "Account History" of MT software.
If you a
FREE
Signal King: Your Supreme Trend Indicator Ever felt lost in the noise of the market? The "Signal King" indicator cuts through the chaos, delivering clear, high-probability buy and sell signals directly to your chart. This isn't just another trend indicator; it's a powerful tool designed to give you an edge by combining the robust Supertrend with a reliable EMA filter . The Supertrend excels at identifying the overall market direction, while the EMA acts as a powerful confirmation filter. This du
FREE
This is a Multi pair and Multi time frame dashboard. The founder of the system is Mr. Oma Ally, which is a system based from Bollinger Band and Moving Average(BBMA). BBMA consists of the use of 2 indicators: Moving Averages Bollinger Bands BBMA consists of 3 types of entries: Extreme MHV Re-Entry Rejection EMA50 This Dashboard Help you to scan current Extreme, Reentry setup, Rejection EMA50 and also MHV How to read signals:
find the same color in 3 different timeframes in succession
For exampl
FREE

Calculation of Lot Size for many traders is a big challenge.
A case that is very important in money management. What many traders ignore.
Choosing an appropriate Lot Size in trades can improve results and it will ultimately lead to success.
This indicator calculates the authorized Lot Size for your trades.
The indicator uses the following values to get the appropriate Lot Size for positioning:
The distance of Stop Loss.
The Pip Value.
The amount of Risk Allowed For Each Trade.
The amoun
FREE

Discover the power of precision and efficiency in your trading with the " Super Auto Fibonacci " MT4 indicator. This cutting-edge tool is meticulously designed to enhance your technical analysis, providing you with invaluable insights to make informed trading decisions. Key Features: Automated Fibonacci Analysis: Say goodbye to the hassle of manual Fibonacci retracement and extension drawing. "Super Auto Fibonacci" instantly identifies and plots Fibonacci levels on your MT4 chart, saving you tim
FREE
Key Features of the Indicator: Buy & Sell Signals: The indicator generates buy and sell signals based on specific conditions. It uses the crossover of the Fast Moving Average (Fast MA) and Slow Moving Average (Slow MA) to determine market entries. The RSI (Relative Strength Index) is used to identify buy signals when RSI is above 50 and below 75. It also considers support and resistance levels for additional confirmation of signals. Trend Filter: The market trend is identified using a Trend Movi
FREE

BeST_Gann Hi-Lo Strategy is an MT4 indicator that is based on the Gann Hi-Lo Activator the famous trend-following indicator that allow us to to enter a trade quite early while also stay in a trade as longer as we can for taking profit.While it is built of a moving average it helps traders determine the direction of the trends and to produce with-trend trading signals.
This indicator is in fact a simple moving average of the highs and lows of the previous period. It follows the trends in the mark
FREE

Background : Forex swing trading is a short-to-medium-term strategy aiming to profit from price "swings" (short uptrends/downtrends) within larger market moves.
This is a simple system that trades the rejection of a previous swing high/low . The system is non repaint and easy to use.Please use with discretion , it gives a decent accuracy and would definitely improve your trades. You can use on any pair and timeframe
FREE

Pivot trading:
1.pp pivot
2. r1 r2 r3, s1 s2 s3 Necessary for traders: tools and indicators Waves automatically calculate indicators, channel trend trading Perfect trend-wave automatic calculation channel calculation , MT4 Perfect trend-wave automatic calculation channel calculation , MT5 Local Trading copying Easy And Fast Copy , MT4 Easy And Fast Copy , MT5 Local Trading copying For DEMO Easy And Fast Copy , MT4 DEMO Easy And Fast Copy , MT5 DEMO
Strongly recommend trend indicators, auto
FREE

Pullback Power: Catch the Trend, Maximize Your Profit! Tired of chasing trades and getting caught in market noise? The Pullback Power indicator is your essential tool for finding high-probability entries in a trending market. It's not about guessing; it's about trading with confidence, knowing you have a system designed to confirm genuine trend continuation after a brief pullback . This smart indicator combines the reliability of EMA Crosses for established trend direction with the dynamic conf
FREE

The Supreme HmaSignal indicator is an indicator for trend trading , its main character is the hull moving average colored line , and secondary is buy and sell arrows , arrows are fair but the main focus is on the colored hma , this indicator does not repaint or back paint or delay its signals. if you like this indicator please check my Supreme Trendhisto: here , and my Supreme Diamond indicator : here
Parameters: HMA Period HMA Smoothing HMA Price (close/open) Signal Period (Arrows)
FREE

L'indicatore rappresenta i Livelli di Pivo Points. E' possibile specificare il numero dei giorni per il quale l'indicatore viene visualizzato. Per il Forex non viene considerata la sessione di Domenica. E' possibile modificare per ogni livello colore, tipo e spessore linea .La visualizzazione avviene meglio con timeframe inferiori all'H1. Vengono graficati 4 livelli di supporto e resistenza con anche i livelli intermedi che è possibile disabilitare.
FREE

Pips Hunter PRO è stato sviluppato nel corso di diversi anni ed è una versione migliorata del suo predecessore. Questo potente indicatore analizza il mercato e la storia dei prezzi per generare entrate in acquisto e in vendita. Per il calcolo di queste entrate utilizza diversi indicatori che lavorano insieme, nonché un complesso logaritmo statistico che filtra le entrate meno favorevoli e le elimina / versione MT5 .
Caratteristiche Nessuna riverniciatura
Questo indicatore non cambia i suoi va
FREE

Il pannello TPSpro Risk Manager è uno strumento utile per chi desidera rimanere informato sullo stato attuale del proprio conto. Questo pannello fa parte del nostro sistema di Gestione del Rischio ed è integrato nel nostro prodotto più potente , TPSpro Risk Manager .
Il pannello è composto da tre colonne, ciascuna contenente informazioni utili. La prima colonna mostra le informazioni sul conto all'inizio del mese corrente, mostrando il risultato complessivo in percentuale e la valuta de
FREE
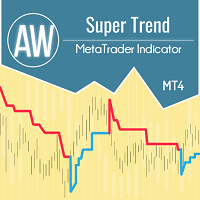
AW Super Trend - Questo è uno degli indicatori di tendenza classici più popolari. Ha un'impostazione semplice, ti consente di lavorare non solo con la tendenza, ma mostra anche il livello di stop loss, che viene calcolato da questo indicatore. Benefici:
Strumenti: Coppie di valute , azioni, materie prime, indici, criptovalute. Tempi: М15 e superiori. Tempo di negoziazione: tutto il giorno. Mostra la direzione del trend attuale. Calcola lo stop loss. Può essere utilizzato quando si lavo
FREE
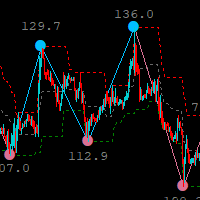
basato sull'indicatore a zigzag, l'indicatore del canale alto basso a zigzag è uno strumento per avvisare il trader di un cambiamento di tendenza, è di grande utilità
poiché avvisa tempestivamente di un cambiamento nella tendenza attuale, l'indicatore ha un'opzione su più intervalli di tempo per scambiare intervalli di tempo più alti o più bassi
canale sull'intervallo di tempo corrente, questo indicatore è un'aggiunta al tuo sistema/strategia e può essere utilizzato come strumento autonomo per f
FREE

BeST Oscillators Collection is a Composite MT4 Indicator including the Chaikin,Chande and TRIX Oscillators which by default are contained in MT5 but not in MT4 platform. It also provides the option of displaying or not a Mov. Avg. as a Signal Line and the resulting Signals as Arrows in a Normal (all arrows) or in a Reverse Mode (without showing up any resulting successive and of same type arrows). Analytically for each one of the specific Oscillators: The Chaikin Oscillator ( CHO ) is
FREE

Sentinel Arrow Caratteristiche principali:
⊗Un algoritmo esclusivo per identificare rapidamente e accuratamente trend, inversioni e variazioni di momentum. ⊗Progettato per uso professionale, è dotato di una solida logica di segnale che elimina ritardi o falsi aggiornamenti. ⊗Adatto a diversi intervalli temporali. ⊗Non ridisegna, elimina o modifica i segnali passati. ⊗Tutti i segnali di ACQUISTO e VENDITA vengono generati sulla candela stessa e rimangono fissi. ⊗Nel trading reale, non c'è alcun
FREE
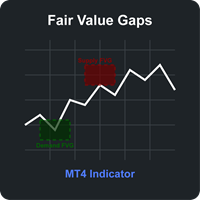
Fair Value Gaps (FVG) Indicator for MT4 The Fair Value Gaps (FVG) Indicator is a powerful technical analysis tool designed to identify and visualize significant price imbalances in the market. These gaps, created when price makes a strong directional move, represent areas where price has moved so quickly that no trading activity occurred, potentially indicating institutional interest and strong market momentum. Key Features: Dual Gap Detection : Automatically identifies both Supply FVGs (bearish
FREE

This is a Sharkfin Arrows Indicator. Detailed explanation and TDI extras: https://www.mql5.com/en/blogs/post/759138
This indicator will show only Arrows. It does not have TDI symbols on chart. Please get the extras from links above for TDI indicators.
Sharkfin Scanner (paid): https://www.mql5.com/en/market/product/123566
TDI Scanner Dash (paid): https://www.mql5.com/en/market/product/41826
About: This Indicator finds the Shark Fin Pattern. It will show an arrow in the current bar if RSI sha
FREE
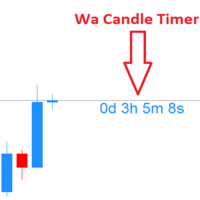
Wa Candle Timer MT4 è un indicatore potente e intuitivo progettato per mostrare il tempo rimanente prima della formazione della prossima candela sul grafico MT4. Aiuta i trader a tenere sotto controllo i tempi di chiusura delle candele per operazioni più precise. Caratteristiche principali :
Visualizza il conto alla rovescia della candela in corso
Cambia colore quando il tempo scende sotto una soglia impostata
Novità nella versione 3.00: avviso personalizzabile al raggiungimento di una
FREE

Sei pronto a diventare lo Sherlock Holmes del trading forex? ️️ Presentiamo l'ultimo strumento per il trading: l'indicatore Lisek Levels and Channels !!! Dimentica di fare il giocoliere con più indicatori come in un numero da circo. Abbiamo racchiuso tutto ciò di cui hai bisogno in uno spettacolo impressionante: Livelli di prezzo? Fatto! Canali di prezzo? Ci puoi scommettere! VWAP del prezzo? Oh sì! Volume On Balance? C'è tutto! E la ciliegina sulla torta? Allarmi e notifiche push
FREE
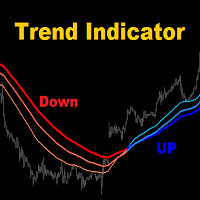
MA3 Trend - is the good trend indicator on three MAs. Benefits of the indicator: The indicator produces signals with high accuracy.
The confirmed signal of the indicator does not disappear and is not redrawn.
You can trade on the MetaTrader 4 trading platform of any broker.
You can trade any assets (currencies, metals, cryptocurrencies, stocks, indices etc.).
You can trade on any timeframes (M5-M15 scalping and day trading / M30-H1 medium-term trading / H4-D1 long-term trading). Individua
FREE
Il MetaTrader Market è l'unico negozio online dove è possibile scaricare la versione demo gratuita di un robot di trading che consente di effettuare test e ottimizzazioni utilizzando dati statistici.
Leggi la descrizione dell'applicazione e le recensioni di altri clienti, scaricala direttamente sul tuo terminale e prova un robot di trading prima di acquistarlo. Solo sul MetaTrader Market è possibile testare un'applicazione in modo assolutamente gratuito.
Ti stai perdendo delle opportunità di trading:
- App di trading gratuite
- Oltre 8.000 segnali per il copy trading
- Notizie economiche per esplorare i mercati finanziari
Registrazione
Accedi
Se non hai un account, registrati
Consenti l'uso dei cookie per accedere al sito MQL5.com.
Abilita le impostazioni necessarie nel browser, altrimenti non sarà possibile accedere.