Watch the Market tutorial videos on YouTube
How to buy а trading robot or an indicator
Run your EA on
virtual hosting
virtual hosting
Test аn indicator/trading robot before buying
Want to earn in the Market?
How to present a product for a sell-through
Free Technical Indicators for MetaTrader 4 - 8

Description:
This indicator (with its algorithm) marks relative highs and lows, which have an array of useful applications.
This indicator will never repaint.
Features:
Marks relative highs and lows Use this to determine points of trend continuation i.e. where the trend may pull back before continuing higher or lower, past this point Or use this to determine potential points of reversal, particularly in ranging markets, or with other price action These highs and lows can sometimes be us
FREE
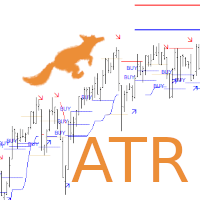
Are you looking for ATR Levels, ATR Trend, ATR Support and Resistance Indicators ? Now you have all in one !!! Info on your chart is showing you: where current price and levels are, what is current trend and signals. Search for an entry with low risk for trading by Lisek ATR Indicator. There are many ways to trade with Lisek ATR Indicator: Trade Support and Resistance Levels. Trade pullbacks (Range trading). Trade breakouts. Trade reversals. Take profit or set stop-loss based on ATR Levels.
FREE
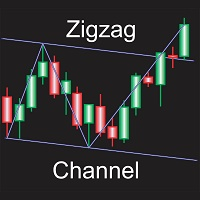
Automatically draws channel base on zigzag, with option to draw zigzag based on candle wicks or close prices. All zigzag parameters can be adjusted in settings, option to display or hide zigzag also available, every other adjustable settings are self explanatory by their name, or at least so I believe. Only download this indicator if you need a program to automatically plot channels for you based on zigzag of any specific settings.
FREE

Boost your trend-spotting capabilities with the Consecutive Candle Indicator MT4, a dynamic tool designed to identify streaks of bullish or bearish candles, delivering timely alerts for trend confirmations and potential reversals in forex, stocks, crypto, and commodities markets. Celebrated in trading communities like Forex Factory and Reddit’s r/Forex, as well as praised in discussions on Investopedia and TradingView for its ability to simplify momentum analysis, this indicator is a favorite a
FREE

4 trendlines are given by 2 timeframes, defined by the zigzag indicator. It leverages the Zig Zag indicator to identify significant highs and lows across two configurable timeframes (default: M15 for short-term and H1 for medium-term), automatically plotting upward and downward trendlines for each. This helps visualize trend structures, reversals, and alignments between timeframes without switching charts, while adhering to trendline rules that contain the high and low points of the previous two
FREE

The indicator synchronizes eight types of markings on several charts of one trading instrument.
This indicator is convenient to use in conjunction with "Multichart Dashboard" or other similar assistant that allows you to work with several charts at the same time.
"Multichart Dashboard" can be found under the link on my youtube channel.
Settings:
enable vertical line synchronization
enable horizontal line synchronization
enable Trend Line synchronization
enabling Fibonacci Retracement synchron
FREE

The Pivot Point indicator automatically calculates and displays the pivot point line and support and resistance levels. Pivot can be calculated according to the Classic, Floor, Fibonacci, Woodie, Camarilla or DeMark formula. It is also possible to select the period for calculating the indicator. A trader can choose from daily, weekly, monthly, or user-defined periods.
Types of pivots Classic Floor Fibonacci Woodie Camarilla DeMark
Main features The indicator shows the current and historic
FREE

Magnetic Price Finder indicator, the average price to which the price tends to return. Optimized for XAUUSD H1. It has 3 lines, the central one being the price to focus on. Based on historical data, the success rate of returning to the average price was over 92% with default settings; in other cases, the stop loss, which is set by default, was triggered. The entry point and entry time are approximately at the beginning of the day, and for convenience, the first candle of the new day is marked wi
FREE
This indicator is a professional Trend identifier, it measures the angle or slope of moving averages with different methods. As this indicator calculate angles you can identify the strength of trend by magnitude of angle. It also shows if angle is increasing or decreasing which gives you the opportunity to make more information about current trend. You can combine this indicator with your strategy as a filter or you can use it alone to make your trading system. This is not a repainting indicator
FREE

See RSI values turned into colored candles
This indicator provides both colored candles and a colored moving average. 6 drawaing styles are provided to allow customization of the color coding.
Applying coding to the chart may help in conceptualizing price trend and impulse movements defined through RSI values.
Features - optional colored candles - optional colored ma - 6 draw styles; RSI slope RSI above/below overbought/oversold levels RSI above/below level 50 RSI above/below it's moving average
FREE

This indicator is an addition to "Trend Edges."
The "Trend Edges histogram" indicator determines whether the trend is rising or falling. It is suitable for any time frame (tested on DAX).
Find a trending pair, index or CFD. Additionally :
-Sound alert on trend change.
-Alert Notification
-Alert Notification on your mobile phone Check my other indicators.
FREE

Introduction RSI divergence is a main technique used to determine trend reversing when it’s time to sell or buy because prices are likely to drop or pick in the charts. The RSI Divergence indicator can help you locate the top and bottom of the market. This indicator finds Regular divergence for pullback the market and also finds hidden RSI Divergence to show continuing trend. This indicator shows divergence on the RSI that is a strong hint for an excellent entry point and finds immediately with
FREE

Introduction To Time Box Indicator Time Box Indicator is a must have indicator for any trader. It will display daily, weekly and Monthly box according to your preferences. Yet, you can extend any important price levels in your chart automatically. You can use them as the significant support and resistance levels. It is very simple but effective tool for your trading.
Graphic Setting Use White Chart Line Style for Current Open price
Daily Setting Update Timeframe for daily box Number of days to
FREE
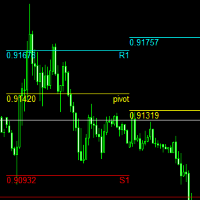
pivot points using by many traders and pivot levels most of the times are very helpfull . this indicator is a custom with internal parameters. it can show two times pivot (weekly and daily). you can choose periods total for each time showing pivots.( 1 week , 2 week ,...1day , 2day ,...) when use weekly and daily pivots , it can show you many support and resistance zones. if have proposal comment too me for upgrading indicator.
FREE
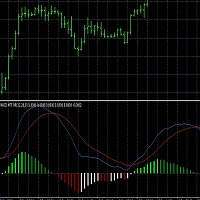
This script generates a MACD with 6 color-coded histogram bars based on the position (above or below zero) and direction (rising or falling) of the histogram. It provides multi-time frame support , allowing users to view the MACD from different time frames on a single chart. The indicator uses customizable settings for MACD periods, histogram width, and vertical scaling. This script could be useful for traders who want a visually enhanced MACD with clearer trend and momentum representation acro
FREE

Moving Average Trend Alert is a triple MA indicator that helps traders to identify potential market trends based on 3 MAs alignment and crossover.
Moving Average Trend Alert features: Customizable short-term, medium-term, and long-term MAs. Option to filter signals based on a minimum distance between moving averages to avoid premature MAs alignment. Optional Filter of signals with RSI indicator overbought/oversold levels. Optional Filter of signals with ADX indicator. Popup, email, and phone no
FREE

Catch The Turn: The 5-Factor Confluence Trading System Tired of conflicting indicators and missed entries? is your complete decision engine, designed to cut through market noise and deliver high-confidence entry signals exactly when a major market move begins. The Power of 5-in-1 Confluence Stop trading on doubt. Our proprietary engine eliminates false signals by generating a trade signal only when five independent, proven indicators are in full, unequivocal agreement. This rigorous confirmatio
FREE
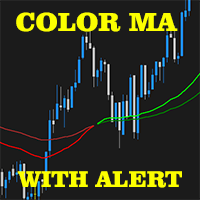
2 EMA Color Alerts Indicator is a powerful tool for any trader looking to stay on top of market movements. By using exponential moving averages (EMAs), this indicator can provide early warning signals for potential market reversals and trend changes. One of the key features of the 2 EMA Color Alerts Indicator is its customizable alerts. With this feature, traders can set their own parameters for receiving alerts, such as the EMA periods and the type of alert (e.g. sound, pop-up, email). This al
FREE

his indicator automatically identifies key support and resistance levels by analyzing volume patterns. Unlike traditional S/R tools that rely only on price, Volume S/R finds levels where the market truly reacted. DETECTION LOGIC: - High Volume Zones: Price levels where strong buying/selling occurred - Low Volume Zones: Areas of weak interest - potential breakout or reversal zones
SMART FILTERING: - Nearby levels are automatically merged to avoid chart clutter - Maximum levels limit keeps yo
FREE

This is a modified Fractals indicator. It works similar the original Bill Williams' indicator, and is additionally enhanced with the possibility to change the top radius, in contrast to the standard radius of 2 bar. Simply put, the indicator checks the top and if it is the minimum/maximum in this radius, such a top is marked by an arrow. Advantages Adjustable radius. Use for drawing support and resistance levels. Use for drawing trend channels. Use within the classical Bill Williams' strategy or
FREE

MACD Crossover Arrows & Alert is a MT4 (MetaTrader 4) indicator and it can be used with any forex trading systems / strategies for additional confirmation of trading entries or exits on the stocks and currencies market. This mt4 indicator provides a BUY signal if the MACD main line crosses above the MACD signal line . It also displays a Sell signal if the MACD main line crosses below the MACD signal line .
STRATEGY Traders can use the MACD signal alerts from a higher time frame
FREE

Calculating the number of lots needed so as to make sure you are risking a specific percent of account balance can be tedious. Luckily, there are websites that make this task a lot easier. This indicator takes things to the next level as it ensures you don’t have to leave the metatrader platform to perform these calculations.
The lot-size calculator is a simple calculator that works in all forex currency pairs, BTCUSD, US500, HK50 and XTIUSD. For more free stuff: http://abctrading.xyz
FREE
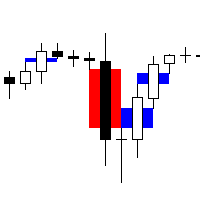
Fair Value Gap Scanner 4 is a sophisticated MetaTrader 5 indicator designed to detect fair value gaps (FVGs) in price action and display them as rectangles directly on the chart. This powerful tool empowers traders by providing visual representations of FVGs, enabling them to identify potential trading opportunities with ease and precision. With customizable parameters for color, width, and style, traders can tailor the indicator's appearance to suit their preferences and trading strategies. Key
FREE

Indicator draws Round Number lines by distance of pips. 1. You can enable / disable indicator to show / hide the lines. 2. You can set distance of pips between the lines. 3. You can edit the number of lines. 4. You can edit properties of lines by inputs (style (DASH, DOT, SOLID, ...) , width (1 for DASH, DOT, 2 is not for DASH, DOT, it only SOLID), color). When indicator is deleted from the chart, the lines will be removed.
FREE

The R Wolfe Wave indicator analyses price action and transforms the accumulated data into a powerful Wolfe Wave chart pattern technical tool.
In essence, the R Wolfe Wave chart pattern can be either bullish or bearish and might help traders to open buy and sell trades without any lagging indicators. Key Points
Identifies powerful Wolfe Wave patterns For advanced traders Works for any currency pair Well worth adding to your indicator collection This indicator can work together with any existing
FREE

The "Yesterday High Low" indicator for the MetaTrader 4 (MT4) trading platform is a powerful tool designed to help traders identify key price levels from the previous trading day. This indicator provides a visual representation of the high prices, low prices, high/low price averages, and intermediate average levels on the chart.
Primarily used by institutional and professional traders, this indicator offers an instant view of price levels that are often considered crucial in financial markets.
FREE
TCM Breakeven Calculator Pro is the ultimate utility for professional traders. It automatically calculates the Weighted Average Entry Price for all your open positions on the current symbol. It draws a clear line on the chart and displays a smart dashboard panel showing exactly where you need the price to go to exit with $0.00 loss . Key Features: Zero Lag: Built with high-speed event handling. Updates instantly on every tick and trade modification. Smart Dashboard: Displays the exact A
FREE

VWAP and Moving Average A combination of Supertrend and Moving Average to create a converging trade setup Input parameters: signal mode: set it to true if you want to plug it into STAT (Signal Tester and Trader) arrow shift: distance between fast EMA line to arrow on chart turn on moving average signal for converging setup VWAP period MA period MA averaging method MA pricing method upper level limit ( VWAP ) lower level limit ( VWAP ) You can find the best setting for 4 hour EURUSD on this v
FREE
Introducing the Draw On Chart Indicator: Unleash Your Creativity on Charts! Are you tired of struggling to annotate your trading charts, trying to make sense of your analysis or communicate your ideas effectively? Look no further! We are thrilled to present the Draw On Chart Indicator, a groundbreaking tool that allows you to effortlessly draw and annotate directly on your charts with just a few clicks or strokes of your pen. Our innovative Draw On Chart Indicator is designed to enhance your cha
FREE

This masterpiece blends cutting-edge Advance MA, HMA, and Momentum logic into stunning gold star signals, giving you the power to spot market shifts without the guesswork. Perfect for every trader—beginner or expert—this tool turns your XAUUSD charts into a goldmine of opportunity. Don’t just trade—thrive!
Why You’ll Love It
Crystal-Clear Signals : Gold star alerts highlight key market moments, guiding your decisions with ease. Smart Moving Average : Pair with the Advance MA to confidently de
FREE

Alan Hull's moving average, more sensitive to the current price activity than the normal MA. Reacts to the trend changes faster, displays the price movement more clearly. Color version of the indicator. Improvement of the original version of the indicator by Sergey <wizardserg@mail.ru>. Suitable for all timeframes.
Parameters Period - smoothing period, recommended values are from 9 to 64. The greater the period, the smoother the indicator. Method - smoothing method, suitable values are 0, 1, 2
FREE

Forex Vitals Market Hours (MT4) — Session Range Boxes + Live Session Dashboard (FREE) Forex trading is very different depending on when you trade. This indicator makes that visible by plotting the High/Low range boxes for the 4 major sessions — Sydney, Tokyo, London, New York — directly on your chart, so you can instantly see where each session’s range formed and how price behaved during overlaps. What you get Color-coded session range boxes (High/Low for each session) Optional filled boxes or c
FREE
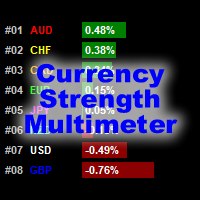
VIEW THE CURRENCY STRENGTH AND PAIR STRENGTH FOR "X" BARS IN A GIVEN TIMEFRAME. The Currency Strength Multimeter indicator shows the strength, direction and rank of each of the following currencies: AUD CAD CHF EUR GBP JPY NZD USD Furthermore, it also shows the strength, direction and rank of each of the following currency pairs: AUDCAD AUDCHF AUDJPY AUDNZD AUDUSD CADCHF CADJPY CHFJPY EURAUD EURCAD EURCHF EURGBP EURJPY EURNZD EURUSD GBPAUD GBPCAD GBPCHF GBPJPY GBPNZD GBPUSD NZDCAD NZDCHF NZDJPY
FREE

. Simple Trading System Update !!! Follow this link to see our Strategy !!! (With auto trade indicator)
Description This is an indicator Free Version and showing only history signals, Not real time. Binary Deal Trading Indicator is an indicator on MT4 for Binary Option Trading. It forecasts the overbought / oversold level, Reversal and Fractal point. This indicator will help you to decide a reversal price on any time frame (Recommend M1, M5 and M15). The expiry time is 5-15 minutes after rec
FREE

This indicator tool provides mini charts, with adjustable symbol/tf that can be dragged into place. Lightweight operation with multiple mini charts are supported.
Chart features: adjustable symbol and tf draggable multiple mini charts color styling and font sizing, foreground/background colors candle coloring candle styles; candles, bars, line, high-low channel
zoom in/out
FREE

With this easy to set up indicator you can display and set alerts for the following candlestick formations: Bull Breakout, Bear Breakout, Hammer, Pin, Bullish Engulfing, Bearish Engulfing. I'd appreciate if you would review the indicator
Input parameters: ShortArrowColor: The color of the Arrows, displaying a Bearish candle formation LongArrowColor: The color of the Arrows displaying a Bullish candle formation BullishEngulfing: Disabled/Enabled/EnabledwithAlert BearishEngulfing: Disabled/Enab
FREE

is designed to enhance the visual representation of financial charts in MetaTrader 4 by dynamically altering the colors of various chart elements, including candlesticks, bars, line charts, and volume bars. Its primary purpose is to improve trader intuition and engagement during market analysis by introducing smooth, cyclical color transitions that can highlight momentum shifts, trends, or volatility without overwhelming the display. This functionality is particularly beneficial for traders who
FREE

The Average True Range ( ATR ) is a measure of market volatility over a specified number of days. You should not expect a big continuation move when the price has reached the end of the range. The market is considered to have run out of fuel. If the price has not reached the edge, it still has a range. The indicator formula allows you to calculate High-Low levels both in aggregate and individually. You can also use these levels as support/resistance and target.
Input parameters.
Start Day - f
FREE

The " Countdown Candle Timer " indicator is a visual tool for the MetaTrader 4 platform that displays an accurate countdown of the time remaining until the next candle on the chart. It provides real-time information about the remaining duration of the current candle, allowing traders to track time precisely and optimize their trading decision-making. The indicator can be customized in terms of color, font size, and position on the chart, providing flexibility and convenience to the user. You can
FREE

Having to check constantly if your RSI has reached a specific level can be tedious and draining at times, especially if you have to monitor different asset classes at a time. The Alert RSI indicator will assist in this task, ensuring that you get the most with little effort. When the RSI values get to a specified level, the alerts will go off, on the chart, on the MT4 phone app or via email (You can receive text messages to your phone if you activate texts on your Gmail account). The indicator d
FREE
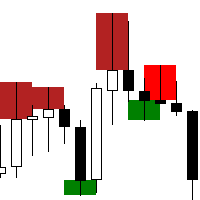
The "Rejection Block" MetaTrader 4 Indicator is a powerful tool designed to assist traders in identifying and visualizing rejection candlestick patterns, commonly referred to as rejection blocks. These patterns play a crucial role in market analysis as they often signify potential reversals or continuations in price movements. Key Features: Rejection Block Detection: The indicator meticulously scans price data to identify instances of rejection candlestick patterns. These patterns typically feat
FREE

Transform your trading approach with reliable bullish and bearish patterns This indicator evaluates volatility and price directionality simultaneously, which finds the following events. Decisive and sudden price movements Large hammers/shooting stars patterns Strong breakouts backed by most market participants Indecisive but volatile market situations It is an extremely easy to use indicator... The blue histogram represents the bullish impulse The red histogram represents the bearish impulse The
FREE

The Candle Countdown Timer for MetaTrader 4 (also available for MT5) is a vital indicator designed to help you manage your trading time effectively. It keeps you updated about market open and close times by displaying the remaining time before the current candle closes and a new one forms. This powerful tool enables you to make well-informed trading decisions. Key Features: Asia Range: Comes with an option to extend the range. Broker Time, New York, London Time: Displays the current broker time
FREE
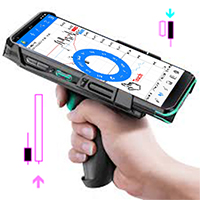
This is an indicator that helps you to scan the whole timeframe then informs you about the last candle position Engulfing Candlestick pattern was formed. The indicator also send alert to your mobile when a new engulfing candle is formed.
For the visual;
1. Green up arrow indicates a bullish engulfing candlestick pattern
2. Red down arrow indicates a bearish engulfing candlestick pattern
FREE
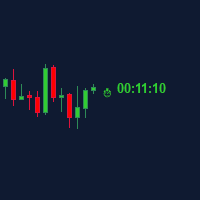
Candle Time (MT4) The Candle Time indicator shows the remaining time for the current candle on the active chart timeframe. It adapts automatically to the chart period and updates on every tick. This is a charting utility; it does not provide trading signals and does not guarantee any profit. Main functions Display the time remaining for the current candle on any timeframe (M1 to MN). Color-coded state: green when price is above the open (up), gray when unchanged, and red when below the open (do
FREE

A simple but effective helper that will allow you to track both global and local market trends. The indicator combines the work of two oscillators: Stochastic and RSI. Both indicators can be set to any timeframe.
Advantages of Use Multitimeframe - you can adjust both indicators to the desired timeframes. To obtain the entry points, you can use the Elder's triple screen system. Highly customizable - you can configure not only the parameters of the indicators, but also their appearance (color and
FREE

Stop Guessing, Start Winning: Meet Swing Hunter Pro! Are you tired of confusing charts and late entries? The Swing Hunter Pro indicator is your ultimate weapon for capturing profitable market swings with unmatched clarity and confidence. This powerful tool combines the best of Hull Moving Averages (HMA) and Exponential Moving Averages (EMA) with a strict trend filter, giving you strong, high-probability signals right on your chart. Available in EA format. Link download https://www.mql5.com/en
FREE

Price Action Indicator gives you reverse or even continous trend signals depending on your timeframe and Strategy used. !!!This is not a holy grail indicator and it will not give 100% winning rate!!! As you can see, it is not giving a lot of signals because of the price movements in side way (flat) trend. You can use it on every major currency pairs and even on indices. Please be aware of using this indicator with other strategies and indicators. Use MM and Risk Management properly. Sometimes
FREE

Market Insider is an excellent indicator for scalping the trend and also trading market breakouts and reversals. It is based on a ATR measured volatility channel and the CCI indicator. The green trend line and green bars indicates an uptrend and the red trend line and red bars indicates a downtrend. An intensive price breakout of some of the trend lines indicates a market breakout and a potential new opposite trend. In choppy-range behaving market and in low liquidity conditions the breakout sig
FREE

MT5 version Overview
The Lowess Channel indicator is a smoothed trend-following tool designed to help traders identify the direction of the trend , detect flat or ranging markets , and spot breakouts from consolidation zones. It creates a central smoothed line with upper and lower channel boundaries, adapting to market noise while maintaining clarity. How It Works The indicator builds a channel around a smoothed price line. The central line reflects the current trend. The upper and lower bound
FREE
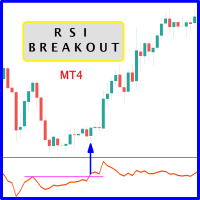
When prices breakout resistance levels are combined with Relative Strength Index "RSI" oscillator breaks out its historical resistance levels then probability emerges to record farther prices. It's strongly encouraged to confirm price breakout with oscillator breakout since they have comparable effects to price breaking support and resistance levels; surely, short trades will have the same perception. Concept is based on find swing levels which based on number of bars by each side to confi
FREE

Dominate the Market with CCI Crossover Master! Stop guessing and start trading with confidence ! The CCI Crossover Master indicator is your secret weapon for capturing high-probability moves based on proven momentum and trend analysis. It simplifies the complex " CCI Crossover Master " strategy, giving you crystal-clear Buy and Sell signals directly on your chart. Key Advantages That Drive Your Success: Precision Entry Signals: Never miss a high-potential trade again. The indicator generates sh
FREE

High-Precision Volatility Notifier V1.10 Developed by: Grazia-system-com Title: Stop Chasing Volatility: Get Notified Only When the Real Breakout Starts. The professional, noise-filtered tool that transforms your MT4/MT5 into a smart, proactive monitoring system. Never miss an institutional-level move again. Why This Detector Is Different (Dual-Layered, Noise-Filtered Intelligence) Most volatility tools use fixed thresholds that fail in dynamic markets. Our Notifier eliminates false signals
FREE
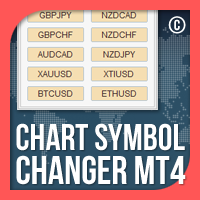
Chart Symbol Changer for MT4 is an indicator/utility that offers you the option to change the current chart symbol that is attached onto with a click of a symbol button on its panel. Chart Symbol Changer for MT4 gives you the option to configure the 32 symbol buttons to your personal preference, by adding the pairs you want to keep any eye on and trade the most. This way you will never miss an opportunity, because you can have a faster view of the market on your chart with just a few clicks.
FREE

The statistical indicator for the metatrader 5 TradingStatisticPro collects statistical data on your trade, which makes it easier to assess the effectiveness of trading, the profit received and the risks. The indicator is compactly placed in the corner of the main chart of the terminal and displays the following information: 1. The profit earned. 2. Maximum drawdown. 3. The recovery factor. 4. Profit factor. 5. The ratio of profitable and unprofitable transactions (winrate). 6. Average profit a
FREE

Price Channels are also known as Donchian Channels being named after Richard Donchian. They use the highest and lowest price of a set number of periods to create an upper and lower channel or envelope around the price. The upper channel shows the high of the number of periods chosen. The lower channel shows the low of the number of periods chosen. For example, the screenshot shows the Price Channels using 320 periods. The upper channel in the screenshot shows the highest high of the previous 3
FREE

Early Bird Breakout: Capture the Power of the London Open Are you tired of trading in choppy, unpredictable markets? The Early Bird Breakout is your essential tool for exploiting one of the most reliable and explosive patterns in Forex: the Asia Session Breakout . This smart indicator automatically identifies the crucial price levels set during the quiet Asian hours and alerts you the moment the major volume of the London/European session ignites a trend! Key Features and Market Edge Precision
FREE

RQL Trend Board – Description RQL Trend Board is a simple but powerful multi-timeframe trend dashboard.
It shows the current market bias across several timeframes at the same time, using an internal trend-classification method. Each timeframe is displayed as a colored box: Green – bullish bias → look for long setups
Yellow – ranging / unclear → no trade zone
Red – bearish bias → look for short setups The indicator gives a clear overall picture of where the
FREE

GTAS S-Trend is a momentum indicator that helps to determine trends using combination of MACD, RSI and moving averages. This indicator was created by Bernard Prats Desclaux, proprietary trader and ex-hedge fund manager, founder of E-Winvest.
Description The indicator oscillates between -65 and +65 with a neutral zone between -25 and +25 around a 0 equilibrium line. S-Trend between -25 and +25 indicates congestion zones with a bullish bias between 0 and +25, and a bearish bias between 0 and -25.
FREE

Cyber Engulf Indicator - Professional Trading System for MetaTrader 4 What is the Indicator?
Cyber Engulf is an advanced technical analysis indicator that detects engulfing patterns filtered by moving average. It identifies trend reversal points, helping you spot changes in market structure early. What Does It Do? Automatically identifies engulfing candlestick patterns Filters out false signals using moving average Displays buy and sell signals with blue/up and red/down arrows Works across mult
FREE

CPR Pivot Lines It Will Draw Pivot Point R1,R2,R3 S1,S2,S3 Tc Bc Best Part Is That You Can Even Add Values Of High,Low,Close Manually Also To Get Your All Levels On Chart. So If Your Broker Data Of High ,Low ,Close Is Incorrect Then You Don’t Have To Depend On Them Anymore. You Can Even Modify All Lines Style. It Will Show Line In Floating Style And Not Continues Mess.
FREE

This indicator signals about crossing of the main and the signal lines of stochastic (lower stochastic) in the trend direction which is determined by two stochastics of higher time frames (higher stochastics). It is not a secret that stochastic generates accurate signals in a flat market and a lot of false signals in a protracted trend. A combination of two stochastics of higher time frames performs a good filtration of false signals and shows the main tendency. The indicator is recommended for
FREE

You can see resistance and support levels with the Gann Square 9 calculator. You can adjust the sensitivity setting to suit your needs and the symbol. If you leave the sensitivity at 0, it will work with the default values. I recommend adjusting it to suit your needs and the symbol. Good luck.
I plan to improve the Gann Square 9 indicator and create signals in the next version. If you have any requests, please leave them in the comments. Thank you.
FREE

Key Levels + Zones
Indicator cleanly displays even numbered price levels: “00s” and “50s” . Additionally, you can display “Mid-Lines” which are preset distance levels on both sides of the even numbered price levels (set to 12.5 pips by default). This 25-pip zone that straddles each even numbered price relates to where many traders place their stops and therefore can be a risk “Zone” to steer clear of when placing your stops. The zone also acts as support and resistance. Indicator p rovide
FREE

This indicator mostly inspired from BW-ZoneTrade custom indicator from MT5. How To Use:
BUY when both dots colored Green. SELL when both dots colored Red. In addition to original one, MACD-OsMA-generated signal also can be drawn. Input Description:
MA_period_short: Faster EMA period for MACD. Applied when drawMACD is true. MA_period_long: Slower EMA period for MACD. Applied when drawMACD is true. MACDperiod: MA period for MACD. Applied when drawMACD is true. drawMACD: When true, draw an additi
FREE

This program will make analysing multiple timeframes more convenient.
It will help to sync all charts in a different Timeframe sync charts to show same symbol, same specific time period and sync drawing objects Show on all charts at the same time
How to use it >> https://youtu.be/NEHUW7v1h1c In this edition there are only 6 object types that can be synced all chart. Drawing Object Type Support : Vertical/Horizontal Line, Trendline, Rectangle, Arrow, Fibo-Retracement
Additional Feature: T
FREE

RCI (Rank Correlation Index) Indicator Overview The RCI (Rank Correlation Index) indicator is an oscillator-based tool that analyzes market trends and possible turning points by measuring the rank correlation of price data.
It quantifies the correlation between price ranking and time ranking over a specified period, displaying values from -100 to +100 as a simple line.
RCI is widely used for gauging market momentum, timing entries and exits, and can support both trend-following and counter-tren
FREE
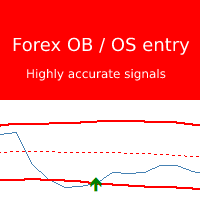
Forex overbought / oversold entry indicator is based on a very powerfull strategy which give very accurate entry arrows. The indicator place arrows on "new candle" and does NOT repaint! This indicator is a MUST HAVE if you trade with a reversal strategy. This indicator can easely be combined with your other trading indicators to confirm reversals or bottoms. If you have ever had any trouble finding correct entries this indicator is the best available for you! Standard overbought and oversold str
FREE

The indicator is based on the classic CCI indicator. I recommend watching my advisor - Night Zen EA Doesn't redraw its signals. There are alerts for the incoming signal. It contains 2 strategies: Entry of the CCI line into the overbought zone (for buy trades ) / into the oversold zone (for sell trades ) Exit of the CCI line from the overbought area (for sell trades) / from the oversold area (for buy trades)
Settings: Name Setting Description Period Period of the classic CCI indicator Price Ch
FREE

This indicator is suitable for trading Forex and Binary Options, depending on its settings. The indicator is designed for trend trading. A buy signal: An up arrow appears on the chart. A sell signal: A down arrow appears on the chart.
Input parameters === Setup CCI === Period CCI 1 - Period of the CCI Period CCI 2 - Period of the CCI Level BUY - Level of the CCI for buying Level SELL - Level of the CCI for selling === Setup RSI === Level SELL - Level of the RSI for selling Period SELL - Period
FREE
The MetaTrader Market is a simple and convenient site where developers can sell their trading applications.
We will help you post your product and explain you how to prepare your product description for the Market. All applications on the Market are encryption-protected and can only be run on a buyer's computer. Illegal copying is impossible.
You are missing trading opportunities:
- Free trading apps
- Over 8,000 signals for copying
- Economic news for exploring financial markets
Registration
Log in
If you do not have an account, please register
Allow the use of cookies to log in to the MQL5.com website.
Please enable the necessary setting in your browser, otherwise you will not be able to log in.