Watch the Market tutorial videos on YouTube
How to buy а trading robot or an indicator
Run your EA on
virtual hosting
virtual hosting
Test аn indicator/trading robot before buying
Want to earn in the Market?
How to present a product for a sell-through
Free Technical Indicators for MetaTrader 4 - 7

Intraday Fair Value Gap (FVG) Sessions Indicator for MT4 The Intraday FVG Sessions Indicator is a specialized tool designed for MetaTrader 4 (MT4) that integrates session-based price action with Fair Value Gaps (FVGs) . It automatically highlights key highs and lows during New York, London, and Tokyo trading sessions , using horizontal markers to define critical price zones. Additionally, the indicator detects the first Fair Value Gap (FVG) at the session's opening and closing times. Bullish FVG
FREE

Peak Trough Analysis is the great tool to detect peaks and troughs in your chart. Peak Trough Analysis tool can use three different peaks and troughs detection algorithm. The three algorithm include the orignal Fractals Indicator by Bill Williams, the Modified Fractals indicator and ZigZag indicator. You can use this peak and trough analysis tool to detect the price pattern made up from Equilibrium Fractal-Wave process. For further usage, there are good guide line on how to use this peak trough
FREE
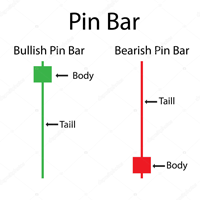
Pin bar pattern is characterized by a long upper or lower wick with a small body relative to the size of the wick with little to no lower or upper shadows. Pin bars are not to be traded in isolation , but need to be considered within the larger context of the chart analysis. A pin bar entry signal, in a trending market, can offer a very high-probability entry and a good risk to reward scenario.
Inputs MinimumTailPips- Minimum size of Tail in pips; TailBodyCandle- means how many times Tail grea
FREE
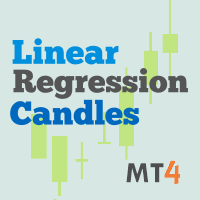
This indicator is the mql version of the Linear Regression Candles indicator. There are many linear regression indicators out there, most of them draw lines or channels, but this one actually draws a chart.This script includes features such as linear regression for open, high, low, and close prices, signal smoothing with simple or exponential moving averages. I welcome your suggestion for improving the indicator.
To increase the loading speed of any indicator:
Reduce the max bars in c
FREE
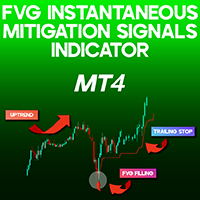
FVG Rapid Mitigation Signals Indicator MT4 The FVG Rapid Mitigation Signals indicator is designed to detect fair value gaps (FVGs) that are swiftly filled, marking them with arrows for easy identification. Once these gaps are recognized, the indicator on MetaTrader 4 automatically generates a Trailing Stop , aligning with the trend direction for optimal trade management. «Indicator Installation & User Guide»
MT4 Indicator Installation | FVG Instantaneous Mitigation Signals Indicator MT5 | A
FREE
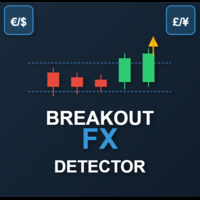
This is a powerful, session-aware breakout indicator designed for serious traders who thrive on volatility and structure. Engineered for precision, it identifies high-probability breakout zones during the London and New York trading sessions—where the market moves with intent. Key Features: Session Range Detection
Automatically detects and highlights the key price range of London and New York sessions. Breakout Confirmation
Identifies breakout candles after the session range, with cl
FREE
Introduction to the Candle Time Indicator The Candle Time Indicator for MetaTrader 4 (MT4), helps users know how much time on a candlestick is remaining. This is a simple but incredibly powerful and useful tool. To download the Dagangduit CandleTime.mq4 indicator, check the bottom of this post. It’s one of the best forex time indicators in its category. The function of the indicator will not change, even if you change the name of the indicator. The candlestick countdown timer will tell you how m
FREE

Informative & optimized Zigzag, Accumulated volume, Price change A rewrite of the traditional zigzag tool with new additions. Features:- Optimized code Displays accumulated volume between peaks Displays price change between peaks Usage:- Identify trend swings Identify high volume swings Compare price changes between swings Drawing Fibonacci tool on strong price change or high volume swings
FREE
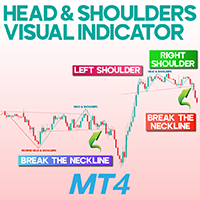
Head and Shoulders Visual Indicator for MetaTrader 4 The Head and Shoulders Visual Indicator for MetaTrader 4 is a powerful technical analysis tool designed to detect potential trend reversal patterns in the market. Built on classic chart pattern logic, this MT4 indicator identifies two key formations: the Head and Shoulders Top (Bearish) and the Inverse Head and Shoulders (Bullish). These patterns are widely recognized for signaling the end of a trend and the beginning of a new one. «Indicator
FREE

The channel indicator is trending and does not repaint. It creates an ATR price channel with the opposite volatility border. The indicator has proven itself well in the strategy of trading on impulse levels and fake breakout. The entry point should be looked for on the correction to the indicator line, and the take profit should be set on the opposite border.
Blog-Link - Retest and Fake Breakout with UPD1 .
Input parameters.
Bars Count - history to display. ATR - average true range period.
FREE

The SuperTrend indicator is a trend-following technical tool that visually highlights trend reversals in the market. The color and position of its lines change automatically based on price movements, supporting both entry and exit decisions. With a simple design, it can be used in a wide range of trading styles, including discretionary and automated trading. Main Features Clear display of trend reversals
During uptrends, the line is drawn below the candlesticks; during downtrends, it is drawn a
FREE

This is the free version of the Supply&Demand + Trendline + Trend tool. This version works only with EURCHF! You find the full version here: https://www.mql5.com/en/market/product/67274
PAAIOS stands for Price Action All In One Solution. And that is the purpose of the Indicator. It should give you a tool to improve your trading decisively because you get the crucial information at a glance. The indicator simplifies the search for strong signals. It shows trend lines, demand and su
FREE
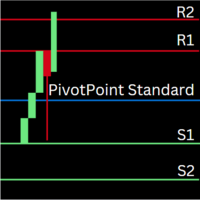
Pivot Point Indicator for MetaTrader 4 (MT4) Overview The Pivot Point Indicator calculates daily, weekly, and monthly pivot points and plots key support and resistance levels on your charts. This indicator helps traders identify potential reversal points and key areas of interest for price action, making it a valuable tool for both short-term and long-term trading strategies. Key Features Daily, Weekly, and Monthly Pivot Points : Easily switch between daily, weekly, and monthly pivot points by a
FREE

An imbalance bar or candle, also called a fair value gap (FVG) or inefficiency, shows strong buying or selling in the market or weak buying or selling that causes prices to move quickly with high momentum. This is why it's an important part of price action analysis. Our indicator offers three main benefits: Clear Design: The imbalance bar is built into the candle with a simple, clean look that makes it easy for traders to spot while keeping the chart tidy. Easy to Use: A hotkey lets traders quic
FREE

The indicator, which displays two different pairs on one chart, is designed to simplify the displayed information, Able to work with almost all instruments available in the terminal (not only currency pairs, but also metals, raw materials). Feature of using the visual correlation method for any currency pairs
subsymbol. The currency pair is displayed on the screen with colored candles. This is the same correlated pair. mirroring. auxiliary currency. The indicator reflects two types of correl
FREE

The Supreme HmaSignal indicator is an indicator for trend trading , its main character is the hull moving average colored line , and secondary is buy and sell arrows , arrows are fair but the main focus is on the colored hma , this indicator does not repaint or back paint or delay its signals. if you like this indicator please check my Supreme Trendhisto: here , and my Supreme Diamond indicator : here
Parameters: HMA Period HMA Smoothing HMA Price (close/open) Signal Period (Arrows)
FREE

Description:
This indicator (with its algorithm) marks relative highs and lows, which have an array of useful applications.
This indicator will never repaint.
Features:
Marks relative highs and lows Use this to determine points of trend continuation i.e. where the trend may pull back before continuing higher or lower, past this point Or use this to determine potential points of reversal, particularly in ranging markets, or with other price action These highs and lows can sometimes be us
FREE
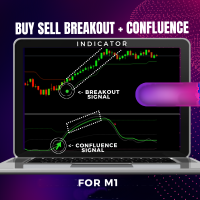
Please CONTACT ME after purchase to get my trading tips. 100% NON REPAINT INDICATOR ( 99% Accurate Signals! )
BUY SELL Breakout Indicator + Confluence
What is the breakout strategy?
In trading terms, a breakout means that the price of a financial asset, such as a share, moves outside of its determined trading range, which is often indicated by its support and resistance levels. The breakout strategy focuses on identifying market trends as soon as they break.
The idea behind trading breako
FREE
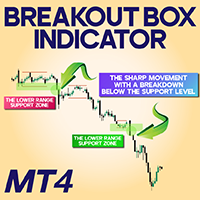
Breakout Box Indicator for MetaTrader 4 The Breakout Box Indicator for MetaTrader 4 is a technical analysis tool that helps define key market zones by outlining price boundaries. It plots horizontal levels directly on the chart to signify potential breakout areas where support and resistance are expected to form. «Indicator Installation & User Guide»
MT4 Indicator Installation | Breakout Box Indicator for MT5 | ALL Products By TradingFinderLab | Best MT4 Indicator: Refined Order Block Ind
FREE
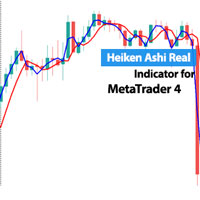
Heiken Ashi Real Indicator MetaTrader 4 The Heiken Ashi Real Indicator is a refined and modernized version of the traditional Heiken Ashi indicator, specifically developed for the MetaTrader 4 platform. It provides traders with enhanced accuracy in identifying market trends. By utilizing the crossover of its two main lines, this tool generates buy and sell signals, helping traders make more informed decisions. «Indicator Installation & User Guide»
MT4 Indicator Installation | Heiken Ashi Rea
FREE

The Heikin Ashi indicator is our version of the Heikin Ashi chart. Unlike competitor products, this indicator offers extensive options for calculating Heikin Ashi candles. In addition, it can be displayed as a classic or smoothed version.
The indicator can calculate Heikin Ashi with moving average by four methods: SMA - Simple Moving Average SMMA - Smoothed Moving Average EMA - Exponential Moving Average LWMA - Linear Weighted Moving Average
Main features The indicator shows Heikin As
FREE

The MACD 2 Line Indicator is a powerful, upgraded version of the classic Moving Average Convergence Divergence (MACD) indicator.
This tool is the embodiment of versatility and functionality, capable of delivering comprehensive market insights to both beginner and advanced traders. The MACD 2 Line Indicator for MQL4 offers a dynamic perspective of market momentum and direction, through clear, visually compelling charts and real-time analysis. Metatrader5 Version | How-to Install Product | How-to
FREE

This indicator effectively separates the tick volume in the forex market into bullish and bearish categories. Additionally, it provides the functionality to calculate and display the sum of bullish and bearish tick volumes for any selected period of your choice. You can easily adjust the period by moving the two blue lines on the chart, allowing for customizable and precise volume analysis tailored to your trading needs. If you find it usefull your reviews will be appreciated! Happy trading!
FREE

DONCHIAN CHANNEL DC It is a trend indicator developed by “Richard Donchian”, consisting of 3 layers, the upper channel, the lower channel and the middle channel. It is created on the Donchian Channel by plotting the highest and lowest prices reached in the past period on the price chart. It is also used to measure the volatility of the market, as it is an expanding/contracting channel according to the increase/decrease of price volatility. Method 0; Donchian channel indicator drawing. BUY/SELL S
FREE

False Breakout Stochastic to be used with our Elliott Wave Indicator as part of the overall strategy on trading the 5th wave.
As we cannot upload multiple files, we have listed this separately. False Breakout Stochastic is best used as a confirmation tool rather than the sole signal indicator The Elliott Wave Indicator Suite is designed around a simple but effective Swing Trading Strategy. The Indicator Suite is great for Stocks, Futures and Forex trading on multiple timeframes You can find the
FREE
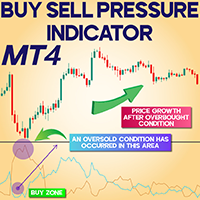
Buy Sell Pressure Indicator for MetaTrader 4 The Buy Sell Pressure Indicator for MetaTrader 4 is a functional and user-friendly analytical tool used to monitor momentum in financial markets. Integrated into the MT4 platform, it helps traders assess the dominance of buyers or sellers at any given moment. This indicator evaluates live price movements and reveals Overbought and Oversold levels via a separate oscillator panel. Due to its straightforward design and easy-to-follow trading approach, it
FREE
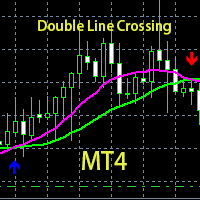
his is a custom indicator based on double-average crossing and arrow marking.
Make multiple lists when blue arrows appear up.
Make a blank list when the red arrow appears down.
When the pink line crosses the green line upwards, the pink line is above, the green line is below, the golden fork appears, and the blue arrow appears.
When the pink line crosses down through the green line, the pink line is below, the green line is above, a dead fork appears, and a red arrow appears.
This is a good
FREE

A forex pivot point strategy could very well be a trader’s best friend as far as identifying levels to develop a bias, place stops and identify potential profit targets for a trade. Pivot points have been a go-to for traders for decades. The basis of pivot points is such that price will often move relative to a previous limit, and unless an outside force causes the price to do so, price should stop near a prior extreme. Pivot point trading strategies vary which makes it a versatile tool for
FREE

Calculating the number of lots needed so as to make sure you are risking a specific percent of account balance can be tedious. Luckily, there are websites that make this task a lot easier. This indicator takes things to the next level as it ensures you don’t have to leave the metatrader platform to perform these calculations.
The lot-size calculator is a simple calculator that works in all forex currency pairs, BTCUSD, US500, HK50 and XTIUSD. For more free stuff: http://abctrading.xyz
FREE
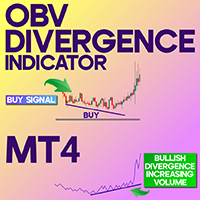
OBV Divergence Indicator for MetaTrader4 The OBV Divergence Indicator for MetaTrader4 is a smart analytical tool designed to automatically highlight divergences between On Balance Volume (OBV) and price movement. This indicator is widely used in momentum-based strategies and eliminates the need for manual detection of divergence patterns. It provides clear visual cues by marking potential buy zones with blue signals and potential sell zones with pink markers. «Indicator Installation & User Guide
FREE

Double top and bottom indicator is a pattern scanning indicator which scans the tops and bottoms using zig zag pattern. When it find price bouncing back from the same point twice after a long trend then it generate arrow signals whenever the last resistance points is broken for double bottom and last support price broken for double top. Unlike other top bottom scanner it does not give only 1 signal. it alerts user when ever the last support /resistance is broker from double top/bottom pattern un
FREE

The Supertrend Indicator is a popular technical analysis tool designed to assist traders in identifying market trends. The indicator combines the average true range (ATR) with a multiplier to calculate its value. This value is then added to or subtracted from the asset’s closing price to plot the supertrend line. The Supertrend Indicator can help identify trends, manage risk, and confirm market tendencies. The indicator is limited by its lagging nature, is not very flexible, and can send up fal
FREE
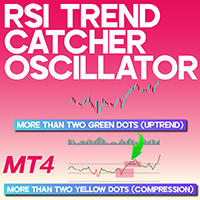
RSI Trend Catcher Oscillator for MetaTrader 4 The RSI Trend Catcher Oscillator for MetaTrader 4 is a customized MT4 indicator that works based on principles similar to the classic RSI. It detects overbought and oversold conditions and provides optimal entry and exit points. The RSI Trend Catcher uses three distinct colors to visualize trends: green for bullish movements, red for bearish trends, and yellow for neutral phases. Its design integrates Bollinger Bands to enhance signal generation accu
FREE

This program will make analysing multiple timeframes more convenient.
It will help to sync all charts in a different Timeframe sync charts to show same symbol, same specific time period and sync drawing objects Show on all charts at the same time
How to use it >> https://youtu.be/NEHUW7v1h1c In this edition there are only 6 object types that can be synced all chart. Drawing Object Type Support : Vertical/Horizontal Line, Trendline, Rectangle, Arrow, Fibo-Retracement
Additional Feature: T
FREE
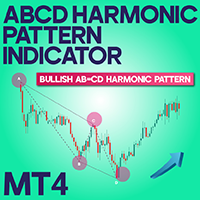
AB=CD Harmonic Pattern Indicator in MetaTrader 4 The AB=CD harmonic indicator in the MetaTrader 4 platform is developed as a tool for identifying harmonic patterns.This indicator automatically draws the AB=CD pattern on the chart by marking four key points: A, B, C, and D, and highlights the price reversal zone (PRZ).It helps traders identify optimal entry and exit points at crucial market turning points through technical analysis. «Indicator Installation & User Guide»
MT4 Indicator Installatio
FREE

Overview:
The Coloured Parabolic SAR Indicator is a visually enhanced trading tool designed to make trend-following and trade identification easier. This customizable indicator provides clear visual cues with color-coded signals for bullish (buy) and bearish (sell) trends directly on your MT4 chart. Key Features: Color-Coded Signals : Lime green "o" symbol for Buy signals. Red "o" symbol for Sell signals. Customizable Inputs : Adjustable Step and Maximum parameters to fine-tune the Parabolic SA
FREE

Please check the " What's new " tab regularly for a complete and up-to-date list of all improvements + parameters. FREE indicator for my trading utility Take a Break . This indicator allows you to manage multiple other EAs with just one Take a Break EA instance. Simply specify the corresponding Chart Group in the indicator(s) and Take a Break EA settings and you are good to go.
Setup examples (Indicator + EA)
As a prerequisite, add the URL https://trading.custom-solutions.it to the list of al
FREE

Necessary for traders: tools and indicators Waves automatically calculate indicators, channel trend trading Perfect trend-wave automatic calculation channel calculation , MT4 Perfect trend-wave automatic calculation channel calculation , MT5 Local Trading copying Easy And Fast Copy , MT4 Easy And Fast Copy , MT5 Local Trading copying For DEMO Easy And Fast Copy , MT4 DEMO Easy And Fast Copy , MT5 DEMO "Cooperative QQ:556024" "Cooperation wechat:556024" "Cooperative email:556024@qq.com" Strong
FREE
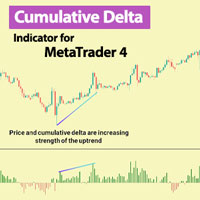
Cumulative Delta Indicator for MetaTrader 4 The Cumulative Delta Indicator evaluates buy and sell orders over a defined period and visualizes the cumulative difference using green and red histogram bars on the MetaTrader 4 platform.This oscillator monitors shifts in buying and selling volumes over time, making it a crucial instrument for analyzing market liquidity and detecting potential price reversals. «Indicator Installation & User Guide»
MT4 Indicator Installation | Cumulative Delta Indic
FREE

O Touch VWAP é um indicador que permite calcular uma Média Ponderada por Volume (VWAP) apenas apertando a tecla 'w' no seu teclado e após clicando no candle do qual deseja realizar o calculo, clicando abaixo do candle é calculada a VWAP baseado na minima dos preços com o volume, clicando sobre o corpo do candle é calculado uma VWAP sobre o preço medio com o volume e clicando acima do candle é calculado uma VWAP baseado na máxima dos preços com o volume, voce tambem tem a opção de remover a VWAP
FREE

Pattern Detector can detect the most common 1, 2 and 3 candlestick patterns and send notifications when detected. Demo version working on AUDNZD can be found https://www.mql5.com/en/market/product/29189
How does it work Add the indicator to the chart you want to analyze and select which patterns to detect, the indicator will draw the detected patterns. You can also be notified via alert, app and email when a new pattern is detected.
Parameters Indicator Name - Used to draw the graphical object
FREE

Special offer! https://www.mql5.com/ru/users/bossik2810
Trend Filter Pro
Trend filter indicator.
Very good filter for your trading system, I recommend to use it together with - System Trend Pro or Quantum Entry PRO
The indicator no repaint!!!
Settings:
Change the Period parameter for better filtering ( default is 90)
Any questions? Need help?, I am always happy to help, write me in private messages or
In Telegram: https://t.me/Trader35_Admin
FREE

Time your Entry and Exits with Average True Range (ATR) Trailing Stops ATR Trailing Stops are primarily used to protect capital and lock in profits on individual trades but they can also be used, in conjunction with a trend filter, to signal entries. The indicator will help make your calculation of stop loss easier as it will be visually aiding you in choosing where to put your stoploss level on the chart by calculating the current value of ATR indicator. For those who are unfamiliar with ATR, i
FREE
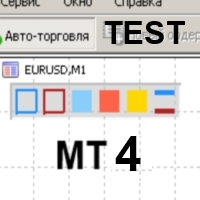
Color Levels - удобный инструмент для тех, кто использует технический анализ с использованием таких инструментов, как Трендовая линия и Прямоугольник. Имеется возможность настройки двух пустых прямоугольников, трех закрашенных и двух трендовых линий. Настройки индикатора крайне просты и делятся на пронумерованные блоки: С цифрами 1 и 2 вначале - настройки пустых прямоугольников (рамок); С цифрами 3, 4 и 5 - настройки закрашенных прямоугольников; С цифрами 6 и 7 - настройки трендовых линий. Объе
FREE

CandleStick Countdown – Candle Remaining Time Indicator CandleStick Countdown is a simple and practical MT4 indicator that displays a real-time countdown of how many minutes and seconds remain until the current candle closes. It helps improve trading timing accuracy and is widely used by traders. Main Features Displays the remaining time of the current candle in a "minutes:seconds" format Shown as text on the chart for high visibility Automatically adjusts position near the current price for eas
FREE

M1Arrows is a MT4 trend arrows Indicator
* Smart Scalper Setup (M1) :: Signal 5 Main 20 + Signal 20 Main 80 + Fibonacci ZigArcs 20
(Screenshot1) Add the indicator with first setting,
then add it again to the same graph with other settings.
You can add as many as you want, but 2 M1Arrows in just one graph is enought
Never open orders againt the slow setting trend
Do not open more than 3 orders per slow setting trend
It will work better in Europe/USA markets, * M15 Day Trade Setup: Signal 20 ma
FREE

AWESOME MACD INDICATOR
Awesome MACD Indicator is a powerful trading tool that combines the strengths of Moving Average (MA) and Moving Average Convergence Divergence (MACD) to provide accurate and reliable trading signals. Designed for forex and stock traders, this indicator simplifies the identification of trading opportunities by detecting significant crosses in price movements. Key Features:
MA and MACD Combination: Awesome MACD leverages the power of Moving Averages (MA) to identify short-te
FREE
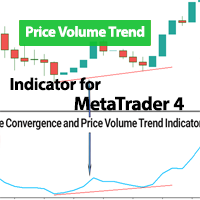
Price Volume Trend Indicator MetaTrader 4 The Price Volume Trend (PVT) Indicator is a technical analysis tool that integrates price movements with trading volume to assess the strength and reliability of market trends. By factoring in the percentage change in the current price relative to the previous close, and multiplying that by the trading volume, this indicator reflects whether volume is supporting the prevailing price direction. When prices rise alongside increasing volume, the PVT line c
FREE
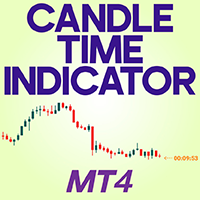
Candle Time Indicator for MetaTrader 4 The Candle Time Indicator for MetaTrader 4 is a practical tool that reveals how much time is left before the current candle ends and the next one begins. It shows the countdown in hours, minutes, and seconds directly beside the latest candle on the chart. «Indicator Installation & User Guide»
MT4 Indicator Installation | Candle Time Indicator MT5 | ALL Products By TradingFinderLab | Best MT4 Indicator: Refined Order Block Indicator for MT4 | Bes
FREE

Central Pivot Range levels are formed around a central pivot point. These levels in relation to the central pivot can be used to determine numerous market behaviours and possible outcomes. The distance away from the central pivot, and the price that new levels form in relation to previous day levels , can be used to determine following days trending direction and strength. Central Pivot Ranges can act as support and resistance, offer a guide where to put a stop loss and also give signals of pric
FREE
The indicator highlights the value in "over Sold" and "over Bought" zones. in addition, arrow indicates the return of the value from the extreme zone. Indicator can be easily customized by the user including change of colors, with, levels and arrows. Combination with other market signals and analysis is necessary and provides more stable results. Alert is also available for user.
FREE

Smart Liquidity Zones (SLZ) — Your All‑in‑One SMC/ICT Radar for MT4
Why SLZ? Tired of squinting at charts trying to spot liquidity grabs, break‑of‑structure candles and Fair Value Gaps before the smart‑money sharks do? SLZ turns your chart into a tactical map —drawing every high‑probability zone and screaming (politely) when price dives in. Core Edge Powered by a rule‑set distilled from Smart Money Concepts (SMC) and ICT mentorship material, SLZ auto‑marks: Component What it shows Why it
FREE
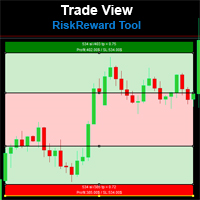
Risk Reward Tool , It is easy to use. With this tool you can see the rates of profit loss profit. You can see your strategy and earnings reward status of your goals.Double calculation can be done with single tool. Move with drag and drop. You can adjust the lot amount for calculations. The calculation results are shown in the comment section. There may sometimes be graphical errors during movements. Calculations works at all currency. Calculations All CFD works. Updates and improvements will co
FREE

Enhance your trading precision with the WH Trading Sessions MT4 indicator for MetaTrader 4! This powerful tool helps you visualize and manage key market sessions effortlessly. Based on : WH SMC Indicator MT4
MT5 Version : WH Trading Sessions MT5 Key Features: Interactive GUI Panel – Easily select and toggle between Asia, London, and New York trading sessions.
Customizable Alerts & Settings – Tailor the indicator to your strategy with an intuitive Options Tab .
Fast & Respons
FREE

"Five Minute Drives" indicator that is designed to be used in the 5 minute timeframe. One of its most important advantages is that it shows the general trend in the upper time frames when looking at the 5-minute timeframe. Therefore, when opening positions in the 5 minute timeframe, when it is in line with the trends in the upper timeframes, you are less likely to be upside down. If you can evaluate breakout/breakdown opportunities between the curves on the graphic screen with your geometric per
FREE

Welcome to the Advanced Gartley Pattern recognition indicator This indicator detects gartley pattern based on HH and LL of the price structure and Fibonacci Levels , and when certain fib levels are met the indicator will show the pattern on the chart. MT5 Version : WH Advanced Gartley Pattern MT5
**This Indicator is a part of combo WH Ultimate Harmonic Patterns MT4 , which include all the pattern recognition.** Features : Advanced Algorithm for detecting the Gartley pattern with high Ac
FREE

Dies ist ein durchschnittlicher Index basierend auf einem benutzerdefinierten Algorithmus. Je nach Band können Uplink und Downlink farblich identifiziert werden. Das Pop-up-Feld kann ein- oder ausgeschaltet werden, um anzuzeigen, dass der aktuelle Kauf- oder Verkaufsauftrag platziert werden soll.
Beschreibung der Parameterliste:
Extern int price = 0; / /anfänglicher Durchschnittspreis des Indikators
Externe int length = 20; / / der Indikator berechnet den Durchschnittszeitraum, der dem Du
FREE

See RSI values turned into colored candles
This indicator provides both colored candles and a colored moving average. 6 drawaing styles are provided to allow customization of the color coding.
Applying coding to the chart may help in conceptualizing price trend and impulse movements defined through RSI values.
Features - optional colored candles - optional colored ma - 6 draw styles; RSI slope RSI above/below overbought/oversold levels RSI above/below level 50 RSI above/below it's moving average
FREE

Description: For a comprehensive understanding of our indicators, we invite you to explore the entire Q&A section within this MQL5 blog post here . The Moving Average 5EMA Indicator is a valuable tool designed to provide comprehensive insights into market trends and potential entry and exit points. It incorporates five exponential moving average (EMA) lines, each representing the average price over different periods. This powerful combination offers a deeper understanding of price movements a
FREE

Now there is no need to check volatility on third-party websites in order to determine the average movement rage of a certain currency pair. The Truly Volatility indicator is designed for determining volatility for the specified period and is displayed in a separate window as a histogram and line. If attached to a chart with the Н1 timeframe, the indicator displays the average price movement for each hour (from 0 to 23) based on the history data. On the D1 timeframe it displays the average movem
FREE
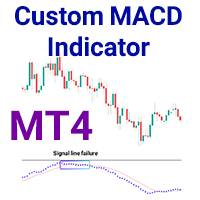
Custom MACD Indicator for MetaTrader 4 The Custom MACD Indicator for MetaTrader 4 is a powerful analytical tool used widely in technical trading to evaluate trend momentum, direction, and strength. It consists of two essential elements:
• MACD Line (blue): Derived from the gap between two exponential moving averages
• Signal Line (red): A smoothed average of the MACD line, aiding in pinpointing trend reversals with greater accuracy. «Indicator Installation & User Guide»
MT4 Indicator Installat
FREE

Are you tired of drawing trendlines every time you're analyzing charts? Or perhaps you would like more consistency in your technical analysis. Then this is for you. This indicator will draw trend lines automatically when dropped on a chart. How it works Works similar to standard deviation channel found on mt4 and mt5. It has 2 parameters: 1. Starting Bar 2. Number of bars for calculation The starting bar is the bar which drawing of the trend lines will begin, while the number of bars for c
FREE

Currency Power Meter Indicator for MetaTrader 4 The Currency Power Meter Indicator for MetaTrader 4 is a valuable analytical tool designed to evaluate the comparative strength of individual currencies. By measuring the percentage variation between the current day’s candle close and the previous day's close, it determines which currencies are gaining or losing momentum. For example, if the strength reading of the GBP is 0.30% and the JPY is 0.08%, the GBP is considered stronger. Therefore, in the
FREE
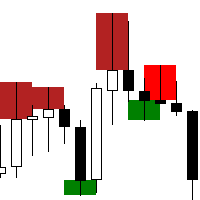
The "Rejection Block" MetaTrader 4 Indicator is a powerful tool designed to assist traders in identifying and visualizing rejection candlestick patterns, commonly referred to as rejection blocks. These patterns play a crucial role in market analysis as they often signify potential reversals or continuations in price movements. Key Features: Rejection Block Detection: The indicator meticulously scans price data to identify instances of rejection candlestick patterns. These patterns typically feat
FREE

YOU CAN NOW DOWNLOAD FREE VERSIONS OF OUR PAID INDICATORS . IT'S OUR WAY OF GIVING BACK TO THE COMMUNITY ! >>> GO HERE TO DOWNLOAD
The Volatility Ratio was developed by Jack D. Schwager to identify trading range and signal potential breakouts. The volatility ratio is defined as the current day's true range divided by the true range over a certain number of days N (i.e. N periods). The following formula is used to calculate the volatility ratio: Volatility Ratio (VR) = Today's True Range/Tru
FREE

ATR Volatility plots the ATR-based volatility, and triggers alerts when it crosses user-defined upper and lower thresholds (purple and tan lines, please see screenshots). Circles are painted when ATR volatility crosses either above the upper threshold, or below the lower threshold. This is a small tool custom-built by our group, by specific request of one of our customers. We hope you enjoy! Do you have an indicator you would like to see designed? Feel free to send us a message! Click here for m
FREE
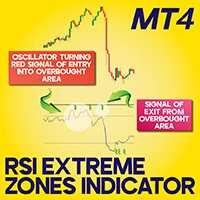
RSI Extreme Zones indicator for MetaTrader 4 The RSI Extreme Zones indicator for MetaTrader 4 is a refined momentum oscillator built on the traditional 14-period Relative Strength Index. This tool, compatible with the MT4 platform, enhances visual clarity by changing colors when price reaches critical thresholds: it turns red when the RSI crosses into the overbought region (above 70), and blue when it dips into the oversold region (below 30). This dynamic coloring helps traders swiftly recognize
FREE
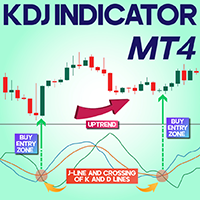
KDJ Indicator for MetaTrader 4 Download The KDJ Indicator is a refined evolution of the traditional Stochastic Oscillator. By incorporating the J line alongside the classic K and D lines, this indicator delivers deeper insights into market momentum and price dynamics. Its primary function is to highlight potential reversal zones by identifying overbought and oversold market conditions—helping traders to determine optimal entry and exit points with higher precision. «Indicator Installation & User
FREE

Judas Swing ICT Forex With Confirmation Indicator MT4 The Judas Swing ICT Forex with Confirmation Indicator is designed based on the ICT trading approach, leveraging market structure and liquidity analysis within the one-minute chart. This tool assists traders in recognizing key liquidity zones and significant trend reversals. This MetaTrader 4 indicator highlights areas where liquidity builds up and potential false breakouts, commonly referred to as Judas Swings . These zones are distinctly mar
FREE
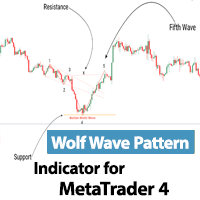
Wolf Wave Pattern Indicator MetaTrader 4 The Wolf Wave Pattern Indicator for MetaTrader 4 is a specialized technical analysis tool designed to detect wave structures within the financial markets. This indicator is particularly effective in identifying the Wolf Wave Pattern, which consists of five distinct geometric waves signaling potential market reversals. By using this indicator, traders can optimize their entry and exit points based on precise pattern recognition. «Indicator Installation & U
FREE
The MetaTrader Market is a unique store of trading robots and technical indicators.
Read the MQL5.community User Memo to learn more about the unique services that we offer to traders: copying trading signals, custom applications developed by freelancers, automatic payments via the Payment System and the MQL5 Cloud Network.
You are missing trading opportunities:
- Free trading apps
- Over 8,000 signals for copying
- Economic news for exploring financial markets
Registration
Log in
If you do not have an account, please register
Allow the use of cookies to log in to the MQL5.com website.
Please enable the necessary setting in your browser, otherwise you will not be able to log in.