How to Start with Metatrader 5 - page 42
You are missing trading opportunities:
- Free trading apps
- Over 8,000 signals for copying
- Economic news for exploring financial markets
Registration
Log in
You agree to website policy and terms of use
If you do not have an account, please register
Forum on trading, automated trading systems and testing trading strategies
PriceChannel Parabolic system
newdigital, 2013.03.22 14:04
PriceChannel Parabolic system
PriceChannel Parabolic system basic edition
Latest version of the system with latest EAs to download
How to trade
The settingas for EAs: optimization and backtesting
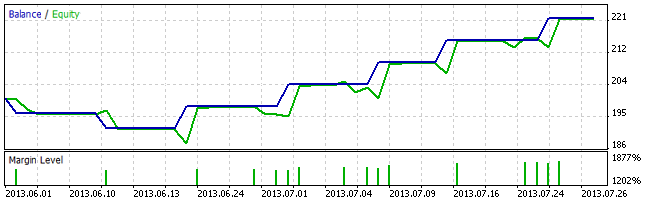
Trading examples
Metaquotes demo
GoMarkets broker, initial deposit is 1,000
Alpari UK broker initial deposit is 1,000
RoboForex broker initial deposit is 1,000
There are some people who are asking - "Where to start? This website is very big one ... how can I start with MT5, signals and the market?" ... well ... start with the following :
Forum on trading, automated trading systems and testing trading strategies
new bee
newdigital, 2013.12.23 16:51
you should read and read ...
and read articles.
No any personal consultant here sorry ... people may help but just for some concrete questions.
Forum on trading, automated trading systems and testing trading strategies
Indicators: RES-SUP
newdigital, 2014.05.21 12:44
Three Ways to Trade Support and Resistance (based on dailyfx article)
One of the more difficult concepts within Technical Analysis is grasping the premise of support and resistance. There are numerous ways to identify these levels, and even after identified, there are a plethora of ways of integrating and trading with them.
In this article, we’re going to show you three ways that traders can properly integrate these levels.
Risk Management/Stop Placement
While this may be the least ‘exciting’ of the three ways to integrate support and resistance, this is also probably the most important.
Stop-loss orders help traders prevent blowing up their entire accounts on just one or two bad trade ideas. We’ve looked at the importance of stops, and further, risk management in numerous of our previous articles.
Support and resistance can help traders to define their risk amounts for any individual position.
Let’s say that a trader wants to buy in a range, and if that range doesn’t continue, they want to close out the position quickly in an effort to mitigate the loss.
In this case, it makes sense to place the stop for the long position below support so that once support becomes violated, the stop-loss can close the position and the trader can look to avoid taking a larger loss.
Support and resistance can help with stop placement:
This can also work for reversal plays. If a trader is looking to buy a bullish reversal, they can look to the low that was established before the reversal began; and they can place their stop there. This way, if the reversal doesn’t pan out, and if prices do continue moving in the previous trend-side direction, the position can be closed as traders look to mitigate their loss.
The exact opposite would be the case for short positions, with traders looking to place stops above resistance so that should the market continue rising; the short position can be closed with a minimum of a loss.
Determining a Market’s Condition
We’ve all heard it since we were young: Buy low, and sell high.
If only matters were that simple.
What constitutes ‘high’ and what constitutes ‘low?’ After all, these are very relative matters, and low in a market today might be sky-high a week from now.
This is where support and resistance come into play, and this is why finding strong, confluent levels can be so beneficial.
Think about why support or resistance may come into a market: The only real reason is due to an influx of buyers or sellers at a particular price level.
Let’s say that we’re expecting support at a price of 1.6750 on GBPUSD; which is a psychological level in the currency pair. As prices move lower towards this expected support level, buyers begin coming into the market in anticipation of a future support level being so close. As prices move closer and closer to this level of support, more and more buyers notice this ‘perceived value’ in GBPUSD and they also look to enter in long cable positions. The exact low of the move is considered a ‘price action swing.’
Eventually, the number of buyers in GBPUSD outstrips the number of sellers, and this is what creates a reversal in the market as the higher level of demand takes over smaller level of supply. This is how price action works, and it happens in short and long-terms alike.
Price action will also help traders see support and resistance in trending markets and ranging markets as well.
In trending markets, prices will generally make ‘higher-highs’ and ‘higher-lows,’ or ‘lower-lows’ and ‘lower-highs,’ while ranging markets will generally display more stable levels of support and resistance. The example below in USDJPY shows both of these types of environments on the same chart.
Current price relationship with Support/Resistance can define the market’s condition:
After the market condition has been identified, traders can then move on to the next step of placing the trade.
Enter Positions
After traders have been able to allocate risk and grade market conditions using price action with support and resistance, they can move on to the next logical step in looking to place trades and enter positions.
Remember that future prices are unpredictable. Implementing support or resistance simply gives us the possibility that support or resistance may hold; and if it does in-fact hold, then traders can look for rewards or profits that are significantly larger than the amount they had to risk.
If a trader is looking to buy an up-trend, they want to look to do so cheaply. So they can simply wait for prices to retrace a portion of the up-trend until a support level comes in to the market. This support level can be a psychological level, or a Fibonacci retracement, or a pivot point; better yet, this support level can offer confluence from multiple types of support/resistance analysis.
After price action has exhibited that the retracement may be over, the trader can look to enter long with a stop below the support level. This way, if the up-trend doesn’t continue coming back in the market, the loss can be mitigated. But if the trend does come in, then the trader can look to profit two, three, or four times the amount they had to initially risk entering the position.
The image below, taken from the article, shows how traders can look to buy after this ‘higher-low’ was made in the up-trend.
Price action can be used to enter positions in trending markets:
But what if the market isn’t displaying a bias?
If the market is ranging, traders can still utilize price action to look at risk-efficient ways of entering trades and positions.In the image below, we illustrate how traders can use price action along with support and resistance to build a range-strategy in a market devoid of any significant trends.
Price action can also be used to enter trades in ranging markets:
Forum on trading, automated trading systems and testing trading strategies
Indicators: Simple Scalping System
newdigital, 2014.05.22 08:45
The Scalpers Checklist (based on dailyfx article)
Traders should have a checklist to consult prior to making any major trading decisions. These steps are critical for Forex scalpers as they often have to make these choices on a moment’s notice. To help with the process it can be helpful to keep a checklist and determine your options prior to approaching the market. Today we will review the scalper’s checklist. Let’s get started!
Identify Market Conditions
The first task assigned to day traders and scalpers is to identify market conditions. Is the market trending or ranging? Is the volatility of an asset low or high? These are both important questions that should be answered prior to entering into a new trade idea. Not only will this help Forex traders which currency pair to trade, but also help determine their strategy. Every scalper and day trader should check this off their list, prior to considering any market entries!
Choose a Strategy
Once market conditions are found, traders need to identify a strategy that is congruent with the market. If you are trading a trend, you will need to not only find market direction but also decide if you are going to trade a retracement, momentum or breakout strategy. In lack of a trend, traders again need to decide how to approach pricing patterns, support & resistance values, as well as potential breakouts. With so many strategies to choose from, it is worth taking your time and doing your due diligence prior to checking this off your scalping list.
Plan Your Entry
Next traders need to select how they are going to enter into the market. Typically traders need to first determine if they will trade with market orders or entry orders. Market orders allow you to trade immediately if conditions are met and you are immediately in front of your trading terminal. Entry orders can be used and will execute at a designated price even if you aren’t watching the market.
Once this is decided, traders need to evaluate which indicators if any will be used for trading. In the event an indicator is added to the graph, prior to execution, plan on its use and know its strengths as well as limitations. When you are 100% certain on your entry triggers then you can proceed to the next portion of the checklist.
Manage Risk
This point of our check list goes beyond the simple placement of stop and limit orders. Scalpers must carefully consider how much they should risk on each trade. At this point specific questions should arise. How many pips are you risking per trade? What is your average profit target per trade? How does a stop order being executed equate to a loss on my account?
While no trader wants to take a loss it is paramount to determine these values prior to scalping. Once these values are set, you can mark this point off your checklist. Now all you have left is to hold yourself accountable to your trading decisions.
Log the Results
Traders, especially short term scalpers, have a tendency to always be looking for the next trade. While looking for trading opportunities isn’t a bad thing, we should also remember to go back and review past events. Keeping a trading log can help us establish market patterns and reflect if your strategy is working in current conditions.
To help with this process, traders should note, why, when and how they entered into a trade. If your strategy is working, stick with it and keep your original strategy rules. If you’re trading is not working out as planned, with a log you can identify what must be changed and make appropriate adjustments.
While this checklist may seem daunting at first, these are all important steps to consider before scalping.
Forum on trading, automated trading systems and testing trading strategies
How to Start with Metatrader 5
newdigital, 2013.09.20 08:21
Summaries :
====
Forum on trading, automated trading systems and testing trading strategies
Press review
newdigital, 2014.05.23 17:02
Should You Exit Your FX Trade On Strength Or Weakness? (based on dailyfx article)
“You can’t control what the market does, but you can control your reaction to the market. I examine what I do all the time. That’s what trading is all about.”
-Steve Cohen, Hedge Fund Manager
In my experience, the more years a trader has under their belt, the more attention they pay to the exit on their trade. It’s not that the entry isn’t important, it’s just that there’s a direct profit impact based on your exit. This article will breakdown two methodologies for exiting your forex trades so that you can choose the one that aligns best with your personality & goals.
Why Traders Neglect the Exit
As a trader, it’s easy to focus on entering the trade. After all, you’ve got to be in it to when it and the only way to be in it is to find an entry. And when it comes to entering into a trade, your mind is likely to race to different outcomes about whether or not this trade will be a home-run that “can’t fail” or whether you’re not 100% sure on the trade and therefore, should either hold-off or enter with a smaller trade size. For what it’s worth, regardless of your analysis, the second attitude used as an example is the healthier approach
However, it’s probably best to take the pressure of yourself regarding the entry. Why? Because, you likely will get at best a decent entry unless you’re counter-trend trading. It’s an irony or paradox of trading that most new traders fret about the entries but where they decide to exit is the most crucial point.
Two Exit Approaches
This part is simple. As far as I’m concerned, there are only two ways that you can decide to exit a trade (well, three if not having a plan is a way to exit). The first method benefits short term traders and that is exiting on strength in the direction of your entry. Therefore, if you’re buying, you can look for clear resistance points or other methods to exit when others are jumping in. The drawback to this methodology is that you could be exiting as the move is just getting started.
The second method is to the benefit of swing style or longer term traders. The preferred exit methodology for longer-term traders is to exit on weakness or a correction in the trend that you’re entering. Exiting on weakness has two distinct drawbacks and that is you either get taken out on a wick low before the trend resumes and / or, you find yourselves leaving a large portion of your paper profits on the table.
Specific Tools for Both Exit Strategies
We just discussed that you can either decide to exit your trades on strength or weakness. To exit on strength, here are a few methodologies you can use that I’ve found favorable over the years:
My preferred methodology is Pivot targets. In a normal uptrend, I’ll look to exit at the weekly R1 level and in a strong uptrend, my preferred exit is the R2 (reversed for downtrends with S1 & S2). The other two methods have been used successfully by many traders.
Emotionally, I believe it’s harder for new traders to exit on weakness. The reason is that it’s easy to beat yourself up for letting so much of your paper profits go away. In order to be comfortable exiting on strength, it’s best to not look at the chart after you exit for a few hours because you don’t want to beat yourself for taking money out of the market. That’s what we’re doing here in the first place!
Forum on trading, automated trading systems and testing trading strategies
BRAINWASHING SYSTEM
newdigital, 2013.05.12 16:25
This is the thread about Brainwashing system. We will start with original version of this system and will improve it later.
==========
Just something about the history. There are 3 famous signals system (manual trading systems based on signal indicators): Asctrend, BrainTrend and Brainwashing. First two system were already explained and developed by indicators and EAs. So, we are going to discuss the last signal system: Brainwashing.
==========
Just for information:
ASCTREND SYSTEM
The Theory.
Manual Trading statements
Second version of this manual trading system and for now - asctrend indicator together with NRTR indicator
First version of AsctrendND EA.
Next version of AsctrendND EA (verion 1.02) with TrendStrength filter added.
BRAINTRADING SYSTEM
How To Create Your Own Mmanual Trading Signal System Based On Indicators From MT5 CodeBase - Instruction For Non-Programmers
Forum on trading, automated trading systems and testing trading strategies
Can we read news in news tab ?
newdigital, 2014.06.01 14:13
May be - it is not fully related to this topic sorry, but there is good article:
------
Building an Automatic News Trader :
As Investopedia states, a news trader is "a trader or investor who makes trading or investing decisions based on news announcements". Indeed, economic reports such as a country's GDP, consumer confidence indexes and employment data of countries, amongst others, often produce significant movements in the currency markets. Have you ever attended a U.S. Non-Farm Payrolls release? If so, you already know that these reports may determine currencies' recent future and act as catalysts for trends reversals.
Forum on trading, automated trading systems and testing trading strategies
Indicators: i-Fractals-sig
newdigital, 2014.06.03 11:51
Follow The Fractal Tool Toward Better Breakout Entries (based on dailyfx article)
- Fractals Defined
- How Traders Can Use Fractals
- Real-Time Fractal Set-Up
“You can either buy low & sell high or trade with the trend, but you cannot do both.”-Bill Williams
Many traders spend too much time looking for the best possible entry. However, the entry can be based on any number of technical indicators. For traders who are a fan of price-action, you could do no worse than finding triggers based on a fractal breakout in the direction of the trend.
Fractals Defined
Let’s start with an introduction to fractals. The actually are applied to trading from nature and not the other way around. It may be helpful to know that fractals are effectively a way of looking a sub-sets of large pieces of data to understand what developments are being created in real-time. From a trading / market perspective, fractals are an indicator highlighting the chart’s local highs and lows where the price movement reversed marking a 5-bar high or low. These reversal points are called respectively Fractal highs and lows.
The Hand is a Perfect Fractal
Before we take this natural reoccurrence to the market, you should see how your hand, with fingers pointing up is the perfect up fractal and with your palm facing you, is a perfect down fractal. A Market swing Fractal shows a price extreme in the middle of 5 bars whereas an up fractal has the middle bar with a highest high in the middle with two lower highs on the left and two lower highs on the right. A down fractal will have a low price extreme in the middle bar of a 5-bar sequence with the higher lows on the left and two higher lows on the right.
How Traders Can Use Fractals
Volatility is a key determinant to trading opportunities. One of the common triggers that volatility is in play is when a prior high or low is taken out and a new trend begins. Fractals can be applied to the chart so that you can see when a recent key level has broken which can lead to a price-action trading opportunity.
Fractals revolve around price action highs and lows and can easily pinpoint places for a breakout entry or tight price action based stop. Fractals can be used in a variety of ways. Most commonly, traders will look for a bar to close above a prior up fractal to show an upside breakout or a close below a prior down fractal to signal a downside breakout that is potentially worth trading. Another positive aspect is that when you have a comfortable view of a strong trend in play, you can use fractals as a trailing stop from a prior counter-trend move which made a fractal.
Real-Time Fractal Set-Up
For purpose of review, fractals mark price changes or pivots in the market. For reasons known or unknown, they are reaction points that can help you spot key places to place an entry order or stop. From a trader’s stand-point, they allow you to enter on a confirming view of your analysis vs. a hunch that a market is oversold or overbought and is time to enter like this trade set-up on the Australian Dollar.
A Fractal Based Entry on AUDUSD :
Every trader should embrace the following seven words:
I don’t know what will happen next
This isn’t meant to disregard your analysis but tell a simple fact about trading. Anything can happen in the market place and an infinite number of possibilities are plausible. As a trader, we can develop a strategy with set rules that work with our psychology to give us an edge but it will not predict the future. Therefore, we can use fractals as a trigger to put us into a trade or out of a trade and we may not know if the trade will end in a profit but we can now that we’re only acting on objective evidence.
Forum on trading, automated trading systems and testing trading strategies
Indicators: Levels
newdigital, 2014.06.04 12:44
Gold Presses Fibonacci Wave Relationship
- Triangles are consolidation patterns that tend provide clean technical levels to trade from
- Gold may be nearing a bullish reaction point that offers a trading opportunity to buy
- Try trading gold in a practice demo account
Gold appears to be consolidating in a sideways triangle for the past 12 months. This is a big consolidation pattern that offers some trading opportunities inside the triangle.Look for the yellow metal to find support over the next several days and a potential $100 rise in the price of the gold.
The Anatomy of a Triangle
Triangles are consolidation patterns that allow prices to trade sideways in an effort to alleviate overbought and oversold pressures. In the case of gold, it has been working its way lower for the past three years and needs to consolidate those losses, which it has been doing in the triangle pattern.
Elliott Wave triangles are made up of five waves inside the triangle with each wave being contained inside the previous wave. In the idealized example above, notice how wave ‘B’ ends BEFORE the beginning of wave ‘A’. Notice how wave ‘C’ ends BEFORE the beginning of wave ‘B’. This continues until prices squeeze together in five waves (A-B-C-D-E) then they eventually explode.
In the same idealized example above, it appears gold is closing in on the end of the ‘D’ wave which should yield a bounce higher in wave ‘E’.
wave ending near $1235 per ounce. Both wave relationships are expressed through alternating waves having a fibonacci relationship in length.
First, inside the green ‘D’ wave, you’ll see we have a blue a-b-c sequence. Many times, the length of wave ‘c’ will have an equality or fibonacci relationship to the length of wave ‘a’. In the case for gold, the length of blue wave ‘c’ equals blue wave ‘a’ times 61.8% at $1235 per ounce.
Secondly, green wave ‘B’ and green wave ‘D’ are alternating waves. If you take the distance of green wave ‘B’ and multiply it by 61.8% and project it for a distance on green wave ‘D’, it yields a price target of $1235 per ounce.
So we have two different alternating waves pointing to the same price target. This means there will likely be a reaction higher near $1235. If $1235 does fail, look to $1190-$1200 providing significant support.
The price target to the upside in this scenario would be $1340-$1390. So there is enough room to the upside to position towards the long side of the trade.