Indicators: Levels
How to Trade a Descending Triangle
Talking Points
- Triangle price patterns can be used in Forex trading to identify potential breakout setups
- Descending triangles form when a rising trend line and a horizontal support line converge
- Traders can look for the breakout from the descending triangle to signal the continuation of the AUDJPY down move.
===============
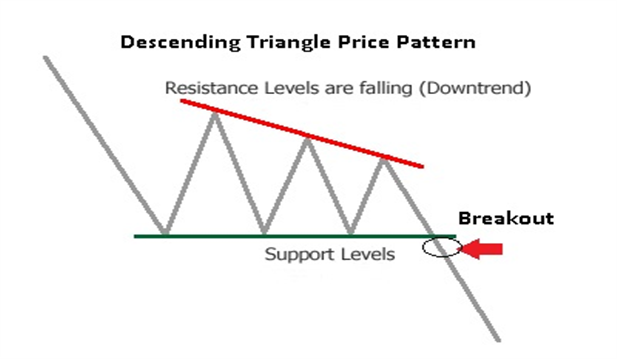
What is a Descending Triangle pattern?
A descending triangle pattern is consolidation price pattern composed of lower swing highs pushed lower by an established downtrend line converging with a horizontal support made up of a series of swing lows located in roughly the same area. Another name for the descending triangle is the right triangle pattern due to its similarity to the geometric shape of the same name. The height of the triangle meets the horizontal support at a 90 degree angle.
Usually, descending triangles form as profit taking by sellers is met with bargain hunting buyers. However, the buying pressure is mutted as higher lows are not made. A news release or economic announcement could be the catalyst required to push price out of this coil tilting the balance strongly in the seller's favor. Unlike its cousins, the symmetrical triangle and ascending triangle, the descending lacks significant bullish participation indicated by that lack of higher lows.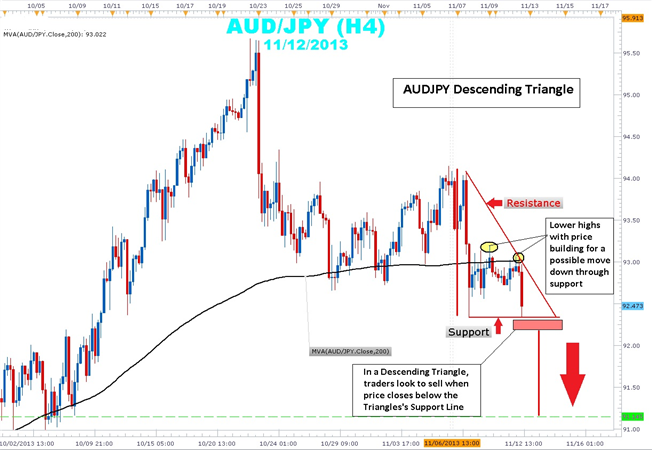
Taking a look at the current AUDJPY 4-hour chart, you can clearly see price action bound between a descending trend line that connects the 11/6 swing high of 94.15 to 11/12 swing high of 93.05. This swing high is a lower swing high than the 11/10 93.19 swing high showing the building strength in the downtrend. Current price action within the triangle is below the 200 simple moving average (SMA), a key indicator that traders use to determine bullishness or bearishness.
Traders will watch price action for a 4-hour candle close below support to confirm that there is follow through in a potential breakout. Stops can be placed near the middle of the triangle just above the 93.00 and 200 SMA. The height of the triangle is a little over 170 pips. By extending this height from the support level of a potential breakout zone, look for a possible target of 91.14. The profit target coincides with the lows seen back on October 2nd.
In summary, descending triangles can be an excellent way to rejoin a downtrend that clearly illustrates risk and reward. Price has a tendency to break form the descending triangle in a downward direction.
Gold Presses Fibonacci Wave Relationship
- Triangles are consolidation patterns that tend provide clean technical levels to trade from
- Gold may be nearing a bullish reaction point that offers a trading opportunity to buy
- Try trading gold in a practice demo account
Look for the yellow metal to find support over the next several days and a potential $100 rise in the price of the gold.
The Anatomy of a Triangle
Triangles are consolidation patterns that allow prices to trade sideways in an effort to alleviate overbought and oversold pressures. In the case of gold, it has been working its way lower for the past three years and needs to consolidate those losses, which it has been doing in the triangle pattern.
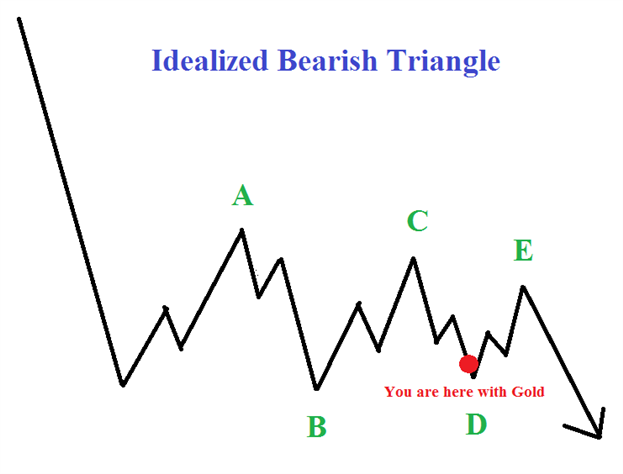
Elliott Wave triangles are made up of five waves inside the triangle with each wave being contained inside the previous wave. In the idealized example above, notice how wave ‘B’ ends BEFORE the beginning of wave ‘A’. Notice how wave ‘C’ ends BEFORE the beginning of wave ‘B’. This continues until prices squeeze together in five waves (A-B-C-D-E) then they eventually explode.
In the same idealized example above, it appears gold is closing in on the end of the ‘D’ wave which should yield a bounce higher in wave ‘E’.
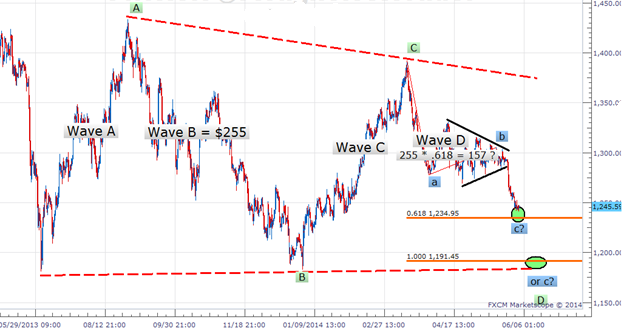
wave ending near $1235 per ounce. Both wave relationships are expressed through alternating waves having a fibonacci relationship in length.
First, inside the green ‘D’ wave, you’ll see we have a blue a-b-c sequence. Many times, the length of wave ‘c’ will have an equality or fibonacci relationship to the length of wave ‘a’. In the case for gold, the length of blue wave ‘c’ equals blue wave ‘a’ times 61.8% at $1235 per ounce.
Secondly, green wave ‘B’ and green wave ‘D’ are alternating waves. If you take the distance of green wave ‘B’ and multiply it by 61.8% and project it for a distance on green wave ‘D’, it yields a price target of $1235 per ounce.
So we have two different alternating waves pointing to the same price target. This means there will likely be a reaction higher near $1235. If $1235 does fail, look to $1190-$1200 providing significant support.
The price target to the upside in this scenario would be $1340-$1390. So there is enough room to the upside to position towards the long side of the trade.
- Free trading apps
- Over 8,000 signals for copying
- Economic news for exploring financial markets
You agree to website policy and terms of use
Levels:
Another version of the indicator that calculates support/resistance levels.
Author: Nikolay Kositsin