
MQL5でカスタムキャンバスグラフィックを使用したケルトナーチャネルインジケーターの構築
はじめに
本記事では、MetaQuotes Language 5 (MQL5)を用いて、カスタムキャンバスグラフィック付きのケルトナーチャネルインジケーターを構築します。ケルトナーチャネルは移動平均(MA)とATRを組み合わせることで、動的なサポートおよびレジスタンスレベルを算出し、トレンドの方向やブレイクアウトの可能性を判断する助けとなります。この記事で取り上げるトピックは以下の通りです。
- ケルトナーチャネルインジケーターの理解
- 設計図:インジケーターのアーキテクチャを分解する
- MQL5での実装
- カスタムキャンバスグラフィックの統合
- ケルトナーチャネルインジケーターのバックテスト
- 結論
ケルトナーチャネルインジケーターの理解
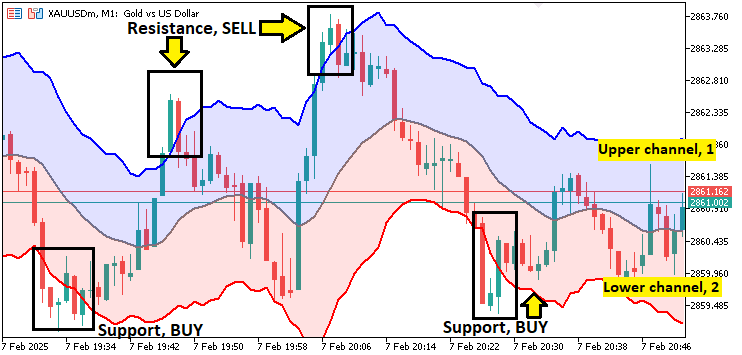
ケルトナーチャネルは、ボラティリティに基づいたテクニカル指標で、移動平均(MA)を用いて価格データを平滑化し、ATRを使ってサポート・レジスタンスのレベルを動的に設定します。チャネルは3本のラインで構成されており、中央のラインには一般的に移動平均が用いられ、市場のトレンドを反映します。一方、上限チャネルと下限チャネルは、ATRの倍数をそれぞれ加算・減算することで算出されます。この手法により、インジケーターは市場のボラティリティに応じて調整され、ブレイクアウトの可能性があるポイントや、価格が反転しやすい領域を見つけやすくなります。
実際の取引においては、このインジケーターを使うことで、モメンタムが変化する可能性のある重要な水準を特定するのに役立ちます。価格が上限チャネルまたは下限チャネルを超えて動いた場合、市場が過熱している、あるいは反転の兆しがあることを示唆します。これは、トレンドフォロー戦略や平均回帰戦略の両方において、有効な判断材料を提供します。このインジケーターの動的な特性により、ボラティリティの変化に応じてサポートやレジスタンスの水準も調整され、市場環境が変化しても常に適切なレベルが維持されます。以下は視覚的な例です。
設計図:インジケーターのアーキテクチャを分解する
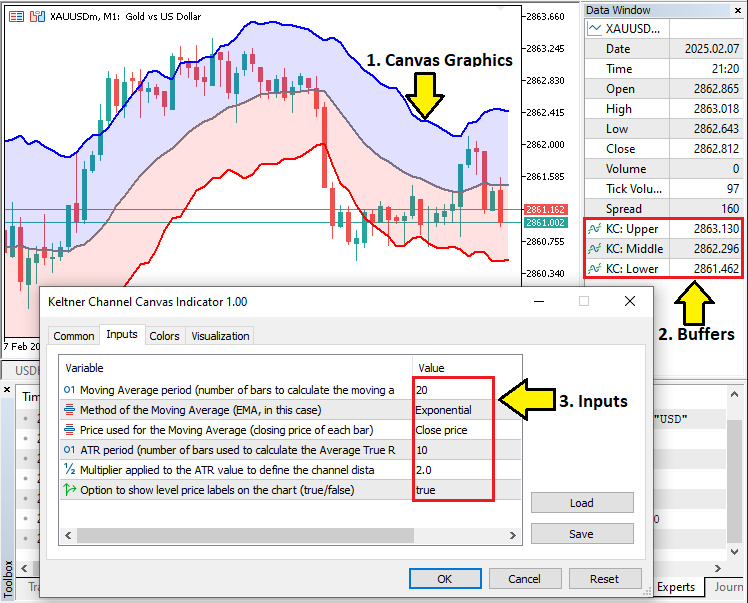
インジケーターのアーキテクチャは、「入力パラメータ」「インジケーターバッファ」「グラフィカルプロパティ」という3つの責任を明確に分離して構築します。まず、移動平均の期間、ATRの期間、ATRの乗数といった、インジケーターの動作を決定する主要な入力パラメータを定義します。次に、上限チャネル、中央ライン、下限チャネルの値を格納するための3つのバッファを割り当てます。これらのバッファはグラフィカルな描画にリンクされ、色、線の太さ、描画シフトなどのプロパティは、MQL5の組み込み関数を使用して設定します。また、計算も組み込み関数を活用することで、インジケーターが市場のボラティリティに応じて動的に変化できるようにします。
さらに、両方のインジケーターハンドルが正しく作成されていることを確認し、計算の信頼性を確保するために、エラー処理も組み込みます。コアとなるインジケーターロジックに加えて、チャート上にビットマップラベルをオーバーレイ表示するなど、カスタムキャンバスグラフィックを統合して、視覚的なプレゼンテーションも強化します。このモジュール型の設計により、将来的なデバッグや変更が容易になるだけでなく、データ計算からビジュアル出力に至るまで、各コンポーネントが連携して動作し、堅牢かつ視覚的に洗練された取引ツールを実現します。要するに、私たちが達成する3つのポイントは次のとおりです。
MQL5での実装
MQL5でインジケーターを作成するには、まずMetaEditorを開き、ナビゲータに移動して、インジケーターフォルダを見つけ、[新規]タブをクリックして、表示される手順に従ってファイルを作成します。ファイルが作成されたら、コーディング環境内でインジケーターのプロパティと設定を定義していきます。これには、バッファの数、プロットの数、および各ラインの色、太さ、ラベルなどの個別プロパティの設定が含まれます。
//+------------------------------------------------------------------+
//|                             Keltner Channel Canvas Indicator.mq5 |
//|                        Copyright 2025, Forex Algo-Trader, Allan. |
//|                                 "https://t.me/Forex_Algo_Trader" |
//+------------------------------------------------------------------+
#property copyright "Forex Algo-Trader, Allan"
#property link      "https://t.me/Forex_Algo_Trader"
#property version   "1.00"
#property description "Description: Keltner Channel Indicator"
#property indicator_chart_window

//+------------------------------------------------------------------+
//| Indicator properties and settings                                |
//+------------------------------------------------------------------+

// Define the number of buffers used for plotting data on the chart
#property indicator_buffers 3  // We will use 3 buffers: Upper Channel, Middle (MA) line, and Lower Channel

// Define the number of plots on the chart
#property indicator_plots   3  // We will plot 3 lines (Upper, Middle, and Lower)

//--- Plot settings for the Upper Keltner Channel line
#property indicator_type1   DRAW_LINE        // Draw the Upper Channel as a line
#property indicator_color1  clrBlue           // Set the color of the Upper Channel to Blue
#property indicator_label1  "Upper Keltner"   // Label of the Upper Channel line in the Data Window
#property indicator_width1  2                 // Set the line width of the Upper Channel to 2 pixels

//--- Plot settings for the Middle Keltner Channel line (the moving average)
#property indicator_type2   DRAW_LINE        // Draw the Middle (MA) Channel as a line
#property indicator_color2  clrGray           // Set the color of the Middle (MA) Channel to Gray
#property indicator_label2  "Middle Keltner"  // Label of the Middle (MA) line in the Data Window
#property indicator_width2  2                 // Set the line width of the Middle (MA) to 2 pixels

//--- Plot settings for the Lower Keltner Channel line
#property indicator_type3   DRAW_LINE        // Draw the Lower Channel as a line
#property indicator_color3  clrRed            // Set the color of the Lower Channel to Red
#property indicator_label3  "Lower Keltner"   // Label of the Lower Channel line in the Data Window
#property indicator_width3  2                 // Set the line width of the Lower Channel to 2 pixels
まず、キーワード#propertyを使用して、バージョンなどのインジケーターメタデータを設定します。次に、プロパティindicator_buffersを使用して3つのインジケーターバッファを割り当てます。これらのバッファーは、「上限チャネル」、「中間移動平均(MA)」、および「下限チャネル」の計算された値を格納および管理します。また、indicator_plotsを3に設定し、チャート上に3つの個別のグラフィカルプロットが描画されることを定義します。それぞれのプロットに対して、特定の視覚的プロパティを設定していきます。
- 上限ケルトナーチャネル:このラインには、DRAW_LINEマクロを「インジケータータイプ」として割り当て、連続したラインとして描画されるようにします。色はclrBlueを使用して「青」に設定し、データウィンドウで識別できるようにラベルは「Upper Keltner」とします。視認性を高めるため、線の太さは2ピクセルに設定します。
- 中央ケルトナーチャネル(移動平均):同様に、このラインのタイプもDRAW_LINEに設定し、色は「灰色」を使用します。ラベルには「Middle Keltner」を割り当てます。このラインは中心となる移動平均を表し、上限および下限チャネルの基準となる重要な役割を果たします。
- 下限ケルトナーチャネル:このラインも DRAW_LINE として定義し、他のラインと区別するために「赤」を使用します。ラベルには「Lower Keltner」を割り当て、線の太さは2ピクセルに設定します。
これらのプロパティの設定が完了したら、次に入力パラメータの定義へと進みます。
//+------------------------------------------------------------------+
//| Input parameters for the indicator                               |
//+------------------------------------------------------------------+

//--- Moving Average parameters
input int    maPeriod=20;                 // Moving Average period (number of bars to calculate the moving average)
input ENUM_MA_METHOD maMethod=MODE_EMA;   // Method of the Moving Average (EMA, in this case)
input ENUM_APPLIED_PRICE maPrice=PRICE_CLOSE; // Price used for the Moving Average (closing price of each bar)

//--- ATR parameters
input int    atrPeriod=10;                // ATR period (number of bars used to calculate the Average True Range)
input double atrMultiplier=2.0;           // Multiplier applied to the ATR value to define the channel distance (upper and lower limits)
input bool   showPriceLabel=true;         // Option to show level price labels on the chart (true/false)
ここでは、入力プロパティを定義します。移動平均に関しては、maPeriod(デフォルトは20)を設定し、計算に使用するバーの本数を指定します。ENUM_MA_METHOD型のmaMethodにはMODE_EMAを設定し、指数移動平均を使用することを示します。また、ENUM_APPLIED_PRICE型のmaPriceにはPRICE_CLOSEを設定し、終値に基づいて計算が行われるようにします。
ATRに関しては、atrPeriod(デフォルトは10)がボラティリティを算出する際に使用するバーの数を決定し、atrMultiplier(デフォルトは2.0)が移動平均から上下チャネルまでの距離を設定します。最後に、showPriceLabel(デフォルトはtrue)は、チャート上に価格ラベルを表示するかどうかを制御します。これらの設定により、インジケーターはさまざまな市場環境に柔軟に対応できるようになります。最後に、これから使用するインジケーターハンドルを定義する必要があります。
//+------------------------------------------------------------------+
//| Indicator handle declarations                                    |
//+------------------------------------------------------------------+

//--- Indicator handles for the Moving Average and ATR
int    maHandle = INVALID_HANDLE;   // Handle for Moving Average (used to store the result of iMA)
int    atrHandle = INVALID_HANDLE;  // Handle for ATR (used to store the result of iATR)

//+------------------------------------------------------------------+
//| Indicator buffers (arrays for storing calculated values)         |
//+------------------------------------------------------------------+

//--- Buffers for storing the calculated indicator values
double upperChannelBuffer[];  // Buffer to store the Upper Channel values (Moving Average + ATR * Multiplier)
double movingAverageBuffer[]; // Buffer to store the Moving Average values (middle of the channel)
double lowerChannelBuffer[];  // Buffer to store the Lower Channel values (Moving Average - ATR * Multiplier)

//+------------------------------------------------------------------+
//| Global variables for the parameter values                        |
//+------------------------------------------------------------------+

//--- These variables store the actual input parameter values, if necessary for any further use or calculations
int    maPeriodValue;      // Store the Moving Average period value
int    atrPeriodValue;     // Store the ATR period value
double atrMultiplierValue; // Store the ATR multiplier value

//+------------------------------------------------------------------+
ここでは、ケルトナーチャネルの計算に必要なインジケーターハンドル、バッファ、そしていくつかのグローバル変数を宣言します。ハンドルはインジケーターへの参照を保持し、値を動的に取得できるようにします。maHandleおよびatrHandleは初期状態としてINVALID_HANDLEに設定し、割り当て前の適切なハンドル管理をおこないます。
次に、インジケーターバッファを定義します。これらは、描画に使用する計算済みの値を格納する配列です。upperChannelBuffer は上限チャネルの値を保持し、movingAverageBuffer は中央の移動平均ラインを、lowerChannelBuffer は下限チャネルの値を格納します。これらのバッファにより、チャート上にスムーズなケルトナーチャネルの視覚表示が可能になります。最後に、入力パラメータを保持するためのグローバル変数を導入します。maPeriodValueとatrPeriodValueはそれぞれユーザーが設定した移動平均とATRの期間を格納し、atrMultiplierValueはチャネル幅の決定に使用される乗数を保持します。これで、インジケータープロットの設定やハンドルの初期化など、必要な処理をおこなう初期化イベントハンドラへと進む準備が整いました。
//+------------------------------------------------------------------+
//| Custom indicator initialization function                         |
//+------------------------------------------------------------------+
int OnInit()
{
   //--- Indicator buffers mapping
   // Indicator buffers are used to store calculated indicator values.
   // We link each buffer to a graphical plot for visual representation.
   SetIndexBuffer(0, upperChannelBuffer, INDICATOR_DATA);  // Buffer for the upper channel line
   SetIndexBuffer(1, movingAverageBuffer, INDICATOR_DATA); // Buffer for the middle (moving average) line
   SetIndexBuffer(2, lowerChannelBuffer, INDICATOR_DATA);  // Buffer for the lower channel line

   //--- Set the starting position for drawing each plot
   // The drawing for each line will only begin after a certain number of bars have passed
   // This is to avoid showing incomplete calculations at the start
   PlotIndexSetInteger(0, PLOT_DRAW_BEGIN, maPeriod + 1); // Start drawing Upper Channel after 'maPeriod + 1' bars
   PlotIndexSetInteger(1, PLOT_DRAW_BEGIN, maPeriod + 1); // Start drawing Middle (MA) after 'maPeriod + 1' bars
   PlotIndexSetInteger(2, PLOT_DRAW_BEGIN, maPeriod + 1); // Start drawing Lower Channel after 'maPeriod + 1' bars

   //--- Set an offset for the plots
   // This shifts the plotted lines by 1 bar to the right, ensuring that the values are aligned properly
   PlotIndexSetInteger(0, PLOT_SHIFT, 1); // Shift the Upper Channel by 1 bar to the right
   PlotIndexSetInteger(1, PLOT_SHIFT, 1); // Shift the Middle (MA) by 1 bar to the right
   PlotIndexSetInteger(2, PLOT_SHIFT, 1); // Shift the Lower Channel by 1 bar to the right

   //--- Define an "empty value" for each plot
   // Any buffer value set to this value will not be drawn on the chart
   // This is useful for gaps where there are no valid indicator values
   PlotIndexSetDouble(0, PLOT_EMPTY_VALUE, 0.0); // Empty value for Upper Channel
   PlotIndexSetDouble(1, PLOT_EMPTY_VALUE, 0.0); // Empty value for Middle (MA)
   PlotIndexSetDouble(2, PLOT_EMPTY_VALUE, 0.0); // Empty value for Lower Channel

   //--- Set the short name of the indicator (displayed in the chart and Data Window)
   // This sets the name of the indicator that appears on the chart
   IndicatorSetString(INDICATOR_SHORTNAME, "Keltner Channel");

   //--- Customize the label for each buffer in the Data Window
   // This allows for better identification of the individual plots in the Data Window
   string short_name = "KC:"; // Shortened name of the indicator
   PlotIndexSetString(0, PLOT_LABEL, short_name + " Upper");  // Label for the Upper Channel
   PlotIndexSetString(1, PLOT_LABEL, short_name + " Middle"); // Label for the Middle (MA)
   PlotIndexSetString(2, PLOT_LABEL, short_name + " Lower");  // Label for the Lower Channel

   //--- Set the number of decimal places for the indicator values
   // _Digits is the number of decimal places used in the current chart symbol
   IndicatorSetInteger(INDICATOR_DIGITS, _Digits); // Ensures indicator values match the chart's price format

   //--- Create indicators (Moving Average and ATR)
   // These are handles (IDs) for the built-in indicators used to calculate the Keltner Channel
   // iMA = Moving Average (EMA in this case), iATR = Average True Range
   maHandle = iMA(NULL, 0, maPeriod, 0, maMethod, maPrice); // Create MA handle (NULL = current chart, 0 = current timeframe)
   atrHandle = iATR(NULL, 0, atrPeriod); // Create ATR handle (NULL = current chart, 0 = current timeframe)

   //--- Error handling for indicator creation
   // Check if the handle for the Moving Average (MA) is valid
   if(maHandle == INVALID_HANDLE)
     {
      // If the handle is invalid, print an error message and return failure code
      Print("UNABLE TO CREATE THE MA HANDLE REVERTING NOW!");
      return (INIT_FAILED); // Initialization failed
     }

   // Check if the handle for the ATR is valid
   if(atrHandle == INVALID_HANDLE)
     {
      // If the handle is invalid, print an error message and return failure code
      Print("UNABLE TO CREATE THE ATR HANDLE REVERTING NOW!");
      return (INIT_FAILED); // Initialization failed
     }

   //--- Return success code
   // If everything works correctly, we return INIT_SUCCEEDED to signal successful initialization
   return(INIT_SUCCEEDED);
}
//+------------------------------------------------------------------+
ここでは、OnInitイベントハンドラ内でケルトナーチャネルインジケーターの初期化をおこないます。バッファ、プロット、オフセット、ハンドルを適切に設定し、正しい描画と計算がおこなわれるようにします。まず、SetIndexBuffer関数を使用して、各インジケーターバッファを対応するグラフィカルプロットにリンクします。これにより、「上限チャネル」「中央の移動平均(MA)ライン」「下限チャネル」が正しく表示されるようになります。
次に、PlotIndexSetInteger関数を使って描画の挙動を定義します。不完全な計算結果が表示されないようにするため、描画は maPeriod + 1本目のバー以降から開始するように設定します。さらに、PLOT_SHIFTを使用して右方向へのシフトを適用し、描画された値が正しく配置されるようにします。欠損データを処理するために、PlotIndexSetDouble関数を使って各バッファに空の値として0.0を設定します。
次に、表示設定を構成します。IndicatorSetString関数を使用してインジケーター名を設定し、PlotIndexSetStringによって「データウィンドウ」に表示される各ラインのラベルを設定します。インジケーターの値の小数点以下の桁数は、IndicatorSetInteger関数を使ってチャートの価格フォーマットに同期させます。最後に、iMAおよびiATR関数を使用してインジケーターハンドルを作成します。どちらかのハンドル作成に失敗した場合は、Print関数でエラーメッセージを出力し、INIT_FAILEDを返して処理を終了します。すべて正常に初期化された場合は、INIT_SUCCEEDEDを返して初期化プロセスを完了します。これで、インジケーター計算をおこなうメインのイベントハンドラに進む準備が整いました。
//+------------------------------------------------------------------+
//| Custom indicator iteration function                              |
//+------------------------------------------------------------------+
int OnCalculate(const int rates_total,             // Total number of bars in the price series
                const int prev_calculated,        // Number of previously calculated bars
                const datetime &time[],           // Array of time values for each bar
                const double &open[],             // Array of open prices for each bar
                const double &high[],             // Array of high prices for each bar
                const double &low[],              // Array of low prices for each bar
                const double &close[],            // Array of close prices for each bar
                const long &tick_volume[],        // Array of tick volumes for each bar
                const long &volume[],             // Array of trade volumes for each bar
                const int &spread[])              // Array of spreads for each bar
{
   //--- Check if this is the first time the indicator is being calculated
   if(prev_calculated == 0) // If no previous bars were calculated, it means this is the first calculation
     {
      //--- Initialize indicator buffers (upper, middle, and lower) with zeros
      ArrayFill(upperChannelBuffer, 0, rates_total, 0);   // Fill the entire upper channel buffer with 0s
      ArrayFill(movingAverageBuffer, 0, rates_total, 0);  // Fill the moving average buffer with 0s
      ArrayFill(lowerChannelBuffer, 0, rates_total, 0);   // Fill the lower channel buffer with 0s

      //--- Copy Exponential Moving Average (EMA) values into the moving average buffer
      // This function requests 'rates_total' values from the MA indicator (maHandle) and copies them into movingAverageBuffer
      if(CopyBuffer(maHandle, 0, 0, rates_total, movingAverageBuffer) < 0)
         return(0); // If unable to copy data, stop execution and return 0

      //--- Copy Average True Range (ATR) values into a temporary array called atrValues
      double atrValues[];
      if(CopyBuffer(atrHandle, 0, 0, rates_total, atrValues) < 0)
         return(0); // If unable to copy ATR data, stop execution and return 0

      //--- Define the starting bar for calculations
      // We need to make sure we have enough data to calculate both the MA and ATR, so we start after the longest required period.
      int startBar = MathMax(maPeriod, atrPeriod) + 1; // Ensure sufficient bars for both EMA and ATR calculations

      //--- Loop from startBar to the total number of bars (rates_total)
      for(int i = startBar; i < rates_total; i++)
        {
         // Calculate the upper and lower channel boundaries for each bar
         upperChannelBuffer[i] = movingAverageBuffer[i] + atrMultiplier * atrValues[i]; // Upper channel = EMA + ATR * Multiplier
         lowerChannelBuffer[i] = movingAverageBuffer[i] - atrMultiplier * atrValues[i]; // Lower channel = EMA - ATR * Multiplier
        }

      //--- Calculation is complete, so we return the total number of rates (bars) calculated
      return(rates_total);
     }
}
こちらでは、OnCalculateイベントハンドラ内にケルトナーチャネルインジケーターのコア計算ロジックを実装しています。この関数は価格データを順に処理し、インジケーターバッファを計算・更新します。まず、prev_calculatedを評価して最初の計算かどうかを確認します。もし「0」であれば、ArrayFill関数を使って「上限チャネル」「中央の移動平均(MA)」「下限チャネル」バッファを初期化し、すべての値をゼロに設定します。次に、CopyBuffer関数でmovingAverageBufferにMAの値をコピーします。コピーに失敗した場合は処理を停止し、0を返します。同様に、ATRの値を一時的な配列「atrValues」に取得します。
MAとATRの両方のデータが十分に揃っていることを保証するために、MathMax関数を使ってインジケーター期間の最大値を求め、現在の未完了バーを除外するために1バー加えた「startBar」から計算を開始します。次に、forループでstartBarからrates_totalまで各バーを順に処理し、以下の式で「上限チャネル」と「下限チャネル」の境界値を計算します。
- UpperChannel = Moving Average + (ATR * Multiplier)
- LowerChannel = Moving Average - (ATR * Multiplier)
最後に計算済みバー数「rates_total」を返します。初回計算でなければ、単に直近バーの値を再計算で更新します。
//--- If this is NOT the first calculation, update only the most recent bars
// This prevents re-calculating all bars, which improves performance
int startBar = prev_calculated - 2; // Start 2 bars back to ensure smooth updating

//--- Loop through the last few bars that need to be updated
for(int i = startBar; i < rates_total; i++)
  {
   //--- Calculate reverse index to access recent bars from the end
   int reverseIndex = rates_total - i; // Reverse indexing ensures we are looking at the most recent bars first

   //--- Copy the latest Exponential Moving Average (EMA) value for this specific bar
   double emaValue[];
   if(CopyBuffer(maHandle, 0, reverseIndex, 1, emaValue) < 0)
      return(prev_calculated); // If unable to copy, return the previous calculated value to avoid recalculation

   //--- Copy the latest Average True Range (ATR) value for this specific bar
   double atrValue[];
   if(CopyBuffer(atrHandle, 0, reverseIndex, 1, atrValue) < 0)
      return(prev_calculated); // If unable to copy, return the previous calculated value to avoid recalculation

   //--- Update the indicator buffers with new values for the current bar
   movingAverageBuffer[i] = emaValue[0]; // Update the moving average buffer for this bar
   upperChannelBuffer[i] = emaValue[0] + atrMultiplier * atrValue[0]; // Calculate the upper channel boundary
   lowerChannelBuffer[i] = emaValue[0] - atrMultiplier * atrValue[0]; // Calculate the lower channel boundary
  }

//--- Return the total number of calculated rates (bars)
return(rates_total); // This informs MQL5 that all rates up to 'rates_total' have been successfully calculated
ここでは、すべてのティックでインジケーター全体を再計算するのではなく、直近のバーのみを更新することでパフォーマンスを最適化しています。これが初回計算でない場合、startBarを「prev_calculated - 2」と定義することで、直近数本のバーのみを更新し、計算の連続性を維持しつつ不要な処理を削減します。過去のバーのデータはすでにチャート上に存在しているため、これにより無駄な計算を避けることができます。
次に、forループを使ってstartBarからrates_totalまでのバーを繰り返し処理します。直近のバーを優先して処理するために、「reverseIndex = rates_total - i」を計算し、最新のデータから取得できるようにします。各バーに対して、CopyBuffer関数を使って直近の移動平均値を「emaValue」にコピーします。データの取得に失敗した場合は、余計な計算を避けるたっめprev_calculatedを返します。ATRの値についても同様に処理し、atrValueに格納します。データを取得できたら、以下のように各バッファを更新します。
- movingAverageBuffer[i] = emaValue[0];:中央のラインにEMAを設定します。
- upperChannelBuffer[i] = emaValue[0] + atrMultiplier * atrValue[0];:上限を計算します。
- lowerChannelBuffer[i] = emaValue[0] - atrMultiplier * atrValue[0];:下限値を計算します。
最後に、rates_totalを返すことで、必要なバーすべての処理が完了したことを示します。プログラムを実行すると、次のような出力が得られます。
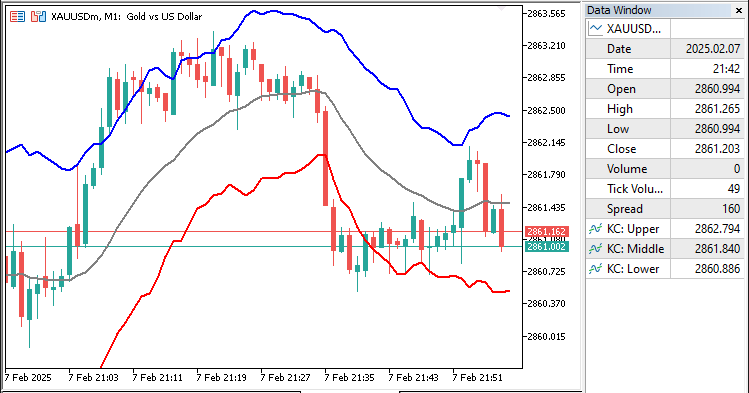
画像からわかるように、インジケーターのラインはチャート上に正しくマッピングされています。残る作業はチャネルの描画ですが、これにはキャンバス機能が必要になります。この処理は次のセクションで扱います。
カスタムキャンバスグラフィックの統合
チャネルをグラフィカルに描画するためにキャンバス機能を統合するには、必要なキャンバスクラスファイルをインクルードし、すでに存在する組み込みの構造を活用できるようにします。これを実現するための基本的なロジックは以下のとおりです。
#include <Canvas/Canvas.mqh>
CCanvas obj_Canvas;
#includeキーワードを使用してCanvas.mqhライブラリをインクルードすることで、チャート上でのグラフィック描画機能を利用できるようになります。このライブラリを使うことで、インジケーターのビジュアルや注釈などのカスタム要素をチャートウィンドウに直接描画できるようになります。次に、CCanvasクラスのインスタンスとしてobj_Canvasを宣言します。このオブジェクトはキャンバスと対話するために使用され、グラフィカル要素の作成・変更・管理を動的におこなうことができます。CCanvasクラスには、図形、線、テキストの描画などを行うための多くのメソッドが用意されており、インジケーターの視覚的表現を大幅に強化することができます。動的な図形をチャート上に正しく描画するためには、スケールなどのチャートプロパティが必要です。これをグローバルスコープで実行します。
int chart_width         = (int)ChartGetInteger(0, CHART_WIDTH_IN_PIXELS);
int chart_height        = (int)ChartGetInteger(0, CHART_HEIGHT_IN_PIXELS);
int chart_scale         = (int)ChartGetInteger(0, CHART_SCALE);
int chart_first_vis_bar = (int)ChartGetInteger(0, CHART_FIRST_VISIBLE_BAR);
int chart_vis_bars      = (int)ChartGetInteger(0, CHART_VISIBLE_BARS);
double chart_prcmin     = ChartGetDouble(0, CHART_PRICE_MIN, 0);
double chart_prcmax     = ChartGetDouble(0, CHART_PRICE_MAX, 0);
ChartGetInteger関数やChartGetDouble関数を使って、現在のチャートウィンドウに関するさまざまなプロパティを取得し、後の計算やグラフィカル要素の配置に利用します。まず、ChartGetIntegerにCHART_WIDTH_IN_PIXELSパラメータを指定してチャートの幅(ピクセル単位)を取得し、chart_width 変数に格納します。同様に、CHART_HEIGHT_IN_PIXELSパラメータを使ってチャートの高さを取得し、chart_height に格納します。
次に、チャートのズームレベルを表すCHART_SCALEパラメータを使用してスケールを取得し、chart_scaleに格納します。続いて、表示中の最初のバーのインデックスを取得するためにCHART_FIRST_VISIBLE_BARを使用し、chart_first_vis_barに格納します。表示されているバーの本数を取得するには、CHART_VISIBLE_BARSを使用し、その値を chart_vis_barsに格納します。これらの値はすべて整数に型キャストして扱います。
最後に、ChartGetDouble関数を使用して、チャート上で現在表示されている価格の最小値と最大値をそれぞれ CHART_PRICE_MINとCHART_PRICE_MAXから取得し、変数「chart_prcmin」および「chart_prcmax」に格納します。これらの価格帯の情報を元に、初期化時にビットマップラベルをチャート上に作成し、描画エリアの準備をおこないます。
// Create a obj_Canvas bitmap label for custom graphics on the chart
obj_Canvas.CreateBitmapLabel(0, 0, short_name, 0, 0, chart_width, chart_height, COLOR_FORMAT_ARGB_NORMALIZE);
ここでは、obj_Canvas.CreateBitmapLabel関数を使用して、チャート上にカスタムのビットマップラベルを作成します。この関数は、位置指定(0, 0)、内容(short_name)、サイズ(0, 0:自動サイズ)、およびチャートの幅と高さ(chart_width, chart_height)などのパラメータを受け取ります。色の形式はCOLOR_FORMAT_ARGB_NORMALIZEに設定されており、透明度や色のカスタマイズを可能にします。このラベルを使用することで、図形を描画できるようになります。ただし、描画には、チャート上の座標やローソク足の位置を価格やバーインデックスに変換する補助関数が必要です。
//+------------------------------------------------------------------+
//| Converts the chart scale property to bar width/spacing           |
//+------------------------------------------------------------------+
int GetBarWidth(int chartScale)
{
   // The width of each bar in pixels is determined using 2^chartScale.
   // This calculation is based on the MQL5 chart scale property, where larger chartScale values mean wider bars.
   return (int)pow(2, chartScale); // Example: chartScale = 3 -> bar width = 2^3 = 8 pixels
}
//+------------------------------------------------------------------+
//| Converts the bar index (as series) to x-coordinate in pixels     |
//+------------------------------------------------------------------+
int GetXCoordinateFromBarIndex(int barIndex)
{
   // The chart starts from the first visible bar, and each bar has a fixed width.
   // To calculate the x-coordinate, we calculate the distance from the first visible bar to the given barIndex.
   // Each bar is shifted by 'bar width' pixels, and we subtract 1 to account for pixel alignment.
   return (chart_first_vis_bar - barIndex) * GetBarWidth(chart_scale) - 1;
}
//+------------------------------------------------------------------+
//| Converts the price to y-coordinate in pixels                     |
//+------------------------------------------------------------------+
int GetYCoordinateFromPrice(double price)
{
   // To avoid division by zero, we check if chart_prcmax equals chart_prcmin.
   // If so, it means that all prices on the chart are the same, so we avoid dividing by zero.
   if(chart_prcmax - chart_prcmin == 0.0)
      return 0; // Return 0 to avoid undefined behavior

   // Calculate the relative position of the price in relation to the minimum and maximum price on the chart.
   // We then convert this to pixel coordinates based on the total height of the chart.
   return (int)round(chart_height * (chart_prcmax - price) / (chart_prcmax - chart_prcmin) - 1);
}
//+------------------------------------------------------------------+
//| Converts x-coordinate in pixels to bar index (as series)         |
//+------------------------------------------------------------------+
int GetBarIndexFromXCoordinate(int xCoordinate)
{
   // Get the width of one bar in pixels
   int barWidth = GetBarWidth(chart_scale);

   // Check to avoid division by zero in case barWidth somehow equals 0
   if(barWidth == 0)
      return 0; // Return 0 to prevent errors

   // Calculate the bar index using the x-coordinate position
   // This determines how many bar widths fit into the x-coordinate and converts it to a bar index
   return chart_first_vis_bar - (xCoordinate + barWidth / 2) / barWidth;
}
//+------------------------------------------------------------------+
//| Converts y-coordinate in pixels to price                         |
//+------------------------------------------------------------------+
double GetPriceFromYCoordinate(int yCoordinate)
{
   // If the chart height is 0, division by zero would occur, so we avoid it.
   if(chart_height == 0)
      return 0; // Return 0 to prevent errors

   // Calculate the price corresponding to the y-coordinate
   // The y-coordinate is converted relative to the total height of the chart
   return chart_prcmax - yCoordinate * (chart_prcmax - chart_prcmin) / chart_height;
}
チャートデータとピクセルベースの座標を相互に変換するための関数を作成します。まず、GetBarWidth関数では、チャートのスケールを使用し、「2のチャートスケール乗」という式を用いて、各バーの幅をピクセル単位で計算します。これは、チャートのスケールに応じてバーの幅を調整するために必要です。計算にはpow関数を使い、2のチャートスケール乗を求めます。
次に、GetXCoordinateFromBarIndex関数では、バーのインデックスをピクセル単位の X 座標に変換します。これは、最初に表示されているバーとの距離を求め、その距離にバーの幅を掛けてピクセル座標に換算します。最後に、ピクセルの整列誤差を調整するために1を減算します。Y 座標については、GetYCoordinateFromPrice関数で、価格がチャート内でどの位置にあるかを計算します。chart_prcmin(最小価格)と chart_prcmax(最大価格)の間で、指定された価格の相対的な位置を求め、それをチャートの高さにスケーリングします。価格範囲がゼロの場合、ゼロ除算を防ぐ処理も含まれています。
同様に、GetBarIndexFromXCoordinate関数では、X座標をバーインデックスに変換します。これは、指定された X座標に何本分のバー幅が含まれるかを計算することで実現されます。この処理により、画面上の特定位置がどのバーに相当するかを特定できます。最後に、GetPriceFromYCoordinate関数では、Y座標を価格に変換します。チャートの価格範囲に対するY座標の相対的な位置から実際の価格を算出します。ここでも、チャートの高さがゼロの場合のゼロ除算を防止します。
これらの関数を活用することで、チャート上のピクセル座標と価格・バーインデックスとの間の変換が可能になり、カスタムグラフィックスを価格やローソク足の位置に正確に合わせて描画できます。この仕組みにより、チャネルの2本のライン間に図形を描くための共通関数を作成できるようになります。
//+------------------------------------------------------------------+
//| Fill the area between two indicator lines                        |
//+------------------------------------------------------------------+
void DrawFilledArea(double &upperSeries[], double &lowerSeries[], color upperColor, color lowerColor, uchar transparency = 255, int shift = 0)
{
   int startBar  = chart_first_vis_bar;      // The first bar that is visible on the chart
   int totalBars = chart_vis_bars + shift;   // The total number of visible bars plus the shift
   uint upperARGB = ColorToARGB(upperColor, transparency); // Convert the color to ARGB with transparency
   uint lowerARGB = ColorToARGB(lowerColor, transparency); // Convert the color to ARGB with transparency
   int seriesLimit = fmin(ArraySize(upperSeries), ArraySize(lowerSeries)); // Ensure series limits do not exceed array size
   int prevX = 0, prevYUpper = 0, prevYLower = 0; // Variables to store the previous bar's x, upper y, and lower y coordinates

   for(int i = 0; i < totalBars; i++)
     {
      int barPosition = startBar - i;             // Current bar position relative to start bar
      int shiftedBarPosition = startBar - i + shift; // Apply the shift to the bar position
      int barIndex = seriesLimit - 1 - shiftedBarPosition; // Calculate the series index for the bar

      // Ensure the bar index is within the valid range of the array
      if(barIndex < 0 || barIndex >= seriesLimit || barIndex - 1 < 0)
         continue; // Skip this bar if the index is out of bounds

      // Check if the series contains valid data (not EMPTY_VALUE)
      if(upperSeries[barIndex] == EMPTY_VALUE || lowerSeries[barIndex] == EMPTY_VALUE || shiftedBarPosition >= seriesLimit)
         continue; // Skip this bar if the values are invalid or if the position exceeds the series limit

      int xCoordinate  = GetXCoordinateFromBarIndex(barPosition); // Calculate x-coordinate of this bar
      int yUpper = GetYCoordinateFromPrice(upperSeries[barIndex]); // Calculate y-coordinate for upper line
      int yLower = GetYCoordinateFromPrice(lowerSeries[barIndex]); // Calculate y-coordinate for lower line
      uint currentARGB = upperSeries[barIndex] < lowerSeries[barIndex] ? lowerARGB : upperARGB; // Determine fill color based on which line is higher

      // If previous values are valid, draw triangles between the previous bar and the current bar
      if(i > 0 && upperSeries[barIndex - 1] != EMPTY_VALUE && lowerSeries[barIndex - 1] != EMPTY_VALUE)
        {
         if(prevYUpper != prevYLower) // Draw first triangle between the upper and lower parts of the two consecutive bars
            obj_Canvas.FillTriangle(prevX, prevYUpper, prevX, prevYLower, xCoordinate, yUpper, currentARGB);
         if(yUpper != yLower) // Draw the second triangle to complete the fill area
            obj_Canvas.FillTriangle(prevX, prevYLower, xCoordinate, yUpper, xCoordinate, yLower, currentARGB);
        }

      prevX  = xCoordinate; // Store the x-coordinate for the next iteration
      prevYUpper = yUpper;  // Store the y-coordinate of the upper series
      prevYLower = yLower;  // Store the y-coordinate of the lower series
     }
}
void関数「DrawFilledArea」を定義し、チャート上で2本のインジケーターラインの間を塗りつぶす機能を実装します。最初に、チャート上に表示されているバーを定義し、必要に応じてshiftパラメータを使って開始位置を調整します。次に、塗りつぶしに使う色(upperColorとlowerColor)を透明度を含む ARGB 形式に変換するためにColorToARGB関数を使用します。その後、fmin関数を使って処理可能なデータ範囲の上限を決定し、upperSeriesとlowerSeriesの配列サイズを超えないように制限します。また、上限ラインと下限ラインの前回のバーの座標を保持する変数を初期化し、塗りつぶしに使います。
次に、表示バーの範囲をループ処理し、GetXCoordinateFromBarIndex関数を用いて各バーのx座標を計算します。上限ラインと下限ラインのy座標は、それぞれupperSeriesとlowerSeriesの値をもとにGetYCoordinateFromPrice関数で取得します。その後、上下どちらのラインが高いかを判定し、使用する塗りつぶし色を選択します。
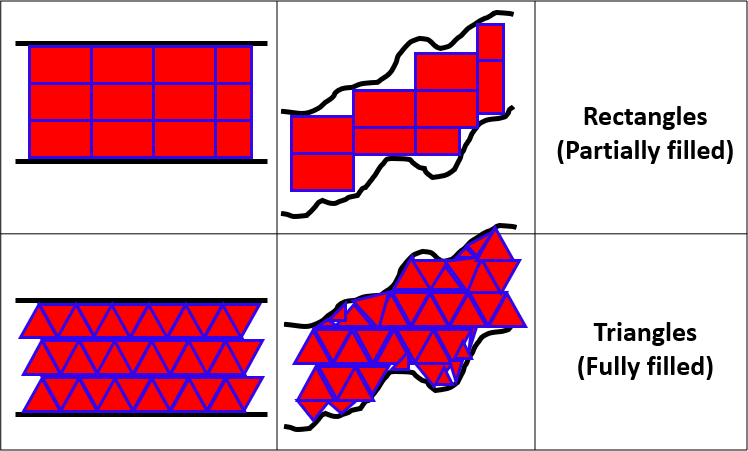
前回のバーに有効なデータがある場合、obj_Canvas.FillTriangle関数を使用して2本のライン間を塗りつぶします。各バーのペアに対しては、2つの三角形を描画して面を構成します。1つ目の三角形は、上限ラインと下限ラインを結ぶもので、2つ目の三角形は、その次のポイントと組み合わせて塗りつぶし領域を完成させます。三角形は、先ほど決定した色で描画されます。三角形を使うのは、ライン同士が格子状に正確に揃っていない場合でも、点と点を正確に結び、自然な形状で描画できるからです。これは、四角形よりもスムーズな塗りと描画効率の向上につながります。以下はそのイメージ図です。
最後に、次の反復処理に備えて前回のx座標およびy座標を更新し、表示されている各バー間でライン同士の間が途切れることなく連続して塗りつぶされるようにします。この関数が完成したことで、今後は必要な数のチャネルをチャート上に描画できるようになります。要求に応じたそれぞれのチャネルには、指定されたカラーで表示されます。
//+------------------------------------------------------------------+
//| Custom indicator redraw function                                 |
//+------------------------------------------------------------------+
void RedrawChart(void)
{
   uint defaultColor = 0; // Default color used to clear the canvas
   color colorUp = (color)PlotIndexGetInteger(0, PLOT_LINE_COLOR, 0); // Color of the upper indicator line
   color colorMid = (color)PlotIndexGetInteger(1, PLOT_LINE_COLOR, 0); // Color of the mid indicator line
   color colorDown = (color)PlotIndexGetInteger(2, PLOT_LINE_COLOR, 0); // Color of the lower indicator line

   //--- Clear the canvas by filling it with the default color
   obj_Canvas.Erase(defaultColor);

   //--- Draw the area between the upper channel and the moving average
   // This fills the area between the upper channel (upperChannelBuffer) and the moving average (movingAverageBuffer)
   DrawFilledArea(upperChannelBuffer, movingAverageBuffer, colorUp, colorMid, 128, 1);

   //--- Draw the area between the moving average and the lower channel
   // This fills the area between the moving average (movingAverageBuffer) and the lower channel (lowerChannelBuffer)
   DrawFilledArea(movingAverageBuffer, lowerChannelBuffer, colorDown, colorMid, 128, 1);

   //--- Update the canvas to reflect the new drawing
   obj_Canvas.Update();
}
RedrawChart 関数を宣言し、まずデフォルトのカラーを定義したあと、インジケーターのプロパティから上限チャネル、中央の移動平均線、および下限チャネルのラインカラーを取得します。次に、キャンバスをデフォルトカラーでクリアし、DrawFilledArea関数を使って、上限チャネルと移動平均線の間、そして移動平均線と下限チャネルの間の領域をそれぞれのカラーで塗りつぶします。最後に、Update を呼び出してキャンバスを更新し、塗りつぶしを反映させた新しいチャートが描画されるようにします。この関数はOnCalculateイベントハンドラ内で呼び出すことで、チャート描画をおこなえるようになります。
RedrawChart(); // This function clears and re-draws the filled areas between the indicator lines
インジケーターチャネルオブジェクトを使用しているため、インジケーターを削除する際には、そのオブジェクトも削除する必要があります。
//+------------------------------------------------------------------+
//| Custom indicator deinitialization function                       |
//+------------------------------------------------------------------+
void OnDeinit(const int reason){
   obj_Canvas.Destroy();
   ChartRedraw();
}
OnDeinitイベントハンドラ内では、インジケーターが削除された際にチャート上のカスタム描画オブジェクトをクリーンアップして取り除くために、obj_Canvas.Destroyメソッドを使用します。最後に、ChartRedraw関数を呼び出してチャートを更新・再描画し、カスタムグラフィックスが画面から正しく消去されるようにします。プログラムを実行すると、次のような結果が得られます。
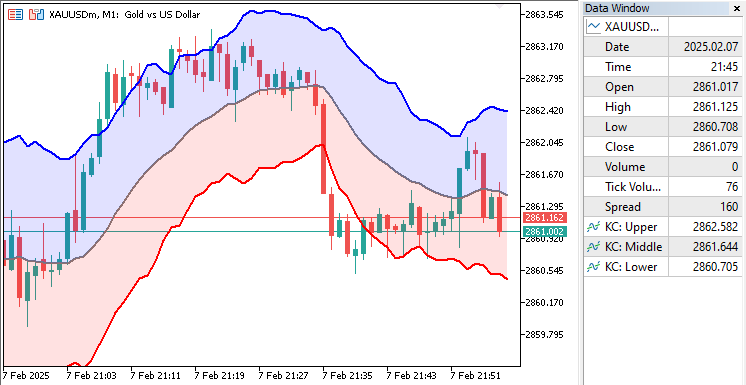
視覚化から、キャンバスグラフィックスを用いた高度なケルトナーチャネルインジケーターの作成という目的が達成されたことが分かります。次に、このインジケーターが正しく機能しているかを確認するために、バックテストをおこなう必要があります。それについては、次のセクションで説明します。
ケルトナーチャネルインジケーターのバックテスト
バックテスト中に確認されたこととして、チャートのサイズが変更された際に、チャネルの描画がフリーズし、最新のチャート座標に更新されない現象が見られました。以下にその例を示します。
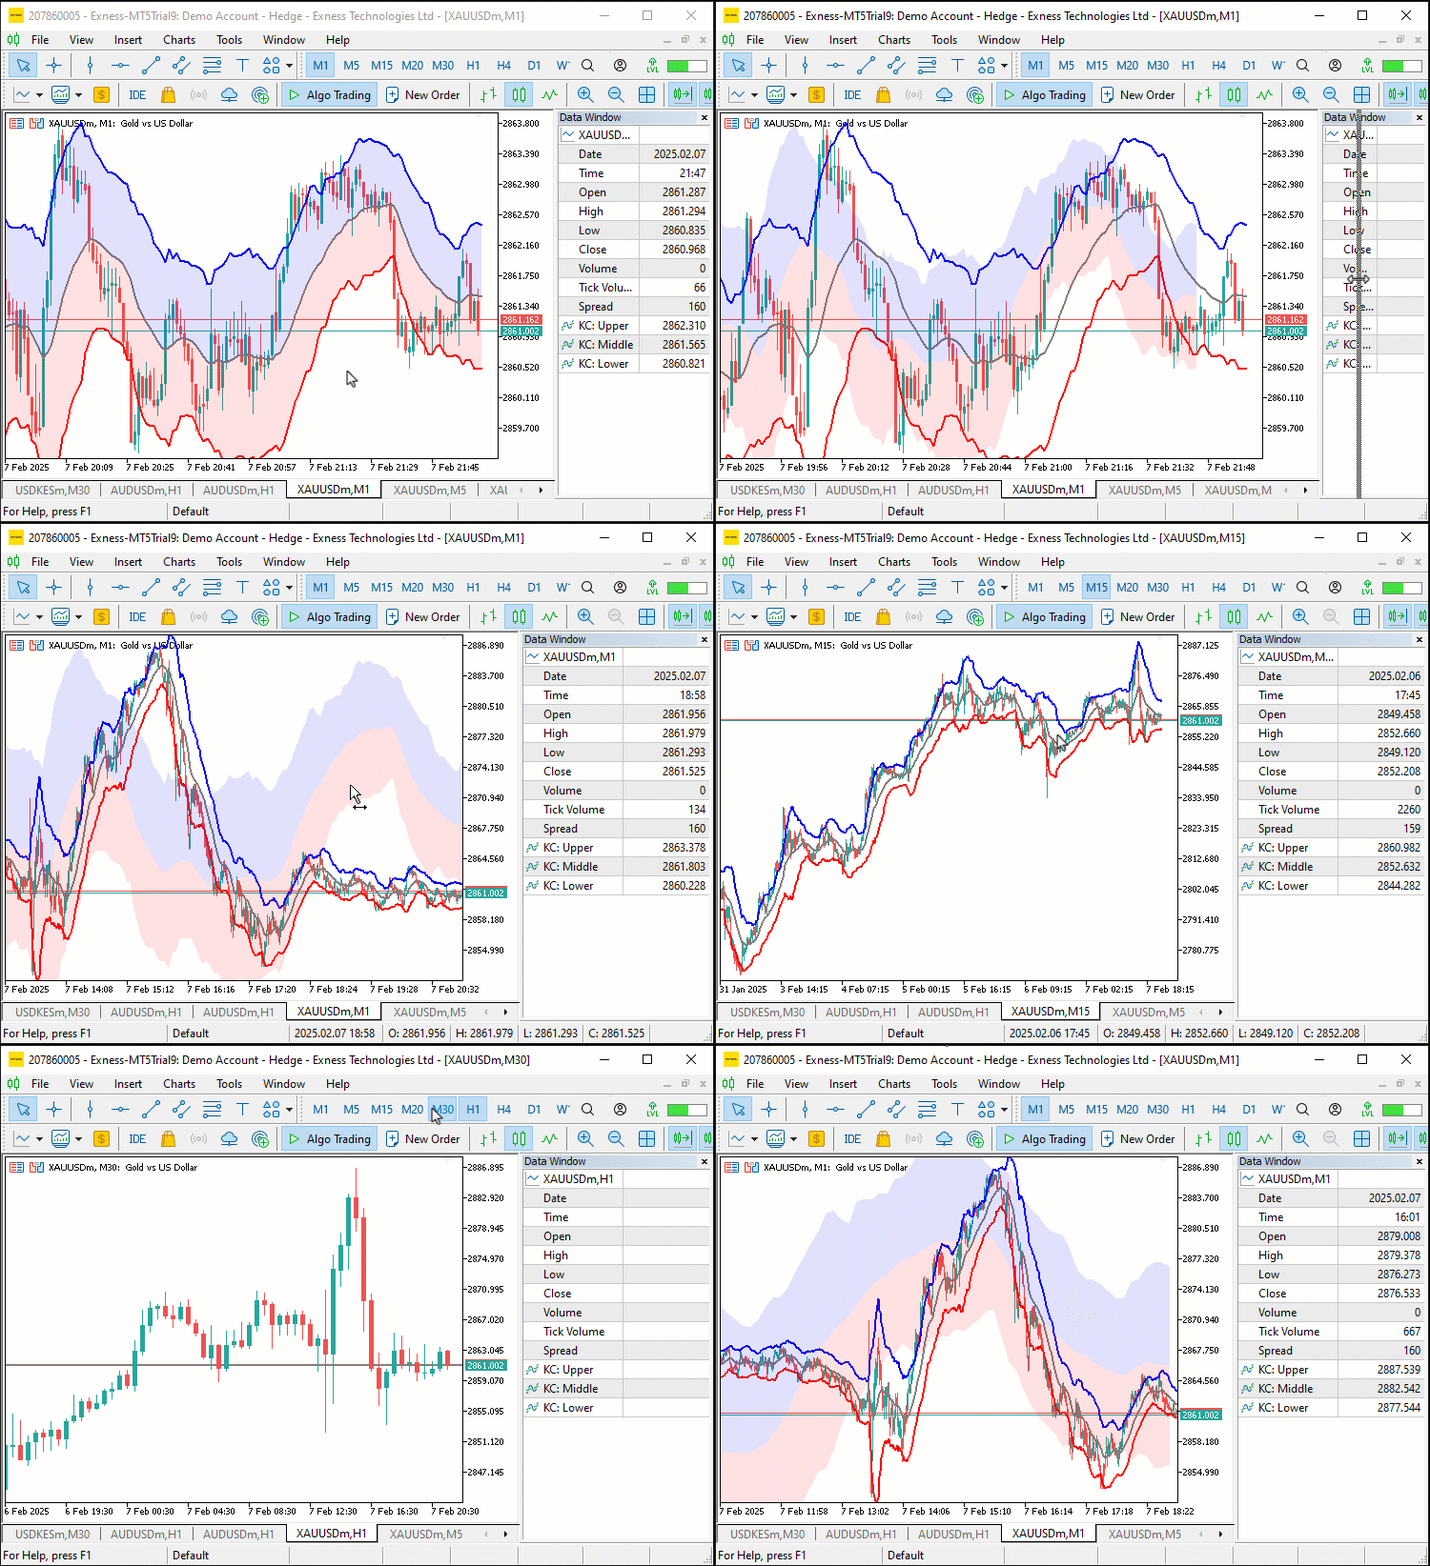
これを解決するために、OnChartEventイベントハンドラで更新するロジックを実装しました。
//+------------------------------------------------------------------+
//| Custom indicator chart event handler function                    |
//+------------------------------------------------------------------+
void OnChartEvent(const int id, const long& lparam, const double& dparam, const string& sparam){
   if(id != CHARTEVENT_CHART_CHANGE)
      return;
   chart_width          = (int)ChartGetInteger(0, CHART_WIDTH_IN_PIXELS);
   chart_height         = (int)ChartGetInteger(0, CHART_HEIGHT_IN_PIXELS);
   chart_scale          = (int)ChartGetInteger(0, CHART_SCALE);
   chart_first_vis_bar  = (int)ChartGetInteger(0, CHART_FIRST_VISIBLE_BAR);
   chart_vis_bars       = (int)ChartGetInteger(0, CHART_VISIBLE_BARS);
   chart_prcmin         = ChartGetDouble(0, CHART_PRICE_MIN, 0);
   chart_prcmax         = ChartGetDouble(0, CHART_PRICE_MAX, 0);
   if(chart_width != obj_Canvas.Width() || chart_height != obj_Canvas.Height())
      obj_Canvas.Resize(chart_width, chart_height);
//---
   RedrawChart();
}
ここでは、OnChartEvent関数を使用してCHARTEVENT_CHART_CHANGEイベントを監視します。これは、チャートのサイズが変更された(たとえばウィンドウのサイズ変更など)ときに発生します。まず、CHART_WIDTH_IN_PIXELSなどを使用して、更新されたチャートのプロパティ(幅や高さなど)を取得します。次に、obj_Canvas.Widthおよびobj_Canvas.Heightを使って、現在のキャンバスサイズと新しいチャートサイズが異なるかどうかを確認します。サイズが異なる場合は、obj_Canvas.Resizeを使ってキャンバスを新しいサイズに合わせてリサイズします。最後に、RedrawChart関数を呼び出してチャートを再描画し、新しいサイズに応じてすべてのビジュアル要素が正しく表示されるようにします。以下がその結果です。
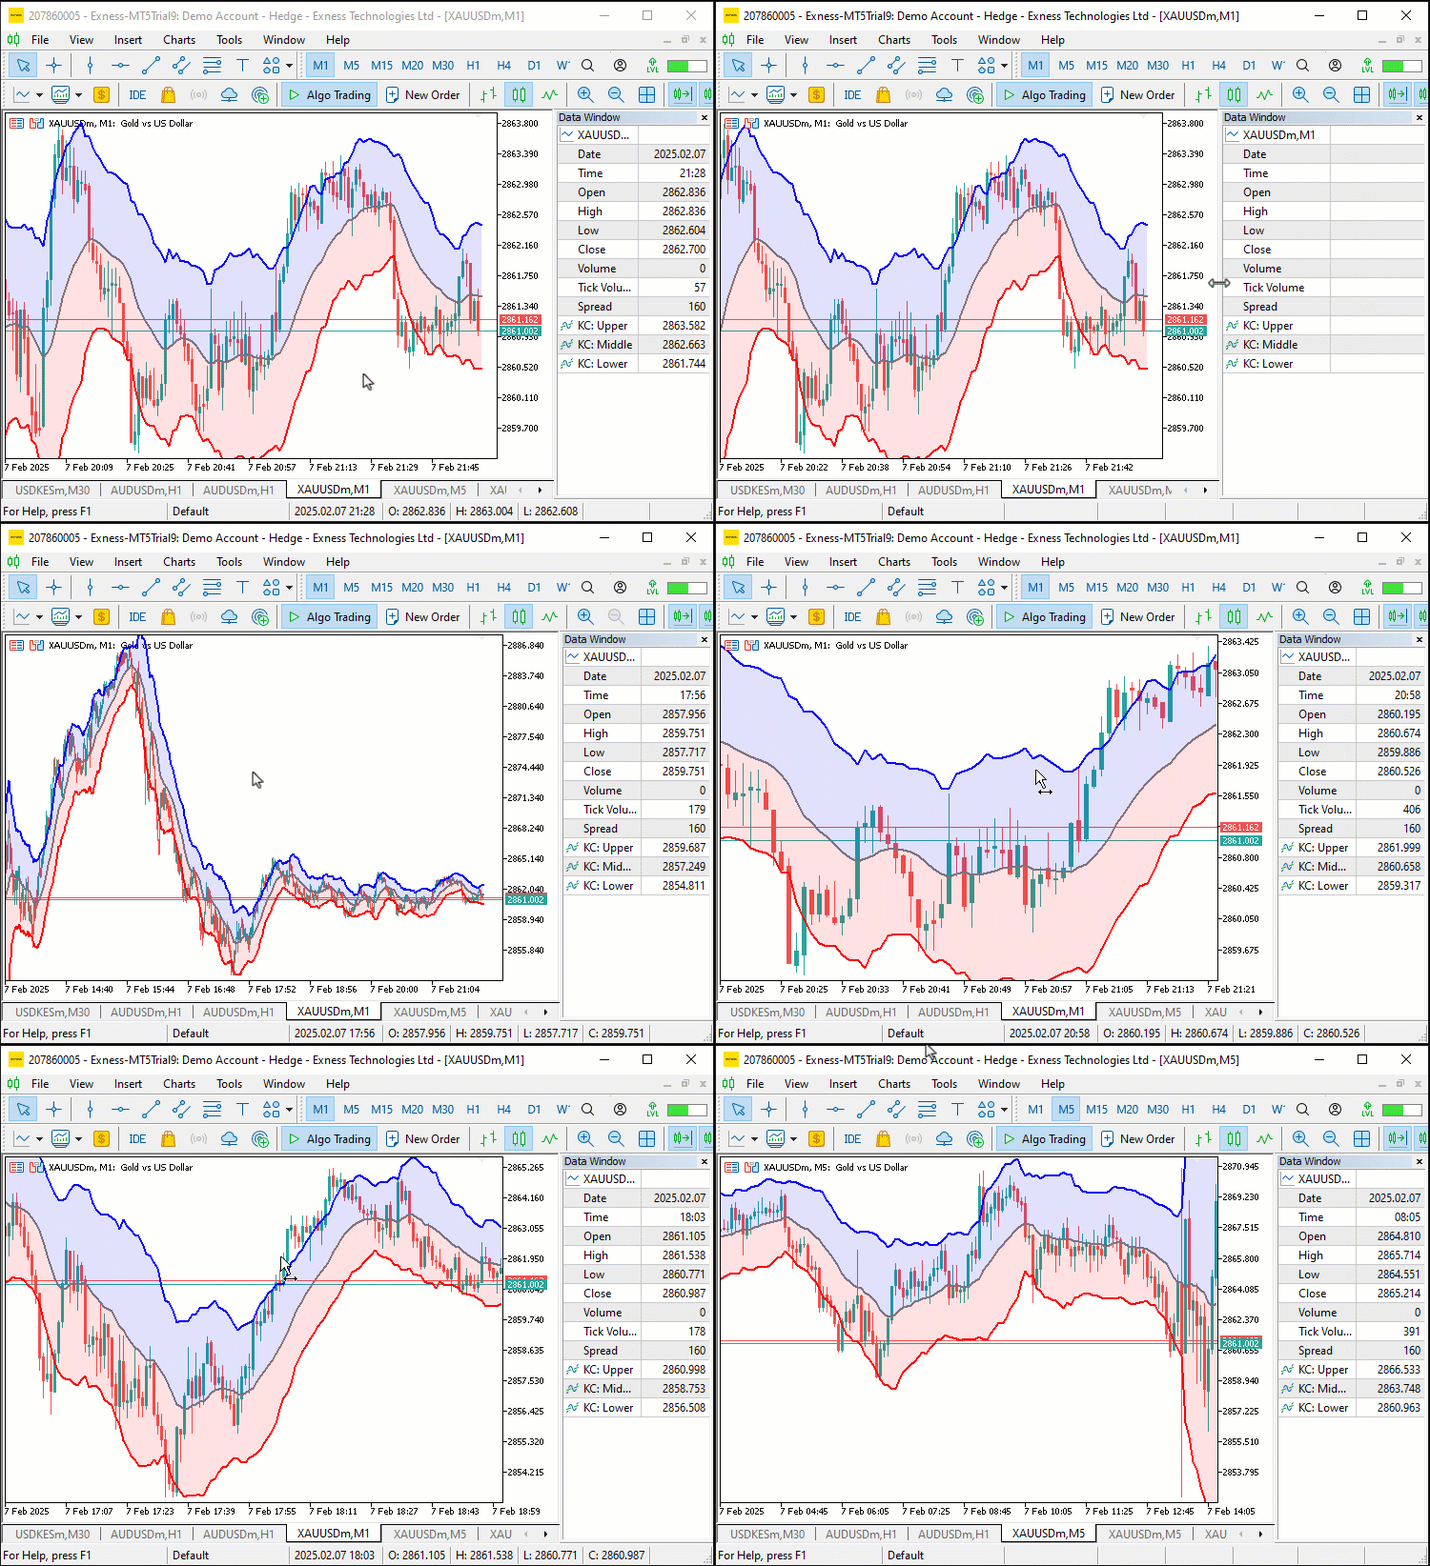
視覚化からわかるように、チャートのサイズを変更すると描画が動的に更新され、目的どおりの動作が実現できていることが確認できます。
結論
本記事では、移動平均と ATRを活用して、MQL5でカスタムチャネルインジケーターを構築する方法を解説しました。チャネルの計算と表示方法、チャート上での塗りつぶし描画の仕組みに加えて、チャートサイズ変更時の動作改善やバックテスト時のパフォーマンス最適化にも対応しました。その結果、トレーダーにとって効率的かつ正確なインジケーターとして利用できる形を実現しました。
MetaQuotes Ltdにより英語から翻訳されました。
元の記事: https://www.mql5.com/en/articles/17155
警告: これらの資料についてのすべての権利はMetaQuotes Ltd.が保有しています。これらの資料の全部または一部の複製や再プリントは禁じられています。
この記事はサイトのユーザーによって執筆されたものであり、著者の個人的な見解を反映しています。MetaQuotes Ltdは、提示された情報の正確性や、記載されているソリューション、戦略、または推奨事項の使用によって生じたいかなる結果についても責任を負いません。
 MQL5で取引管理者パネルを作成する(第9回):コード編成(I)モジュール化
 知っておくべきMQL5ウィザードのテクニック(第54回):SACとテンソルのハイブリッドによる強化学習
 プライスアクション分析ツールキットの開発(第13回):RSIセンチネルツール
 JSONをマスターする:MQL5で独自のJSONリーダーをゼロから作成する
- 無料取引アプリ
- 8千を超えるシグナルをコピー
- 金融ニュースで金融マーケットを探索