MQL5取引ツール(第5回):リアルタイム銘柄監視のためのローリングティッカーテープの作成

はじめに
前回の記事(第4回)では、MetaQuotes Language 5 (MQL5)を用いて多時間軸スキャナーダッシュボードを改善し、動的配置や表示の切り替え機能を追加しました。これにより、移動および最小化が可能な表示を実現し、操作性を向上させました。第5回では、複数の通貨ペアをリアルタイムで監視するローリングティッカーテープを作成します。スクロールするbid価格、スプレッド、日次変化率に加え、視覚的要素をカスタマイズできるようにすることで、トレーダーが一目で市場状況を把握できるようにします。本記事では以下のトピックを扱います。
この記事を読み終える頃には、カスタマイズや取引環境への統合が可能な汎用的なMQL5ティッカーツールを作成できるようになります。それでは始めましょう。
ローリングティッカーテープアーキテクチャの理解
私たちが作成しているローリングティッカーテープは、複数の通貨ペアのリアルタイムデータをスクロール形式で表示するツールです。Bid価格、スプレッド、日次変化率を表示することで、トレーダーが一目で市場状況を把握できるようにします。この機能は重要で、コンパクトかつ動的に市場の動きを確認でき、チャートを圧迫せずに価格トレンドやボラティリティを強調できるため、スピードが求められる取引における迅速な意思決定に役立ちます。
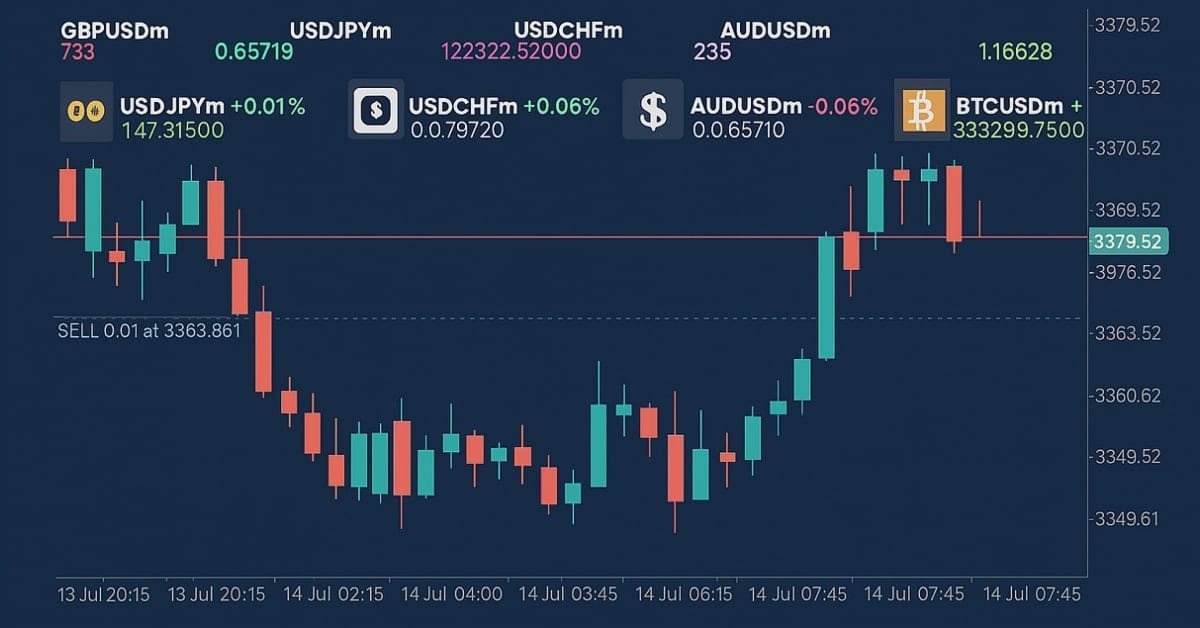
これを実現するには、表示を「通貨ペア」「価格」「スプレッド」「変化率」の各スクロールラインに分け、上昇・下降を示す色やスクロール速度をカスタマイズできるようにします。通貨ペアのデータには配列を使用し、スムーズなスクロールのためにタイマーを活用します。これにより、ユーザーの設定に応じてティッカーが効率的に背景で動作するようになります。次に、実際の実装手順を見ていきましょう。要するに、下に示すのは私たちが目指す可視化のイメージです。

MQL5での実装
MQL5でプログラムを作成するには、まずプログラムのメタデータを定義し、その後、プログラムの動作をコードに直接触れることなく簡単に変更できるように、いくつかの入力パラメータを定義する必要があります。
//+------------------------------------------------------------------+
//|                                      ROLLING TICKER TIMER EA.mq5 |
//|                           Copyright 2025, Allan Munene Mutiiria. |
//|                                   https://t.me/Forex_Algo_Trader |
//+------------------------------------------------------------------+
#property copyright "Copyright 2025, Allan Munene Mutiiria."
#property link      "https://t.me/Forex_Algo_Trader"
#property version   "1.00"

#include <Arrays\ArrayString.mqh> //--- Include ArrayString library for string array operations

//--- Input parameters
input string Symbols = "EURUSDm,GBPUSDm,USDJPYm,USDCHFm,AUDUSDm,BTCUSDm,TSLAm"; // Symbols to display
input int UpdateInterval = 50;                     // Update interval (milliseconds)
input int SymbolFontSize = 10;                     // Symbol font size (first line)
input string SymbolFont = "Arial Bold";            // Symbol font
input int AskFontSize = 10;                        // Ask font size (second line)
input string AskFont = "Arial";                    // Ask font
input int SpreadFontSize = 10;                     // Spread font size (third line)
input string SpreadFont = "Calibri";               // Spread font
input int SectionFontSize = 10;                    // Section currency, bid, and percent change font size
input string SectionFont = "Arial";                // Section currency, bid, and percent change font
input color FontColor = clrWhite;                  // Base font color
input color UpColor = clrLime;                     // Color for price increase (Bid text and positive % change)
input color DownColor = clrRed;                    // Color for price decrease (Bid text and negative % change)
input color ArrowUpColor = clrBlue;                // Color for up arrow
input color ArrowDownColor = clrRed;               // Color for down arrow
input int Y_Position = 30;                         // Starting Y position (pixels)
input int SymbolHorizontalSpacing = 160;           // Horizontal spacing for Symbol line (pixels)
input int AskHorizontalSpacing = 150;              // Horizontal spacing for Ask line (pixels)
input int SpreadHorizontalSpacing = 200;           // Horizontal spacing for Spread line (pixels)
input int SectionHorizontalSpacing = 170;          // Horizontal spacing for Section line (pixels)
input double SymbolScrollSpeed = 3.0;              // Symbol line scroll speed (pixels per update)
input double AskScrollSpeed = 1.3;                 // Ask line scroll speed (pixels per update)
input double SpreadScrollSpeed = 10.0;             // Spread line scroll speed (pixels per update)
input double SectionScrollSpeed = 2.7;             // Section scroll speed (pixels per update)
input bool ShowSpread = true;                      // Show spread line
input color BackgroundColor = clrBlack;            // Background rectangle color
input int BackgroundOpacity = 100;                 // Background opacity (0-255, limited effect)
ここでは、MQL5でリアルタイム通貨ペア監視用のローリングティッカーテープを実装するために、まず「<Arrays\ArrayString.mqh>」ライブラリをインクルードし、カスタマイズ用の入力パラメータを定義します。<Arrays\ArrayString.mqh>をインクルードすることで、文字列配列の効率的な操作が可能になり、表示する通貨ペアリストの分割や管理が容易になります。入力パラメータ「Symbols」には「EURUSDm、GBPUSDm、USDJPYm、USDCHFm、AUDUSDm、BTCUSDm、TSLAm」を設定し、ティッカーで監視する通貨ペアを指定します。これにより、どの資産を表示するかを柔軟に設定できます。UpdateIntervalは50ミリ秒に設定しており、応答性とパフォーマンスのバランスを取っています。
視覚的なカスタマイズのため、通貨ペア行ではSymbolFontSize (10)、SymbolFont (Arial Bold)を設定します。Ask価格行ではAskFontSize (10)、AskFont (Arial)、スプレッド行にはSpreadFontSize (10)、SpreadFont (Calibri)を設定します。通貨、Bid、変化率を表示するセクションではSectionFontSize (10)、SectionFont (Arial)を設定します。
文字色や変化表示色も設定します。基本文字色はFontColor (clrWhite)にし、価格上昇はUpColor (clrLime)、下降はDownColor (clrRed)で表示します。方向矢印はArrowUpColor (clrBlue)、ArrowDownColor (clrRed)となります。配置や間隔はY_Position (30)で垂直開始位置を指定し、SymbolHorizontalSpacing (160)、AskHorizontalSpacing (150)、SpreadHorizontalSpacing (200)、SectionHorizontalSpacing (170)で各行の横間隔を設定します。
スクロール速度はSymbolScrollSpeed (3.0)、AskScrollSpeed (1.3)、SpreadScrollSpeed (10.0)、SectionScrollSpeed (2.7)で、各行が独立してスクロールするように設定します。その他の設定として、ShowSpread (true)でスプレッド行を表示し、BackgroundColor (clrBlack)とBackgroundOpacity (100)で背景矩形を設定します。これらの入力により、ティッカーの見た目、動作、表示内容を自由に調整し、リアルタイム監視に最適化することが可能です。コンパイルすると、次の入力セットが得られます。

入力パラメータが定義されたところで、プログラム全体で使用するグローバル変数や、ティッカーテープの繰り返し情報を格納するための構造体をそれぞれ定義していきます。
//--- Global variables
string symbolArray[];                              //--- Array to store symbol names
int totalSymbols;                                  //--- Total number of symbols
struct SymbolData                                  //--- Structure to hold symbol price data
{
   double bid;                                     //--- Current bid price
   double ask;                                     //--- Current ask price
   double spread;                                  //--- Current spread
   double prev_bid;                                //--- Previous bid price
   double daily_open;                              //--- Daily opening price
   color bid_color;                                //--- Color for bid price display
   double percent_change;                          //--- Daily percentage change
   color percent_color;                            //--- Color for percentage change
   string arrow_char;                              //--- Arrow character for price direction
   color arrow_color;                              //--- Color for arrow
};
SymbolData prices[];                               //--- Array of symbol data structures
string dashboardName = "TickerDashboard";          //--- Name for dashboard objects
string backgroundName = "TickerBackground";        //--- Name for background object
CArrayString objManager;                           //--- Object manager for text and image objects
datetime lastDay = 0;                              //--- Track last day for daily open update
ここでは、通貨ペアデータとダッシュボード要素を管理するためのグローバル変数と構造体を定義します。まず、入力パラメータ「Symbols」から取得した通貨ペア名を格納する文字列配列としてsymbolArrayを宣言します。totalSymbols整数型は、入力文字列を分割した後の通貨ペア数を追跡するために使用します。次に、各通貨ペアの価格情報を保持するための構造体「SymbolData」を定義します。構造体には、現在のbid価格を保持する「bid」、現在の売値を保持する「ask」、計算されたスプレッドを保持する「spread」、変化を検出するための前回のbid価格「prev_bid」、本日の始値「daily_open」、bid価格表示の色「bid_color」、日次変化率「percent_change」、変化率の色「percent_color」、方向矢印の文字「arrow_char」、矢印の色「arrow_color」が含まれます。
すべての通貨ペアのデータを格納するため、SymbolData構造体の配列としてpricesを作成します。ダッシュボードオブジェクト名にはdashboardNameとして「TickerDashboard」、背景矩形の名前にはbackgroundNameとして「TickerBackground」を設定します。CArrayString objManagerを使用して、テキストおよび画像オブジェクト名を管理し、簡単にクリーンアップできるようにします。最後に、datetime型のlastDayを定義し、日次始値の更新を管理します。これらのグローバル変数により、通貨ペアデータとオブジェクト管理を整理し、リアルタイム更新やスクロールを効率的に実行できるようになります。次に、コアティッカーパネルを作成するためのグローバルユーティリティ関数を定義していきます。
//+------------------------------------------------------------------+
//| Utility Functions                                                |
//+------------------------------------------------------------------+
void LogError(string message)                      // Log error messages
{
   Print(message);                                 //--- Output message to log
}

//+------------------------------------------------------------------+
//| Create Text Label Function                                       |
//+------------------------------------------------------------------+
bool createText(string objName, string text, int x, int y, color clrTxt, int fontsize, string font)
{
   ResetLastError();                               //--- Clear last error code
   if(ObjectFind(0, objName) < 0)                  //--- Check if object does not exist
   {
      if(!ObjectCreate(0, objName, OBJ_LABEL, 0, 0, 0)) //--- Create text label object
      {
         LogError(__FUNCTION__ + ": Failed to create label: " + objName + ", Error: " + IntegerToString(GetLastError())); //--- Log creation failure
         return false;                             //--- Return failure
      }
      objManager.Add(objName);                     //--- Add object name to manager
   }
   ObjectSetInteger(0, objName, OBJPROP_XDISTANCE, x);       //--- Set x-coordinate
   ObjectSetInteger(0, objName, OBJPROP_YDISTANCE, y);       //--- Set y-coordinate
   ObjectSetInteger(0, objName, OBJPROP_CORNER, CORNER_LEFT_UPPER); //--- Set corner alignment
   ObjectSetString(0, objName, OBJPROP_TEXT, text);          //--- Set text content
   ObjectSetInteger(0, objName, OBJPROP_COLOR, clrTxt);      //--- Set text color
   ObjectSetInteger(0, objName, OBJPROP_FONTSIZE, fontsize); //--- Set font size
   ObjectSetString(0, objName, OBJPROP_FONT, font);          //--- Set font type
   ObjectSetInteger(0, objName, OBJPROP_BACK, false);        //--- Disable background
   ObjectSetInteger(0, objName, OBJPROP_SELECTABLE, false);  //--- Disable selection
   ObjectSetInteger(0, objName, OBJPROP_ZORDER, 0);          //--- Set z-order
   return true;                                              //--- Return success
}

//+------------------------------------------------------------------+
//| Create Panel Function                                            |
//+------------------------------------------------------------------+
bool createPanel(string objName, int y, int width, int height, color clr)
{
   ResetLastError();                               //--- Clear last error code
   if(ObjectFind(0, objName) < 0)                  //--- Check if panel does not exist
   {
      if(!ObjectCreate(0, objName, OBJ_RECTANGLE_LABEL, 0, 0, 0)) //--- Create rectangle panel
      {
         LogError(__FUNCTION__ + ": Failed to create panel: " + objName + ", Error: " + IntegerToString(GetLastError())); //--- Log creation failure
         return false;                             //--- Return failure
      }
      objManager.Add(objName);                     //--- Add panel to object manager
   }
   ObjectSetInteger(0, objName, OBJPROP_XDISTANCE, 0);  //--- Set x-coordinate to 0
   ObjectSetInteger(0, objName, OBJPROP_YDISTANCE, y);  //--- Set y-coordinate
   ObjectSetInteger(0, objName, OBJPROP_XSIZE, width);  //--- Set panel width
   ObjectSetInteger(0, objName, OBJPROP_YSIZE, height); //--- Set panel height
   ObjectSetInteger(0, objName, OBJPROP_BGCOLOR, clr);  //--- Set background color
   ObjectSetInteger(0, objName, OBJPROP_FILL, true);    //--- Enable fill
   ObjectSetInteger(0, objName, OBJPROP_COLOR, clr);    //--- Set border color
   ObjectSetInteger(0, objName, OBJPROP_STYLE, STYLE_SOLID); //--- Set border style
   ObjectSetInteger(0, objName, OBJPROP_WIDTH, 1);      //--- Set border width
   ObjectSetInteger(0, objName, OBJPROP_BACK, false);   //--- Enable background drawing
   ObjectSetInteger(0, objName, OBJPROP_ZORDER, -1);    //--- Set z-order behind other objects
   return true;                                         //--- Return success
}
次に、エラーの記録、テキストラベルの作成、パネルの設定をおこなうユーティリティ関数を実装し、ユーザーインターフェース(UI)の安定性とデバッグのしやすさを確保します。まず、LogError関数を定義します。この関数は文字列型のmessageを受け取り、Print関数を用いてログに出力します。次に、createText関数を作成し、ティッカー表示用のテキストラベルを生成します。この関数は、objName、text、x、y、clrTxt、fontsize、fontをパラメータとして受け取ります。
関数内では、まずResetLastErrorで最後のエラーをクリアし、ObjectFind関数でオブジェクトの存在を確認します。存在しない場合は、ObjectCreate関数でOBJ_LABELとしてラベルを作成し、作成に失敗した場合はログに記録してfalseを返します。作成したobjNameはobjManagerに追加して管理し、ObjectSetIntegerでOBJPROP_XDISTANCEなどの整数プロパティを設定し、ObjectSetStringでOBJPROP_TEXTやOBJPROP_FONTを設定します。この関数により、通貨ペア、価格、変化率のテキスト表示が一貫してレンダリングされます。
続いて、createPanel関数を定義し、背景パネルを作成します。この関数は、objName、y、width、height、clrをパラメータとして受け取り、createText関数と同様の構造で処理します。これにより、ティッカーの背景をカスタマイズ可能にし、色の選択で不透明度のような効果を表現できます。これでティッカーパネルを作成する準備が整いました。次に、必要なデータを整理します。具体的には、Symbolsの文字列を個別の独立した通貨ペアに分割し、pricesや色データを初期化します。この処理はOnInitイベントハンドラ内でおこないます。
//+------------------------------------------------------------------+
//| Expert initialization function                                   |
//+------------------------------------------------------------------+
int OnInit()
{
   //--- Split symbols string into array
   totalSymbols = StringSplit(Symbols, ',', symbolArray); //--- Split input symbols into array
   ArrayResize(prices, totalSymbols);            //--- Resize prices array to match symbol count

   //--- Verify symbols exist and initialize data
   for(int i = 0; i < totalSymbols; i++)         //--- Iterate through all symbols
   {
      if(!SymbolSelect(symbolArray[i], true))    //--- Select symbol for market watch
      {
         LogError("OnInit: Symbol " + symbolArray[i] + " not found"); //--- Log symbol not found
         return(INIT_FAILED);                    //--- Return initialization failure
      }
      prices[i].bid = 0;                         //--- Initialize bid price
      prices[i].ask = 0;                         //--- Initialize ask price
      prices[i].spread = 0;                      //--- Initialize spread
      prices[i].prev_bid = 0;                    //--- Initialize previous bid
      prices[i].daily_open = iOpen(symbolArray[i], PERIOD_D1, 0); //--- Set daily opening price
      prices[i].bid_color = FontColor;           //--- Set initial bid color
      prices[i].percent_change = 0;              //--- Initialize percentage change
      prices[i].percent_color = FontColor;       //--- Set initial percent color
      prices[i].arrow_char = CharToString(236);  //--- Set default up arrow
      prices[i].arrow_color = FontColor;         //--- Set initial arrow color
   }
   ArrayPrint(symbolArray);
   ArrayPrint(prices);
}
OnInitイベントハンドラ内では、プログラムを初期化し、通貨ペアやデータ構造を設定します。まず、入力パラメータ「Symbols」の文字列をStringSplit関数でコンマ区切りにしてsymbolArrayに分割し、通貨ペアの数をtotalSymbolsに格納します。もし他の区切り文字を使用している場合は、ここでその区切り文字を指定します。次に、ArrayResizeを用いてprices配列をtotalSymbolsにリサイズし、通貨ペアの数に合わせます。その後、symbolArrayの各通貨ペアに対してループ処理をおこない、SymbolSelectで気配値表示に選択します。選択に失敗した場合は、LogErrorでエラーを記録し、INIT_FAILEDを返します。
各通貨ペアについて、prices[i].bid、prices[i].ask、prices[i].spread、prices[i].prev_bidを0に初期化し、prices[i].daily_openにはiOpen関数を使って日足(PERIOD_D1)の始値を設定します。さらに、prices[i].bid_color、prices[i].percent_change、prices[i].percent_color、prices[i].arrow_char(上矢印はCharToStringを使用)、prices[i].arrow_colorに初期色や値を設定します。デバッグ用にArrayPrint関数でsymbolArrayとpricesを出力します。これにより、すべての通貨ペアが有効であることが確認でき、リアルタイム更新に向けたデータ準備が整います。コンパイルすると、次のような出力が得られます。

画像からもわかるように、すべての通貨ペアとデータ保持用構造体が正常に初期化され、準備が整いました。これでダッシュボードの背景を作成することが可能です。
//+------------------------------------------------------------------+
//| Create background function                                       |
//+------------------------------------------------------------------+
void CreateBackground()
{
   int width = (int)ChartGetInteger(0, CHART_WIDTH_IN_PIXELS); //--- Get chart width
   int height = (ShowSpread ? 4 : 3) * (MathMax(MathMax(MathMax(SymbolFontSize, AskFontSize), SpreadFontSize), SectionFontSize) + 2) + 40; //--- Calculate panel height
   createPanel(backgroundName, Y_Position - 5, width, height, BackgroundColor); //--- Create background panel
}
ここでは、CreateBackground関数を実装して、ティッカー表示用の背景パネルを設定します。まず、CHART_WIDTH_IN_PIXELS関数を使用してCHART_WIDTH_IN_PIXELSを取得し、整数型にキャストしてwidthに格納します。次に、ShowSpreadを条件とした三項演算子でパネルの高さをheightに計算します。行数が4行か3行かを判定し、SymbolFontSize、AskFontSize、SpreadFontSize、SectionFontSizeの最大フォントサイズに2ピクセルの余白を加えて掛け算し、さらに追加スペースとして40ピクセルを加えます。最後に、createPanel関数を呼び出し、backgroundName、垂直位置はY_Position - 5、幅はwidth、高さはheight、背景色はBackgroundColorを指定して背景矩形を描画します。これにより、スクロールするテキスト要素のための統一的な基盤が構築されます。初期化時にこの関数を呼び出すと、以下の結果が得られます。

背景が作成されたので、次に他のダッシュボード要素を作成していきます。以下のようにすべてを格納する関数を作成します。
//+------------------------------------------------------------------+
//| Create dashboard function                                        |
//+------------------------------------------------------------------+
void CreateDashboard()
{
   //--- Create text and image objects for each symbol
   for(int i = 0; i < totalSymbols; i++)         //--- Iterate through all symbols
   {
      // Determine image based on symbol
      string imageFile;                          //--- Variable for image file path
      if(symbolArray[i] == "EURUSDm")            //--- Check for EURUSDm
         imageFile = "\\Images\\euro.bmp";       //--- Set EURUSD image
      else if(symbolArray[i] == "GBPUSDm")       //--- Check for GBPUSDm
         imageFile = "\\Images\\gbpusd.bmp";     //--- Set GBPUSD image
      else if(symbolArray[i] == "USDJPYm")       //--- Check for USDJPYm
         imageFile = "\\Images\\usdjpy.bmp";     //--- Set USDJPY image
      else if(symbolArray[i] == "USDCHFm")       //--- Check for USDCHFm
         imageFile = "\\Images\\usdchf.bmp";     //--- Set USDCHF image
      else if(symbolArray[i] == "AUDUSDm")       //--- Check for AUDUSDm
         imageFile = "\\Images\\audusd.bmp";     //--- Set AUDUSD image
      else if(symbolArray[i] == "BTCUSDm")       //--- Check for BTCUSDm
         imageFile = "\\Images\\btcusd.bmp";     //--- Set BTCUSD image
      else if(symbolArray[i] == "TSLAm")         //--- Check for TSLAm
         imageFile = "\\Images\\tesla.bmp";      //--- Set Tesla image
      else
         imageFile = "\\Images\\euro.bmp";       //--- Set default image

      // Symbol line (first line)
      createText(dashboardName + "_Symbol_" + IntegerToString(i), "", (i * SymbolHorizontalSpacing), Y_Position, FontColor, SymbolFontSize, SymbolFont); //--- Create symbol text label

      // Ask line (second line)
      createText(dashboardName + "_Ask_" + IntegerToString(i), "", (i * AskHorizontalSpacing), Y_Position + SymbolFontSize + 2, FontColor, AskFontSize, AskFont); //--- Create ask price text label

      // Spread line (third line, if enabled)
      if(ShowSpread)                             //--- Check if spread display is enabled
      {
         createText(dashboardName + "_Spread_" + IntegerToString(i), "", (i * SpreadHorizontalSpacing), Y_Position + SymbolFontSize + 2 + AskFontSize + 2, FontColor, SpreadFontSize, SpreadFont); //--- Create spread text label
      }

      // Section: Image (left)
      string imageName = dashboardName + "_Image_" + IntegerToString(i); //--- Define image object name
      if(ObjectFind(0, imageName) < 0)           //--- Check if image object does not exist
      {
         if(!ObjectCreate(0, imageName, OBJ_BITMAP_LABEL, 0, 0, 0)) //--- Create image object
         {
            LogError("CreateDashboard: Failed to create image: " + imageName + ", Error: " + IntegerToString(GetLastError())); //--- Log image creation failure
            return;                              //--- Exit function
         }
         objManager.Add(imageName);              //--- Add image to object manager
      }
      ObjectSetInteger(0, imageName, OBJPROP_XDISTANCE, (i * SectionHorizontalSpacing)); //--- Set image x-coordinate
      ObjectSetInteger(0, imageName, OBJPROP_YDISTANCE, Y_Position + (ShowSpread ? SymbolFontSize + 2 + AskFontSize + 2 + SpreadFontSize + 14 : SymbolFontSize + 2 + AskFontSize + 14)); //--- Set image y-coordinate
      ObjectSetString(0, imageName, OBJPROP_BMPFILE, imageFile); //--- Set image file
      ObjectSetInteger(0, imageName, OBJPROP_CORNER, CORNER_LEFT_UPPER); //--- Set image corner alignment

      // Section: Currency (top, right of image)
      string currencyName = dashboardName + "_Currency_" + IntegerToString(i); //--- Define currency text object name
      createText(currencyName, StringFormat("%-10s", symbolArray[i]), (i * SectionHorizontalSpacing) + 35, Y_Position + (ShowSpread ? SymbolFontSize + 2 + AskFontSize + 2 + SpreadFontSize + 14 : SymbolFontSize + 2 + AskFontSize + 14), FontColor, SectionFontSize, SectionFont); //--- Create currency text label

      // Section: Percent Change (next to currency, horizontal)
      string percentChangeName = dashboardName + "_PercentChange_" + IntegerToString(i); //--- Define percent change object name
      string percentText = prices[i].percent_change >= 0 ? StringFormat("+%.2f%%", prices[i].percent_change) : StringFormat("%.2f%%", prices[i].percent_change); //--- Format percent change text
      createText(percentChangeName, percentText, (i * SectionHorizontalSpacing) + 105, Y_Position + (ShowSpread ? SymbolFontSize + 2 + AskFontSize + 2 + SpreadFontSize + 14 : SymbolFontSize + 2 + AskFontSize + 14), prices[i].percent_color, SectionFontSize, SectionFont); //--- Create percent change text label

      // Section: Arrow (below currency, right of image, Wingdings)
      string arrowName = dashboardName + "_Arrow_" + IntegerToString(i); //--- Define arrow object name
      createText(arrowName, prices[i].arrow_char, (i * SectionHorizontalSpacing) + 35, Y_Position + (ShowSpread ? SymbolFontSize + 2 + AskFontSize + 2 + SpreadFontSize + 14 : SymbolFontSize + 2 + AskFontSize + 14) + SectionFontSize + 2, prices[i].arrow_color, SectionFontSize, "Wingdings"); //--- Create arrow text label

      // Section: Bid Price (next to arrow, horizontal)
      string bidName = dashboardName + "_Bid_" + IntegerToString(i); //--- Define bid price object name
      createText(bidName, StringFormat("%.5f", prices[i].bid), (i * SectionHorizontalSpacing) + 50, Y_Position + (ShowSpread ? SymbolFontSize + 2 + AskFontSize + 2 + SpreadFontSize + 14 : SymbolFontSize + 2 + AskFontSize + 14) + SectionFontSize + 2, prices[i].bid_color, SectionFontSize, SectionFont); //--- Create bid price text label
   }
}
ここでは、CreateDashboard関数を実装し、ティッカー表示の視覚要素、つまり各通貨ペアのテキストラベルや画像を設定します。まず、totalSymbolsの数だけループを回し、symbolArray[i]に基づいてimageFileをif-else条件で決定します。例えば「EURUSDm」の場合は特定のBMPファイルを割り当て、その他の通貨ペアにはデフォルトのファイルを割り当てます。通貨ペア行のテキストは、createTextを用いて「dashboardName + "Symbol" + IntegerToString(i)」として作成し、位置は「(i * SymbolHorizontalSpacing)」と「Y_Position」に設定します。
Ask行については、同様にcreateTextで「dashboardName + "Ask" + IntegerToString(i)」を作成し、位置は「(i * AskHorizontalSpacing)」と「Y_Position + SymbolFontSize + 2」とします。ShowSpreadがtrueの場合は、スプレッド行もcreateTextで「dashboardName + "Spread" + IntegerToString(i)」として追加し、適切に位置を設定します。
セクションについては、ObjectCreate関数でOBJ_BITMAP_LABELとして画像オブジェクトを作成し、存在しない場合のみ追加します。作成したオブジェクトはobjManagerに登録し、ObjectSetIntegerで位置を設定、ObjectSetStringでimageFileを割り当てます。画像ファイルはBMP形式で用意する必要があります。ここではデフォルトディレクトリを使用しましたが、任意のディレクトリを使用することも可能です。

次に、通貨テキストをcreateTextで作成し、「dashboardName + "Currency" + IntegerToString(i)」として、StringFormat関数でフォーマットします。日次変化率については、prices[i].percent_changeを基にpercentTextをフォーマットし、createTextで表示します。方向矢印ラベルもcreateTextを使用し、prices[i].arrow_charとWingdingsフォントで作成します。最後に、bid価格のテキストをStringFormatでprices[i].bidを用いてcreateTextで作成します。この関数により、画像と動的テキストを組み合わせた複数行のティッカーレイアウトを構築し、リアルタイムデータのスクロール表示が可能になります。初期化時にこの関数を呼び出すと、以下の出力が得られます。

得られたのは静的なダッシュボードです。次におこなう必要があるのは、ダッシュボードの更新です。リアルタイム更新において、ティックベースの更新に依存したくはありません。なぜなら、それではプログラムが接続されている通貨ペアのティック頻度に完全に依存してしまうからです。ここでおこないたいのは、タイマーを用いた更新で、頻繁にデータを更新できるようにすることです。まず、必要に応じてダッシュボードと背景を更新する関数を定義しましょう。
//+------------------------------------------------------------------+
//| Update background function                                       |
//+------------------------------------------------------------------+
void UpdateBackground()
{
   int width = (int)ChartGetInteger(0, CHART_WIDTH_IN_PIXELS); //--- Get current chart width
   int height = (ShowSpread ? 4 : 3) * (MathMax(MathMax(MathMax(SymbolFontSize, AskFontSize), SpreadFontSize), SectionFontSize) + 2) + 40; //--- Recalculate panel height
   ObjectSetInteger(0, backgroundName, OBJPROP_XSIZE, width);  //--- Update panel width
   ObjectSetInteger(0, backgroundName, OBJPROP_YSIZE, height); //--- Update panel height
}

//+------------------------------------------------------------------+
//| Update dashboard function                                        |
//+------------------------------------------------------------------+
void UpdateDashboard()
{
   static double symbolOffset = 0;                //--- Track symbol line offset
   static double askOffset = 0;                   //--- Track ask line offset
   static double spreadOffset = 0;                //--- Track spread line offset
   static double sectionOffset = 0;               //--- Track section offset
   int totalWidthSymbol = totalSymbols * SymbolHorizontalSpacing;   //--- Calculate total symbol line width
   int totalWidthAsk = totalSymbols * AskHorizontalSpacing;         //--- Calculate total ask line width
   int totalWidthSpread = totalSymbols * SpreadHorizontalSpacing;   //--- Calculate total spread line width
   int totalWidthSection = totalSymbols * SectionHorizontalSpacing; //--- Calculate total section width
   int rightEdge = (int)ChartGetInteger(0, CHART_WIDTH_IN_PIXELS);  //--- Get chart right boundary

   //--- Update text and image objects
   for(int i = 0; i < totalSymbols; i++)         //--- Iterate through all symbols
   {
      // Symbol line (first line)
      string symbolName = dashboardName + "_Symbol_" + IntegerToString(i); //--- Define symbol object name
      double symbolXPos = (i * SymbolHorizontalSpacing) - symbolOffset; //--- Calculate symbol x-position
      if(symbolXPos < -SymbolHorizontalSpacing) symbolXPos += totalWidthSymbol; //--- Wrap around if off-screen
      createText(symbolName, StringFormat("%-10s", symbolArray[i]), (int)symbolXPos, Y_Position, FontColor, SymbolFontSize, SymbolFont); //--- Update symbol text
      ObjectSetInteger(0, symbolName, OBJPROP_HIDDEN, symbolXPos > rightEdge || symbolXPos < 0); //--- Hide if off-screen

      // Ask line (second line)
      string askName = dashboardName + "_Ask_" + IntegerToString(i); //--- Define ask object name
      double askXPos = (i * AskHorizontalSpacing) - askOffset;       //--- Calculate ask x-position
      if(askXPos < -AskHorizontalSpacing) askXPos += totalWidthAsk;  //--- Wrap around if off-screen
      createText(askName, StringFormat("%.5f", prices[i].ask), (int)askXPos, Y_Position + SymbolFontSize + 2, clrMagenta, AskFontSize, AskFont); //--- Update ask text
      ObjectSetInteger(0, askName, OBJPROP_HIDDEN, askXPos > rightEdge || askXPos < 0); //--- Hide if off-screen

      // Spread line (third line)
      if(ShowSpread)                             //--- Check if spread display is enabled
      {
         string spreadName = dashboardName + "_Spread_" + IntegerToString(i);      //--- Define spread object name
         double spreadXPos = (i * SpreadHorizontalSpacing) - spreadOffset;         //--- Calculate spread x-position
         if(spreadXPos < -SpreadHorizontalSpacing) spreadXPos += totalWidthSpread; //--- Wrap around if off-screen
         createText(spreadName, StringFormat("%.1f", prices[i].spread), (int)spreadXPos, Y_Position + SymbolFontSize + 2 + AskFontSize + 2, clrAqua, SpreadFontSize, SpreadFont); //--- Update spread text
         ObjectSetInteger(0, spreadName, OBJPROP_HIDDEN, spreadXPos > rightEdge || spreadXPos < 0); //--- Hide if off-screen
      }

      // Section (Image, Currency, Percent Change, Arrow, Bid Price)
      double sectionXPos = (i * SectionHorizontalSpacing) - sectionOffset;          //--- Calculate section x-position
      if(sectionXPos < -SectionHorizontalSpacing) sectionXPos += totalWidthSection; //--- Wrap around if off-screen

      // Image (left)
      string imageName = dashboardName + "_Image_" + IntegerToString(i); //--- Define image object name
      ObjectSetInteger(0, imageName, OBJPROP_XDISTANCE, (int)sectionXPos); //--- Update image x-coordinate
      ObjectSetInteger(0, imageName, OBJPROP_YDISTANCE, Y_Position + (ShowSpread ? SymbolFontSize + 2 + AskFontSize + 2 + SpreadFontSize + 14 : SymbolFontSize + 2 + AskFontSize + 14)); //--- Update image y-coordinate
      ObjectSetInteger(0, imageName, OBJPROP_HIDDEN, sectionXPos > rightEdge || sectionXPos < 0); //--- Hide if off-screen

      // Currency (top, right of image)
      string currencyName = dashboardName + "_Currency_" + IntegerToString(i); //--- Define currency object name
      createText(currencyName, StringFormat("%-10s", symbolArray[i]), (int)sectionXPos + 35, Y_Position + (ShowSpread ? SymbolFontSize + 2 + AskFontSize + 2 + SpreadFontSize + 14 : SymbolFontSize + 2 + AskFontSize + 14), FontColor, SectionFontSize, "Arial Bold"); //--- Update currency text

      // Percent Change (next to currency, horizontal)
      string percentChangeName = dashboardName + "_PercentChange_" + IntegerToString(i); //--- Define percent change object name
      string percentText = prices[i].percent_change >= 0 ? StringFormat("+%.2f%%", prices[i].percent_change) : StringFormat("%.2f%%", prices[i].percent_change); //--- Format percent change
      createText(percentChangeName, percentText, (int)sectionXPos + 105, Y_Position + (ShowSpread ? SymbolFontSize + 2 + AskFontSize + 2 + SpreadFontSize + 14 : SymbolFontSize + 2 + AskFontSize + 14), prices[i].percent_color, SectionFontSize, SectionFont); //--- Update percent change text

      // Arrow (below currency, right of image, Wingdings)
      string arrowName = dashboardName + "_Arrow_" + IntegerToString(i); //--- Define arrow object name
      createText(arrowName, prices[i].arrow_char, (int)sectionXPos + 35, Y_Position + (ShowSpread ? SymbolFontSize + 2 + AskFontSize + 2 + SpreadFontSize + 14 : SymbolFontSize + 2 + AskFontSize + 14) + SectionFontSize + 2, prices[i].arrow_color, SectionFontSize, "Wingdings"); //--- Update arrow text

      // Bid Price (next to arrow, horizontal)
      string bidName = dashboardName + "_Bid_" + IntegerToString(i); //--- Define bid object name
      createText(bidName, StringFormat("%.5f", prices[i].bid), (int)sectionXPos + 50, Y_Position + (ShowSpread ? SymbolFontSize + 2 + AskFontSize + 2 + SpreadFontSize + 14 : SymbolFontSize + 2 + AskFontSize + 14) + SectionFontSize + 2, prices[i].bid_color, SectionFontSize, SectionFont); //--- Update bid price text
   }

   //--- Increment offsets for scrolling effect
   symbolOffset = fmod(symbolOffset + SymbolScrollSpeed, totalWidthSymbol);     //--- Update symbol line offset
   askOffset = fmod(askOffset + AskScrollSpeed, totalWidthAsk);                 //--- Update ask line offset
   spreadOffset = fmod(spreadOffset + SpreadScrollSpeed, totalWidthSpread);     //--- Update spread line offset
   sectionOffset = fmod(sectionOffset + SectionScrollSpeed, totalWidthSection); //--- Update section offset

   //--- Redraw chart
   ChartRedraw();                                //--- Refresh chart display
}
ここでは、チャートサイズ変更時に背景パネルを調整するUpdateBackground関数を実装します。まず、ChartGetInteger関数を使用してCHART_WIDTH_IN_PIXELSを取得し、整数型にキャストしてwidthに格納します。次に、ShowSpreadを条件とした三項演算子でパネルの高さをheightに再計算します。行数が4行か3行かを判定し、SymbolFontSize、AskFontSize、SpreadFontSize、SectionFontSizeの最大フォントサイズに2ピクセルの余白を加えて掛け算し、さらに追加スペースとして40ピクセルを加えます。最後に、ObjectSetIntegerを用いてbackgroundNameのOBJPROP_XSIZEおよびOBJPROP_YSIZEを更新し、パネルの寸法を変更します。
次に、UpdateDashboard関数を実装し、テキストおよび画像オブジェクトのスクロールと更新をおこないます。まず、各行の位置を追跡するために、静的変数としてsymbolOffset、askOffset、spreadOffset、sectionOffsetを定義します。総幅は、totalSymbolsにそれぞれの横間隔入力(SymbolHorizontalSpacing、AskHorizontalSpacing、SpreadHorizontalSpacing、SectionHorizontalSpacing)を掛けて計算し、totalWidthSymbol、totalWidthAsk、totalWidthSpread、totalWidthSectionに格納します。チャートの右端はChartGetIntegerでCHART_WIDTH_IN_PIXELSを取得してrightEdgeとします。totalSymbolsの数だけループ処理をおこない、各通貨ペアの位置をsymbolXPosにsymbolOffsetを加えて調整し、画面外に出た場合はmoduloで折り返します。その後、createTextを呼び出してテキストを更新し、画面外のオブジェクトはObjectSetIntegerでOBJPROP_HIDDENをtrueにして非表示にします。
Ask行、Spread行(ShowSpreadがtrueの場合)、セクション要素についても同様に更新します。画像はObjectSetIntegerでOBJPROP_XDISTANCEおよびOBJPROP_YDISTANCEを設定し、通貨テキスト、日次変化率(StringFormatで整形)、矢印(prices[i].arrow_charを使用)、bid価格テキストを更新します。各オフセットはスクロール速度を用いたfmodで増加させ、ChartRedrawを呼び出して表示をリフレッシュします。これらの関数により、ティッカーはチャートの変化に応じて適応し、リアルタイム監視用にスムーズにスクロールします。これらの関数はOnTimerイベントハンドラ内で呼び出すことができますが、その前にタイマー間隔を設定する必要があります。これは非常に重要です。
//--- Set timer
EventSetMillisecondTimer(UpdateInterval);     //--- Set timer for updates

//--- Initialize last day
lastDay = TimeCurrent() / 86400;              //--- Set current day for daily open tracking
ここでは、EventSetMillisecondTimer関数を呼び出し、あらかじめ定義したUpdateIntervalを渡すことでタイマー間隔を設定します。最後に、新しい日付の追跡用にlastDay変数を初期化します。これで、タイマーによる処理のロジックを定義する準備が整いました。
//+------------------------------------------------------------------+
//| Expert timer function                                            |
//+------------------------------------------------------------------+
void OnTimer()
{
   //--- Check for new day to update daily open
   datetime currentDay = TimeCurrent() / 86400;  //--- Calculate current day
   if(currentDay > lastDay)                      //--- Check if new day
   {
      for(int i = 0; i < totalSymbols; i++)      //--- Iterate through symbols
      {
         prices[i].daily_open = iOpen(symbolArray[i], PERIOD_D1, 0); //--- Update daily open price
      }
      lastDay = currentDay;                      //--- Update last day
   }

   //--- Update background size in case chart is resized
   UpdateBackground();                           //--- Update background dimensions

   //--- Update dashboard display
   UpdateDashboard();                            //--- Update dashboard visuals
}
ここでは、OnTimerイベントハンドラを実装し、UpdateIntervalで設定した間隔に応じて、ローリングティッカーテープの定期更新を管理します。まず、TimeCurrentを86400で割ってcurrentDayを計算します。これは1日(24時間×60分×60秒)を秒単位で表したものです。currentDayがlastDayより大きい場合、totalSymbolsの数だけループを回し、各通貨ペアのprices[i].daily_openをiOpen関数でPERIOD_D1、シフト0を使って更新します。その後、lastDayをcurrentDayに設定し、新しい日付を追跡します。これにより、日次変化率は正しく午前0時にリセットされます。
次に、UpdateBackgroundを呼び出して、チャートサイズ変更時に背景パネルを調整します。最後に、UpdateDashboardを呼び出して、テキストおよび画像オブジェクトを最新のデータとスクロール位置で更新し、ティッカーを動的かつ時間に応じた変化に対応させます。次のような結果が得られます。

可視化から、ティッカーが効果的にスクロールしていることが確認できます。次におこなうのは、価格の更新です。この更新ロジックも別関数として実装します。
//+------------------------------------------------------------------+
//| Update prices function                                           |
//+------------------------------------------------------------------+
void UpdatePrices()
{
   for(int i = 0; i < totalSymbols; i++)         //--- Iterate through all symbols
   {
      double bid = SymbolInfoDouble(symbolArray[i], SYMBOL_BID); //--- Retrieve current bid price
      double ask = SymbolInfoDouble(symbolArray[i], SYMBOL_ASK); //--- Retrieve current ask price

      //--- Validate prices
      if(bid == 0 || ask == 0)                   //--- Check for invalid prices
      {
         LogError("UpdatePrices: Failed to retrieve prices for " + symbolArray[i]); //--- Log price retrieval failure
         continue;                               //--- Skip to next symbol
      }

      //--- Update color and arrow based on price change (tick-to-tick for bid and arrow)
      if(bid > prices[i].prev_bid && prices[i].prev_bid != 0) //--- Check if bid increased
      {
         prices[i].bid_color = UpColor;            //--- Set bid color to up color
         prices[i].arrow_char = CharToString(236); //--- Set up arrow character
         prices[i].arrow_color = ArrowUpColor;     //--- Set arrow to up color
      }
      else if(bid < prices[i].prev_bid && prices[i].prev_bid != 0) //--- Check if bid decreased
      {
         prices[i].bid_color = DownColor;          //--- Set bid color to down color
         prices[i].arrow_char = CharToString(238); //--- Set down arrow character
         prices[i].arrow_color = ArrowDownColor;   //--- Set arrow to down color
      }
      else                                         //--- Handle no change or first tick
      {
         prices[i].bid_color = FontColor;          //--- Set bid color to default
         prices[i].arrow_char = CharToString(236); //--- Set default up arrow
         prices[i].arrow_color = FontColor;        //--- Set arrow to default color
      }

      //--- Calculate daily percentage change
      prices[i].percent_change = prices[i].daily_open != 0 ? ((bid - prices[i].daily_open) / prices[i].daily_open) * 100 : 0; //--- Compute percentage change
      prices[i].percent_color = prices[i].percent_change >= 0 ? UpColor : DownColor; //--- Set percent color based on change

      //--- Update data
      prices[i].bid = bid;                       //--- Store current bid
      prices[i].ask = ask;                       //--- Store current ask
      prices[i].spread = (ask - bid) * MathPow(10, SymbolInfoInteger(symbolArray[i], SYMBOL_DIGITS)); //--- Calculate spread
      prices[i].prev_bid = bid;                  //--- Update previous bid
   }
}
ここでは、UpdatePrices関数を実装し、通貨ペアのデータを更新します。まず、totalSymbolsの数だけループを回し、SYMBOL_BIDとSYMBOL_ASKを用いてSymbolInfoDouble関数によってsymbolArray[i]のbidおよびaskを取得します。もしbidまたはaskが0の場合は、LogErrorでエラーを記録し、次の通貨ペアへスキップします。次に、bid_color、arrow_char(上矢印または下矢印を CharToString関数で設定)、arrow_colorを、bidがprev_bidより大きいか小さいか、または同じかに応じて更新します(初期値0の場合は無視します)。矢印はMQL5のデフォルトWingdings構造を使用しますが。

好みに応じて任意の矢印コードを使用することも可能です。さらに、daily_openを用いてpercent_changeを計算し、三項演算子で上昇・下降に応じてpercent_colorを設定します。最後に、prices[i].bid、prices[i].ask、spread(MathPowおよびSymbolInfoIntegerでSYMBOL_DIGITSを考慮して計算)、prev_bidを更新し、表示用の価格および指標を最新の状態に保ちます。これにより、ティッカーの価格と各種指標は常に最新の状態となります。この関数は、各ティックで呼び出して価格変化を処理することもできますし、OnTimer関数内で呼び出すことも可能です。呼び出し方法は用途に応じて選択できます。
//+------------------------------------------------------------------+
//| Expert tick function                                             |
//+------------------------------------------------------------------+
void OnTick()
{
   //--- Update prices on every tick for live changes
   UpdatePrices();                               //--- Update symbol prices
}

//+------------------------------------------------------------------+
//| Expert deinitialization function                                 |
//+------------------------------------------------------------------+
void OnDeinit(const int reason)
{
   //--- Clean up objects
   for(int i = objManager.Total() - 1; i >= 0; i--) //--- Iterate through all managed objects
   {
      string name = objManager.At(i);               //--- Get object name
      if(ObjectFind(0, name) >= 0)                  //--- Check if object exists
      {
         if(!ObjectDelete(0, name))                 //--- Delete object
            LogError("OnDeinit: Failed to delete object: " + name + ", Error: " + IntegerToString(GetLastError())); //--- Log deletion failure
      }
      objManager.Delete(i);                        //--- Remove object from manager
   }
   EventKillTimer();                               //--- Stop timer
}
OnTickイベントハンドラでは、UpdatePricesを呼び出してすべての通貨ペアのbid、ask、スプレッド、および変化率データを更新し、ティッカーがリアルタイムの市場変動を迅速に反映するようにします。次に、プログラム削除時のクリーンアップをおこなうOnDeinit関数を実装します。まず、objManagerのTotalを使って逆順にループを回し、各オブジェクトの名前をAtで取得します。ObjectFindでオブジェクトの存在を確認し、存在する場合はObjectDeleteで削除します。削除に失敗した場合はLogErrorでログに記録します。最後にDelete演算子でobjManagerから名前を削除します。さらに、EventKillTimer でタイマーを停止し、定期更新を終了させます。これは非常に重要です。これにより、すべてのオブジェクトが正しくクリアされ、チャート上に不要な要素が残ることを防げます。プログラムを実行すると、以下の結果が得られます。

可視化から、すべてが期待通りに動作していることが確認でき、目標を達成しています。残されているのはプロジェクトの実用性をテストすることであり、それは次のセクションで扱います。
バックテスト
テストを実施しました。以下はコンパイル後の可視化を単一のGraphics Interchange Format (GIF)ビットマップ画像形式で示したものです。

結論
まとめとして、本稿では、MQL5を用いたリアルタイム通貨ペア監視用のローリングティッカーテープを開発しました。本ティッカーは、買値、スプレッド、日次変化率をスクロール表示し、フォント、色、スクロール速度をカスタマイズ可能で、市場の動きを効果的に強調できます。SymbolDataなどのデータ構造から、UpdateDashboardやUpdatePricesといった関数に至るまで、アーキテクチャと実装の流れを示し、スムーズなスクロールと正確なデータ更新を可能にしました。これにより、効率的な取引判断のための情報提供が実現されます。本ティッカーは用途に応じて自由にカスタマイズでき、複数の通貨ペアを同時に追跡し、リアルタイムで価格変動に対応する能力を大幅に向上させることが可能です。
MetaQuotes Ltdにより英語から翻訳されました。
元の記事: https://www.mql5.com/en/articles/18844
警告: これらの資料についてのすべての権利はMetaQuotes Ltd.が保有しています。これらの資料の全部または一部の複製や再プリントは禁じられています。
この記事はサイトのユーザーによって執筆されたものであり、著者の個人的な見解を反映しています。MetaQuotes Ltdは、提示された情報の正確性や、記載されているソリューション、戦略、または推奨事項の使用によって生じたいかなる結果についても責任を負いません。

- 無料取引アプリ
- 8千を超えるシグナルをコピー
- 金融ニュースで金融マーケットを探索
働かない
記事を読んだのか?