
Herramientas de trading de MQL5 (Parte 5): Creación de una cinta de cotizaciones deslizante para el seguimiento en tiempo real de símbolos
 303
303
 2
2

Introducción
En nuestro artículo anterior (Parte 4), mejoramos el panel de control del escáner de múltiples marcos temporales con funciones de posicionamiento dinámico y opciones para mostrar u ocultar elementos en MetaQuotes Language 5 (MQL5), lo que permite elementos visuales movibles y minimizables para una mayor facilidad de uso. En la parte 5, creamos una cinta de cotizaciones deslizante para el seguimiento en tiempo real de múltiples símbolos, que muestra los precios Bid, los spreads y las variaciones porcentuales diarias, además de elementos visuales personalizables para que los operadores estén informados rápidamente. Abordaremos los siguientes temas:
- Comprender la arquitectura de la cinta de cotizaciones deslizante
- Implementación en MQL5
- Backtesting
- Conclusión
Al final, tendrás una herramienta de ticker versátil en MQL5 lista para personalizarla e integrarla en tu entorno de trading. ¡Entremos en materia!
Comprender la arquitectura de la cinta de cotizaciones deslizante
La cinta de cotizaciones que estamos creando es una herramienta para mostrar datos en tiempo real de varios símbolos en formato de desplazamiento, en la que se muestran los precio Bid (oferta), los spreads y las variaciones porcentuales diarias, lo que nos permite estar al día de un solo vistazo. Esta función es importante porque ofrece una visión compacta y dinámica de los movimientos del mercado, destacando las tendencias de los precios y la volatilidad sin sobrecargar el gráfico, lo cual es esencial para tomar decisiones rápidas en un entorno de trading dinámico.
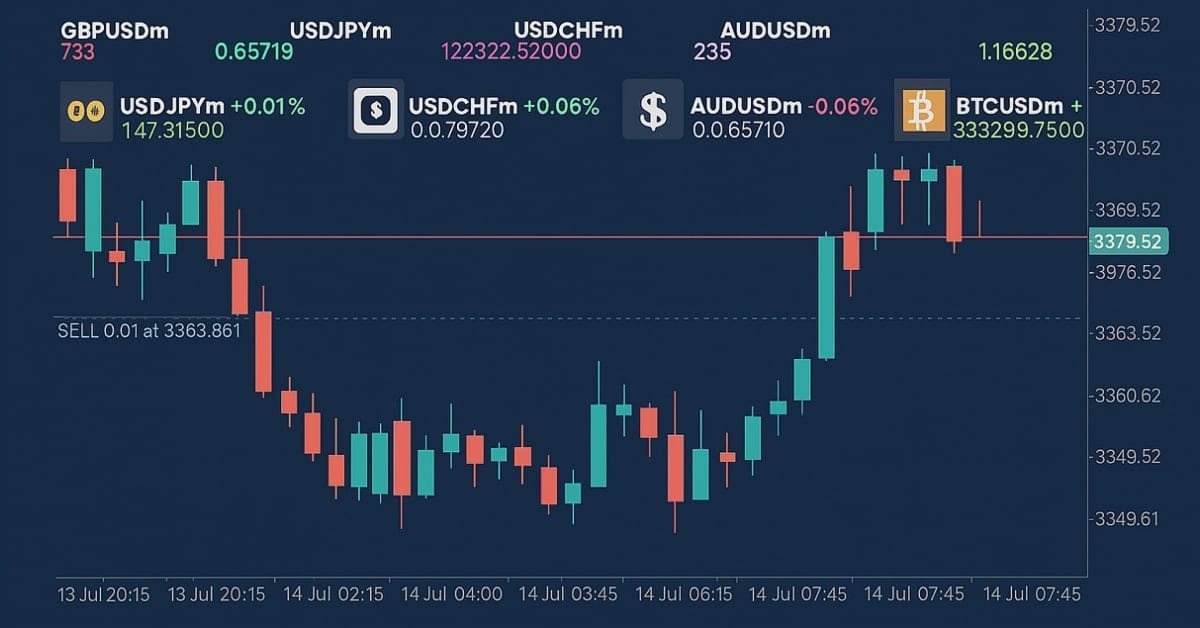
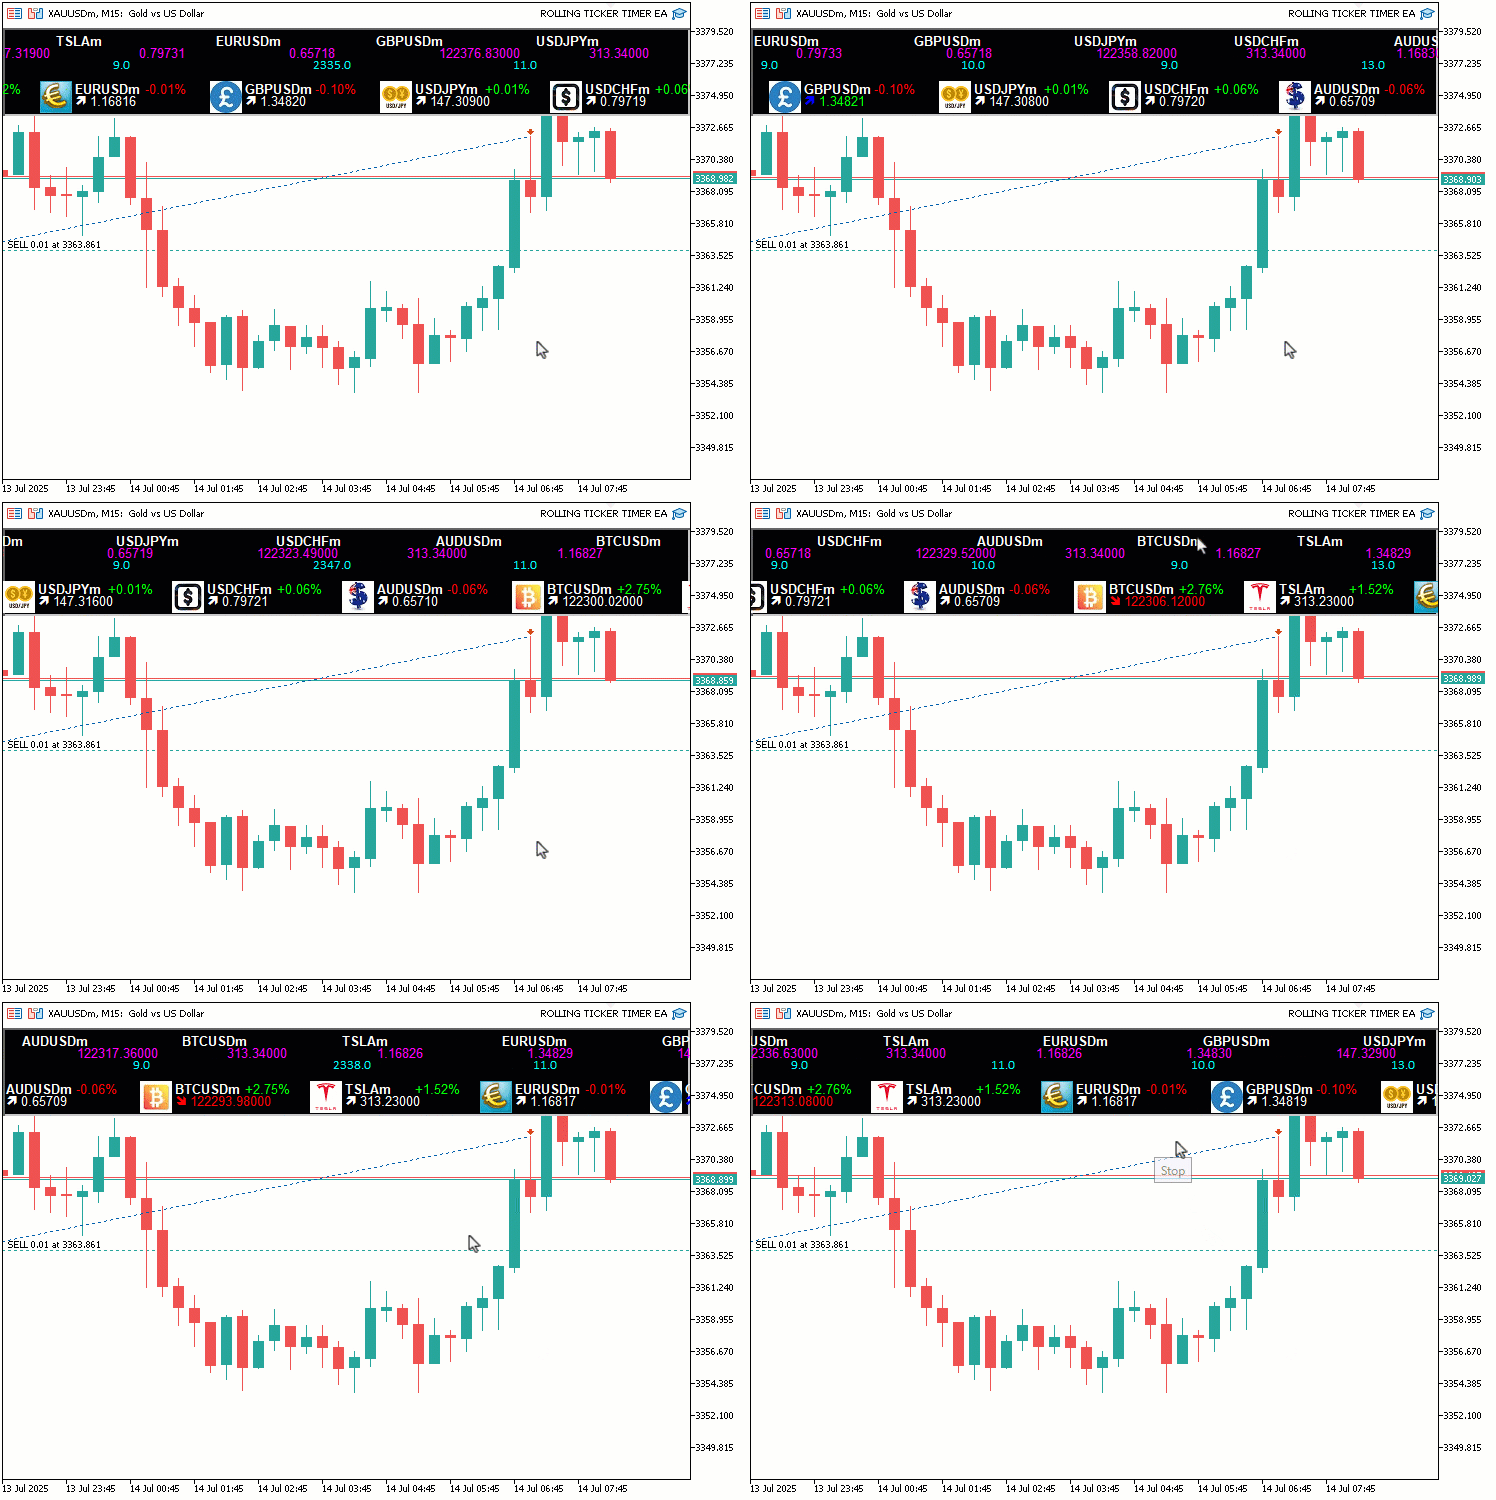
Lo conseguiremos estructurando la visualización en líneas de desplazamiento independientes para los símbolos, los precios, los spreads y las variaciones, utilizando velocidades y colores personalizables para indicar los movimientos al alza o a la baja. Tenemos previsto utilizar arrays para los datos de los símbolos y temporizadores para un desplazamiento fluido, lo que garantizará que el ticker se adapte a las preferencias del usuario y, al mismo tiempo, funcione eficientemente en segundo plano. ¡Pasemos a ver cómo lo ponemos en práctica! En pocas palabras, a continuación se muestra una visualización de lo que queremos conseguir.
Implementación en MQL5
Para crear el programa en MQL5, tendremos que definir los metadatos del programa y, a continuación, definir algunas entradas que nos permitan modificar fácilmente el funcionamiento del programa sin interferir directamente en el código.
//+------------------------------------------------------------------+
//|                                      ROLLING TICKER TIMER EA.mq5 |
//|                           Copyright 2025, Allan Munene Mutiiria. |
//|                                   https://t.me/Forex_Algo_Trader |
//+------------------------------------------------------------------+
#property copyright "Copyright 2025, Allan Munene Mutiiria."
#property link      "https://t.me/Forex_Algo_Trader"
#property version   "1.00"

#include <Arrays\ArrayString.mqh> //--- Include ArrayString library for string array operations

//--- Input parameters
input string Symbols = "EURUSDm,GBPUSDm,USDJPYm,USDCHFm,AUDUSDm,BTCUSDm,TSLAm"; // Symbols to display
input int UpdateInterval = 50;                     // Update interval (milliseconds)
input int SymbolFontSize = 10;                     // Symbol font size (first line)
input string SymbolFont = "Arial Bold";            // Symbol font
input int AskFontSize = 10;                        // Ask font size (second line)
input string AskFont = "Arial";                    // Ask font
input int SpreadFontSize = 10;                     // Spread font size (third line)
input string SpreadFont = "Calibri";               // Spread font
input int SectionFontSize = 10;                    // Section currency, bid, and percent change font size
input string SectionFont = "Arial";                // Section currency, bid, and percent change font
input color FontColor = clrWhite;                  // Base font color
input color UpColor = clrLime;                     // Color for price increase (Bid text and positive % change)
input color DownColor = clrRed;                    // Color for price decrease (Bid text and negative % change)
input color ArrowUpColor = clrBlue;                // Color for up arrow
input color ArrowDownColor = clrRed;               // Color for down arrow
input int Y_Position = 30;                         // Starting Y position (pixels)
input int SymbolHorizontalSpacing = 160;           // Horizontal spacing for Symbol line (pixels)
input int AskHorizontalSpacing = 150;              // Horizontal spacing for Ask line (pixels)
input int SpreadHorizontalSpacing = 200;           // Horizontal spacing for Spread line (pixels)
input int SectionHorizontalSpacing = 170;          // Horizontal spacing for Section line (pixels)
input double SymbolScrollSpeed = 3.0;              // Symbol line scroll speed (pixels per update)
input double AskScrollSpeed = 1.3;                 // Ask line scroll speed (pixels per update)
input double SpreadScrollSpeed = 10.0;             // Spread line scroll speed (pixels per update)
input double SectionScrollSpeed = 2.7;             // Section scroll speed (pixels per update)
input bool ShowSpread = true;                      // Show spread line
input color BackgroundColor = clrBlack;            // Background rectangle color
input int BackgroundOpacity = 100;                 // Background opacity (0-255, limited effect)
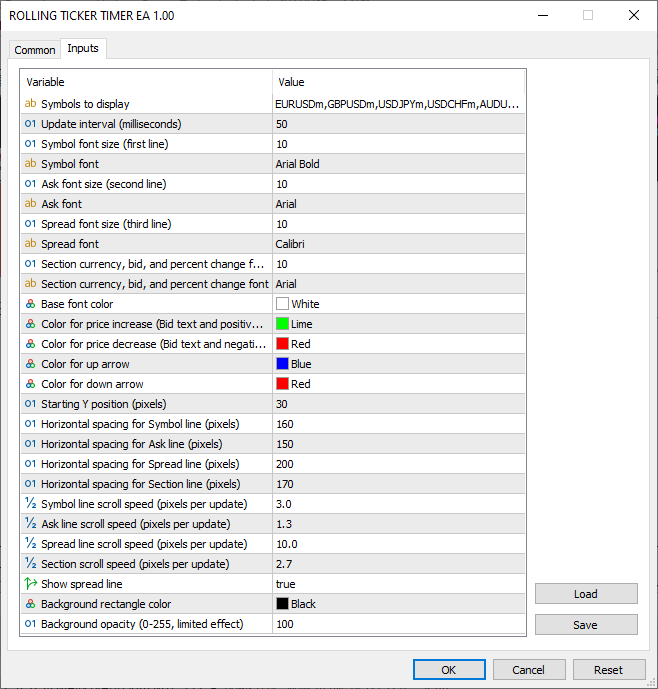
Aquí comenzamos a implementar nuestra cinta de cotizaciones deslizante para la supervisión de símbolos en tiempo real en MQL5, incluyendo la biblioteca «<Arrays\ArrayString.mqh>» y definiendo los parámetros de entrada para su personalización. Incluimos «<Arrays\ArrayString.mqh>» para permitir operaciones eficientes con arrays de cadenas, algo esencial para gestionar y dividir la lista de símbolos que se van a mostrar. El campo de entrada «Symbols» es una cadena de caracteres con el valor «EURUSDm, GBPUSDm, USDJPYm, USDCHFm, AUDUSDm, BTCUSDm, TSLAm» que especifica los símbolos que se van a supervisar, lo que nos permite configurar qué activos aparecen en el ticker. Hemos establecido «UpdateInterval» en 50 milisegundos como frecuencia de actualización, buscando un equilibrio entre la capacidad de respuesta y el rendimiento.
Para la personalización visual, definimos «SymbolFontSize» en 10, «SymbolFont» como «Arial Bold» para la línea de símbolos, «AskFontSize» en 10, «AskFont» como «Arial» para la línea del precio Ask (demanda), «SpreadFontSize» en 10, «SpreadFont» como «Calibri» para la línea del spread, «SectionFontSize» en 10 y «SectionFont» como «Arial» para la sección del símbolo, Bid y variación porcentual.
Establecemos «FontColor» como clrWhite para el texto base, «UpColor» como «clrLime» y «DownColor» como «clrRed» para los cambios de precio, y «ArrowUpColor» como «clrBlue» y «ArrowDownColor» como «clrRed» para las flechas de dirección. Los parámetros de posicionamiento y espaciado incluyen «Y_Position» con un valor de 30 píxeles para la posición vertical inicial, «SymbolHorizontalSpacing» con un valor de 160 píxeles, «AskHorizontalSpacing» con un valor de 150 píxeles, «SpreadHorizontalSpacing» con un valor de 200 píxeles y «SectionHorizontalSpacing» con un valor de 170 píxeles para controlar la maquetación.
Las velocidades de desplazamiento se configuran con «SymbolScrollSpeed» a 3,0 píxeles por actualización, «AskScrollSpeed» a 1,3, «SpreadScrollSpeed» a 10,0 y «SectionScrollSpeed» a 2,7 para un movimiento independiente de las líneas. Establecemos «ShowSpread» en «true» para activar la línea del spread, «BackgroundColor» en «clrBlack» y «BackgroundOpacity» en 100 para el rectángulo de fondo. Estos parámetros de entrada nos permitirán personalizar el aspecto, el funcionamiento y el contenido del ticker para lograr un seguimiento en tiempo real óptimo. Tras la compilación, disponemos de los siguientes conjuntos de datos de entrada.
Una vez definidas las entradas, podemos continuar definiendo algunas variables globales y estructuras que utilizaremos a lo largo del programa y que servirán para almacenar información recurrente para la cinta de cotizaciones, respectivamente.
//--- Global variables
string symbolArray[];                              //--- Array to store symbol names
int totalSymbols;                                  //--- Total number of symbols
struct SymbolData                                  //--- Structure to hold symbol price data
{
   double bid;                                     //--- Current bid price
   double ask;                                     //--- Current ask price
   double spread;                                  //--- Current spread
   double prev_bid;                                //--- Previous bid price
   double daily_open;                              //--- Daily opening price
   color bid_color;                                //--- Color for bid price display
   double percent_change;                          //--- Daily percentage change
   color percent_color;                            //--- Color for percentage change
   string arrow_char;                              //--- Arrow character for price direction
   color arrow_color;                              //--- Color for arrow
};
SymbolData prices[];                               //--- Array of symbol data structures
string dashboardName = "TickerDashboard";          //--- Name for dashboard objects
string backgroundName = "TickerBackground";        //--- Name for background object
CArrayString objManager;                           //--- Object manager for text and image objects
datetime lastDay = 0;                              //--- Track last day for daily open update
Aquí definimos variables globales y una estructura para gestionar los datos de los símbolos y los elementos del panel de control. Declaramos «symbolArray» como un array de cadenas para almacenar los nombres de los símbolos de la entrada «Symbols». El entero «totalSymbols» registrará el número de símbolos tras dividir la cadena de entrada. Definimos la estructura «SymbolData» para almacenar la información de precios de cada símbolo, incluyendo «bid» para el precio de compra actual, «ask» para el precio Ask (demanda) actual, «spread» para el spread calculado, «prev_bid» para la oferta (precio Bid) anterior con el fin de detectar cambios, «daily_open» para el precio de apertura del día, «bid_color» para aplicar un color a la visualización del precio de oferta (Bid), «percent_change» para la variación porcentual diaria, «percent_color» para aplicar un color a la variación, «arrow_char» para las flechas de dirección y «arrow_color» para aplicar un color a las flechas.
Creamos «prices» como una matriz de «SymbolData» estructuras para almacenar los datos de todos los símbolos. La cadena «dashboardName» se establece en «TickerDashboard» para nombrar los objetos del panel de control, y «backgroundName» en «TickerBackground» para el rectángulo de fondo. Utilizamos «CArrayString objManager» para gestionar todos los nombres de los objetos de texto e imagen, lo que facilita su limpieza. Por último, «lastDay», como fecha y hora, registrará el último día para actualizar las aperturas diarias. Estas variables globales organizan los datos de los símbolos y la gestión de objetos, lo que permite actualizaciones y desplazamientos eficientes en tiempo real. A continuación, definiremos algunas funciones de utilidad globales para crear el panel principal de cotizaciones, tal y como se muestra a continuación.
//+------------------------------------------------------------------+
//| Utility Functions                                                |
//+------------------------------------------------------------------+
void LogError(string message)                      // Log error messages
{
   Print(message);                                 //--- Output message to log
}

//+------------------------------------------------------------------+
//| Create Text Label Function                                       |
//+------------------------------------------------------------------+
bool createText(string objName, string text, int x, int y, color clrTxt, int fontsize, string font)
{
   ResetLastError();                               //--- Clear last error code
   if(ObjectFind(0, objName) < 0)                  //--- Check if object does not exist
   {
      if(!ObjectCreate(0, objName, OBJ_LABEL, 0, 0, 0)) //--- Create text label object
      {
         LogError(__FUNCTION__ + ": Failed to create label: " + objName + ", Error: " + IntegerToString(GetLastError())); //--- Log creation failure
         return false;                             //--- Return failure
      }
      objManager.Add(objName);                     //--- Add object name to manager
   }
   ObjectSetInteger(0, objName, OBJPROP_XDISTANCE, x);       //--- Set x-coordinate
   ObjectSetInteger(0, objName, OBJPROP_YDISTANCE, y);       //--- Set y-coordinate
   ObjectSetInteger(0, objName, OBJPROP_CORNER, CORNER_LEFT_UPPER); //--- Set corner alignment
   ObjectSetString(0, objName, OBJPROP_TEXT, text);          //--- Set text content
   ObjectSetInteger(0, objName, OBJPROP_COLOR, clrTxt);      //--- Set text color
   ObjectSetInteger(0, objName, OBJPROP_FONTSIZE, fontsize); //--- Set font size
   ObjectSetString(0, objName, OBJPROP_FONT, font);          //--- Set font type
   ObjectSetInteger(0, objName, OBJPROP_BACK, false);        //--- Disable background
   ObjectSetInteger(0, objName, OBJPROP_SELECTABLE, false);  //--- Disable selection
   ObjectSetInteger(0, objName, OBJPROP_ZORDER, 0);          //--- Set z-order
   return true;                                              //--- Return success
}

//+------------------------------------------------------------------+
//| Create Panel Function                                            |
//+------------------------------------------------------------------+
bool createPanel(string objName, int y, int width, int height, color clr)
{
   ResetLastError();                               //--- Clear last error code
   if(ObjectFind(0, objName) < 0)                  //--- Check if panel does not exist
   {
      if(!ObjectCreate(0, objName, OBJ_RECTANGLE_LABEL, 0, 0, 0)) //--- Create rectangle panel
      {
         LogError(__FUNCTION__ + ": Failed to create panel: " + objName + ", Error: " + IntegerToString(GetLastError())); //--- Log creation failure
         return false;                             //--- Return failure
      }
      objManager.Add(objName);                     //--- Add panel to object manager
   }
   ObjectSetInteger(0, objName, OBJPROP_XDISTANCE, 0);  //--- Set x-coordinate to 0
   ObjectSetInteger(0, objName, OBJPROP_YDISTANCE, y);  //--- Set y-coordinate
   ObjectSetInteger(0, objName, OBJPROP_XSIZE, width);  //--- Set panel width
   ObjectSetInteger(0, objName, OBJPROP_YSIZE, height); //--- Set panel height
   ObjectSetInteger(0, objName, OBJPROP_BGCOLOR, clr);  //--- Set background color
   ObjectSetInteger(0, objName, OBJPROP_FILL, true);    //--- Enable fill
   ObjectSetInteger(0, objName, OBJPROP_COLOR, clr);    //--- Set border color
   ObjectSetInteger(0, objName, OBJPROP_STYLE, STYLE_SOLID); //--- Set border style
   ObjectSetInteger(0, objName, OBJPROP_WIDTH, 1);      //--- Set border width
   ObjectSetInteger(0, objName, OBJPROP_BACK, false);   //--- Enable background drawing
   ObjectSetInteger(0, objName, OBJPROP_ZORDER, -1);    //--- Set z-order behind other objects
   return true;                                         //--- Return success
}
Implementamos funciones de utilidad para gestionar el registro de errores, la creación de etiquetas de texto y la configuración de paneles, lo que garantiza la fiabilidad de los elementos de la interfaz de usuario (UI) y la depuración. Empezamos con la función «LogError», que toma una cadena de texto «message» y la envía al registro mediante la función Print. A continuación, creamos la función «createText» para generar etiquetas de texto para la visualización del teletipo. Acepta como parámetros «objName», «text», «x», «y», «clrTxt», «fontsize» y «font».
Borramos el último error con ResetLastError y comprobamos si el objeto existe mediante la función ObjectFind. Si no es así, creamos una etiqueta con la función ObjectCreate como OBJ_LABEL, registramos los errores y devolvemos «false». Añadimos «objName» a «objManager» para su gestión y, a continuación, configuramos las propiedades mediante ObjectSetInteger para OBJPROP_XDISTANCE y todas las demás propiedades enteras, y mediante «ObjectSetString» para «OBJPROP_TEXT» y «OBJPROP_FONT». Esta función garantizará una visualización coherente del texto para símbolos, precios y variaciones.
A continuación, definimos la función «createPanel» para crear el panel de fondo. Toma como parámetros «objName», «y», «width», «height» y «clr», y utiliza la misma estructura que la función «createText», que proporciona un fondo personalizable para el ticker y permite crear efectos similares a la opacidad mediante la elección del color. Ya podemos pasar a la creación del panel del ticker, pero primero vamos a organizar los datos necesarios, lo que implica dividir la cadena de símbolos en símbolos independientes que podamos utilizar e inicializar los datos de precios y colores. Lo haremos en el controlador de eventos OnInit.
//+------------------------------------------------------------------+
//| Expert initialization function                                   |
//+------------------------------------------------------------------+
int OnInit()
{
   //--- Split symbols string into array
   totalSymbols = StringSplit(Symbols, ',', symbolArray); //--- Split input symbols into array
   ArrayResize(prices, totalSymbols);            //--- Resize prices array to match symbol count

   //--- Verify symbols exist and initialize data
   for(int i = 0; i < totalSymbols; i++)         //--- Iterate through all symbols
   {
      if(!SymbolSelect(symbolArray[i], true))    //--- Select symbol for market watch
      {
         LogError("OnInit: Symbol " + symbolArray[i] + " not found"); //--- Log symbol not found
         return(INIT_FAILED);                    //--- Return initialization failure
      }
      prices[i].bid = 0;                         //--- Initialize bid price
      prices[i].ask = 0;                         //--- Initialize ask price
      prices[i].spread = 0;                      //--- Initialize spread
      prices[i].prev_bid = 0;                    //--- Initialize previous bid
      prices[i].daily_open = iOpen(symbolArray[i], PERIOD_D1, 0); //--- Set daily opening price
      prices[i].bid_color = FontColor;           //--- Set initial bid color
      prices[i].percent_change = 0;              //--- Initialize percentage change
      prices[i].percent_color = FontColor;       //--- Set initial percent color
      prices[i].arrow_char = CharToString(236);  //--- Set default up arrow
      prices[i].arrow_color = FontColor;         //--- Set initial arrow color
   }
   ArrayPrint(symbolArray);
   ArrayPrint(prices);
}
En el controlador de eventos OnInit, inicializamos nuestro programa, configurando símbolos y estructuras de datos. Empezamos dividiendo la cadena de entrada «Symbols» en «symbolArray» mediante la función StringSplit con una coma como delimitador, y almacenamos el número de símbolos en «totalSymbols». Si hubieras definido cualquier otro delimitador, utilízalo aquí. A continuación, ajustamos el tamaño de «prices» a «totalSymbols» utilizando ArrayResize para que se adapte al número de símbolos. A continuación, recorremos cada símbolo de «symbolArray», lo seleccionamos en la ventana Market Watch con SymbolSelect y, si falla, registramos un error con «LogError» y devolvemos «INIT_FAILED».
Para cada símbolo, inicializamos «prices[i].bid», «prices[i].ask», «prices[i].spread», y «prices[i].prev_bid» a 0, establecemos «prices[i].daily_open» en el precio de apertura diario utilizando iOpen en «PERIOD_D1», y asignamos colores y valores iniciales a «prices[i].bid_color», «prices[i].percent_change», «prices[i].percent_color», «prices[i].arrow_char» (utilizando CharToString para una flecha hacia arriba) y «prices[i].arrow_color». Imprimimos «symbolArray» y «prices» con la función ArrayPrint para depurar el código. De este modo se garantiza que todos los símbolos sean válidos y que los datos estén preparados para las actualizaciones en tiempo real. Tras la compilación, obtenemos el siguiente resultado.
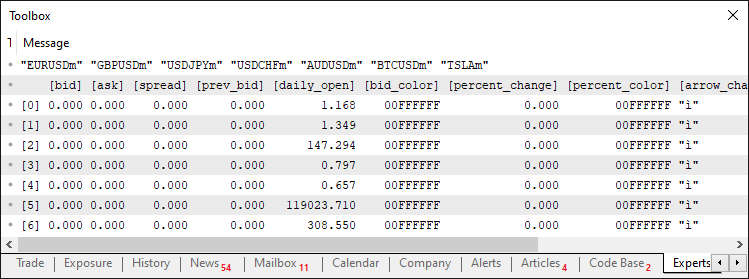
En la imagen podemos ver que hemos inicializado correctamente todos los símbolos y estructuras de datos, lo que significa que ya está todo listo. Ahora podemos crear el fondo del panel de control.
//+------------------------------------------------------------------+
//| Create background function                                       |
//+------------------------------------------------------------------+
void CreateBackground()
{
   int width = (int)ChartGetInteger(0, CHART_WIDTH_IN_PIXELS); //--- Get chart width
   int height = (ShowSpread ? 4 : 3) * (MathMax(MathMax(MathMax(SymbolFontSize, AskFontSize), SpreadFontSize), SectionFontSize) + 2) + 40; //--- Calculate panel height
   createPanel(backgroundName, Y_Position - 5, width, height, BackgroundColor); //--- Create background panel
}
Aquí implementamos la función «CreateBackground» y configuramos el panel de fondo para la visualización del ticker. Empezamos obteniendo el ancho del gráfico con la función ChartGetInteger, utilizando CHART_WIDTH_IN_PIXELS, y convirtiéndolo a un entero en «width». Calculamos la altura del panel en «height» utilizando un operador ternario sobre «ShowSpread» para determinar si hay 4 o 3 líneas, multiplicando por el tamaño máximo de fuente de «SymbolFontSize», «AskFontSize», «SpreadFontSize» y «SectionFontSize» (más 2 para el relleno) y sumando 40 para el espacio adicional. Por último, llamamos a la función «createPanel» con «backgroundName», «Y_Position - 5» para la alineación vertical, «width», «height» y «BackgroundColor» para dibujar el rectángulo de fondo, lo que proporciona una base uniforme para los elementos de texto que se desplazan. Cuando llamamos a la función durante la inicialización, obtenemos el siguiente resultado.
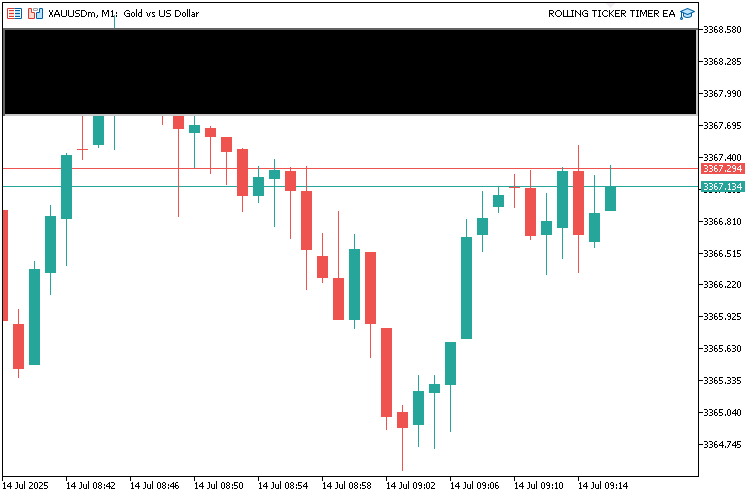
Una vez creado el fondo, podemos continuar creando los demás elementos del panel de control. Creamos una función para albergar todo como se muestra a continuación.
//+------------------------------------------------------------------+
//| Create dashboard function                                        |
//+------------------------------------------------------------------+
void CreateDashboard()
{
   //--- Create text and image objects for each symbol
   for(int i = 0; i < totalSymbols; i++)         //--- Iterate through all symbols
   {
      // Determine image based on symbol
      string imageFile;                          //--- Variable for image file path
      if(symbolArray[i] == "EURUSDm")            //--- Check for EURUSDm
         imageFile = "\\Images\\euro.bmp";       //--- Set EURUSD image
      else if(symbolArray[i] == "GBPUSDm")       //--- Check for GBPUSDm
         imageFile = "\\Images\\gbpusd.bmp";     //--- Set GBPUSD image
      else if(symbolArray[i] == "USDJPYm")       //--- Check for USDJPYm
         imageFile = "\\Images\\usdjpy.bmp";     //--- Set USDJPY image
      else if(symbolArray[i] == "USDCHFm")       //--- Check for USDCHFm
         imageFile = "\\Images\\usdchf.bmp";     //--- Set USDCHF image
      else if(symbolArray[i] == "AUDUSDm")       //--- Check for AUDUSDm
         imageFile = "\\Images\\audusd.bmp";     //--- Set AUDUSD image
      else if(symbolArray[i] == "BTCUSDm")       //--- Check for BTCUSDm
         imageFile = "\\Images\\btcusd.bmp";     //--- Set BTCUSD image
      else if(symbolArray[i] == "TSLAm")         //--- Check for TSLAm
         imageFile = "\\Images\\tesla.bmp";      //--- Set Tesla image
      else
         imageFile = "\\Images\\euro.bmp";       //--- Set default image

      // Symbol line (first line)
      createText(dashboardName + "_Symbol_" + IntegerToString(i), "", (i * SymbolHorizontalSpacing), Y_Position, FontColor, SymbolFontSize, SymbolFont); //--- Create symbol text label

      // Ask line (second line)
      createText(dashboardName + "_Ask_" + IntegerToString(i), "", (i * AskHorizontalSpacing), Y_Position + SymbolFontSize + 2, FontColor, AskFontSize, AskFont); //--- Create ask price text label

      // Spread line (third line, if enabled)
      if(ShowSpread)                             //--- Check if spread display is enabled
      {
         createText(dashboardName + "_Spread_" + IntegerToString(i), "", (i * SpreadHorizontalSpacing), Y_Position + SymbolFontSize + 2 + AskFontSize + 2, FontColor, SpreadFontSize, SpreadFont); //--- Create spread text label
      }

      // Section: Image (left)
      string imageName = dashboardName + "_Image_" + IntegerToString(i); //--- Define image object name
      if(ObjectFind(0, imageName) < 0)           //--- Check if image object does not exist
      {
         if(!ObjectCreate(0, imageName, OBJ_BITMAP_LABEL, 0, 0, 0)) //--- Create image object
         {
            LogError("CreateDashboard: Failed to create image: " + imageName + ", Error: " + IntegerToString(GetLastError())); //--- Log image creation failure
            return;                              //--- Exit function
         }
         objManager.Add(imageName);              //--- Add image to object manager
      }
      ObjectSetInteger(0, imageName, OBJPROP_XDISTANCE, (i * SectionHorizontalSpacing)); //--- Set image x-coordinate
      ObjectSetInteger(0, imageName, OBJPROP_YDISTANCE, Y_Position + (ShowSpread ? SymbolFontSize + 2 + AskFontSize + 2 + SpreadFontSize + 14 : SymbolFontSize + 2 + AskFontSize + 14)); //--- Set image y-coordinate
      ObjectSetString(0, imageName, OBJPROP_BMPFILE, imageFile); //--- Set image file
      ObjectSetInteger(0, imageName, OBJPROP_CORNER, CORNER_LEFT_UPPER); //--- Set image corner alignment

      // Section: Currency (top, right of image)
      string currencyName = dashboardName + "_Currency_" + IntegerToString(i); //--- Define currency text object name
      createText(currencyName, StringFormat("%-10s", symbolArray[i]), (i * SectionHorizontalSpacing) + 35, Y_Position + (ShowSpread ? SymbolFontSize + 2 + AskFontSize + 2 + SpreadFontSize + 14 : SymbolFontSize + 2 + AskFontSize + 14), FontColor, SectionFontSize, SectionFont); //--- Create currency text label

      // Section: Percent Change (next to currency, horizontal)
      string percentChangeName = dashboardName + "_PercentChange_" + IntegerToString(i); //--- Define percent change object name
      string percentText = prices[i].percent_change >= 0 ? StringFormat("+%.2f%%", prices[i].percent_change) : StringFormat("%.2f%%", prices[i].percent_change); //--- Format percent change text
      createText(percentChangeName, percentText, (i * SectionHorizontalSpacing) + 105, Y_Position + (ShowSpread ? SymbolFontSize + 2 + AskFontSize + 2 + SpreadFontSize + 14 : SymbolFontSize + 2 + AskFontSize + 14), prices[i].percent_color, SectionFontSize, SectionFont); //--- Create percent change text label

      // Section: Arrow (below currency, right of image, Wingdings)
      string arrowName = dashboardName + "_Arrow_" + IntegerToString(i); //--- Define arrow object name
      createText(arrowName, prices[i].arrow_char, (i * SectionHorizontalSpacing) + 35, Y_Position + (ShowSpread ? SymbolFontSize + 2 + AskFontSize + 2 + SpreadFontSize + 14 : SymbolFontSize + 2 + AskFontSize + 14) + SectionFontSize + 2, prices[i].arrow_color, SectionFontSize, "Wingdings"); //--- Create arrow text label

      // Section: Bid Price (next to arrow, horizontal)
      string bidName = dashboardName + "_Bid_" + IntegerToString(i); //--- Define bid price object name
      createText(bidName, StringFormat("%.5f", prices[i].bid), (i * SectionHorizontalSpacing) + 50, Y_Position + (ShowSpread ? SymbolFontSize + 2 + AskFontSize + 2 + SpreadFontSize + 14 : SymbolFontSize + 2 + AskFontSize + 14) + SectionFontSize + 2, prices[i].bid_color, SectionFontSize, SectionFont); //--- Create bid price text label
   }
}
Aquí implementamos la función «CreateDashboard» para configurar los elementos visuales del ticker, incluidas las etiquetas de texto y las imágenes correspondientes a cada símbolo. Empezamos recorriendo el bucle de «totalSymbols» y determinando «imageFile» en función de «symbolArray[i]» mediante condiciones «if-else», asignando archivos Bitmap (BMP) específicos a símbolos como «EURUSDm» o un valor por defecto para los demás. Creamos el texto de la línea del símbolo con «createText» para «dashboardName + «Symbol» + IntegerToString(i)», situado en «(i * SymbolHorizontalSpacing)» y «Y_Position».
Para la línea «Ask», creamos otra etiqueta de texto con «createText» para «dashboardName + “Ask” + IntegerToString(i)», situada en «(i * AskHorizontalSpacing)» y «Y_Position + SymbolFontSize + 2». Si «ShowSpread» es «true», añadimos una línea de texto con «createText» que indica «dashboardName + «Spread» + IntegerToString(i)», colocada en la posición correspondiente.
Para esta sección, creamos un objeto de imagen con la función ObjectCreate como OBJ_BITMAP_LABEL; si no existe, lo añadimos a «objManager», establecemos su posición con «ObjectSetInteger» y le asignamos «imageFile» mediante la función «ObjectSetString». Ten en cuenta que necesitas los archivos de imagen en formato BMP. Hemos utilizado el directorio predeterminado tal y como se indica a continuación, pero puedes utilizar el que prefieras.
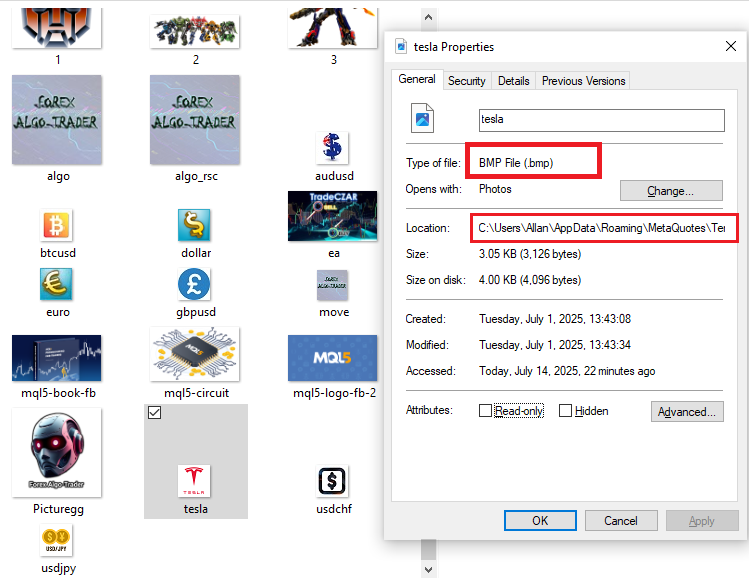
A continuación, creamos el texto de la divisa con «createText» utilizando la expresión «dashboardName + «Currency» + IntegerToString(i)», formateada con la función StringFormat. Para calcular la variación porcentual, damos formato a «percentText» basándonos en «prices[i].percent_change» y generamos el texto con «createText». Añadimos una etiqueta de flecha con el texto «createText» utilizando «prices[i].arrow_char» y la fuente «Wingdings». Por último, generamos el texto del precio de compra con «createText», utilizando «StringFormat» para «prices[i].bid». Esta función creará un diseño de ticker de varias líneas con imágenes y texto dinámico para mostrar datos en tiempo real que se desplazan. Ahora, basta con llamar a la función durante la inicialización, y este es el resultado que obtenemos.
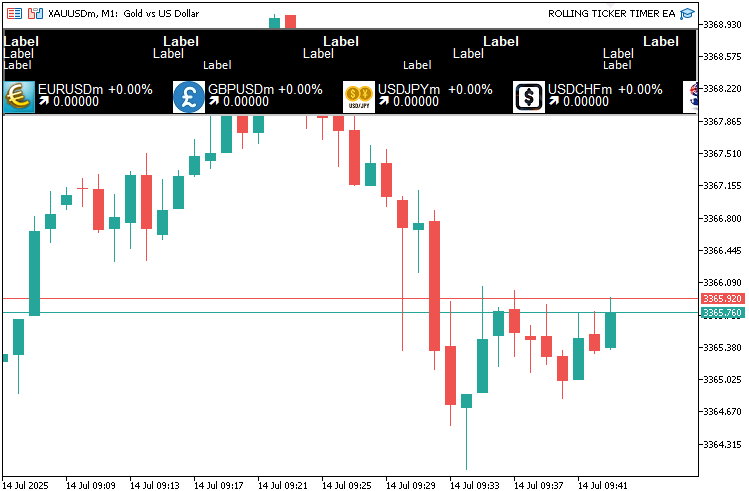
Lo que obtenemos es un panel de control estático. El siguiente paso es actualizar el panel de control. Para las actualizaciones en tiempo real, no queremos depender de actualizaciones basadas en ticks, ya que eso dependería por completo de la frecuencia de los ticks del símbolo al que está vinculado el programa. Lo que queremos hacer es utilizar actualizaciones basadas en temporizadores para que las actualizaciones se realicen con frecuencia. Primero, definamos las funciones para actualizar el panel de control y el fondo cuando sea necesario.
//+------------------------------------------------------------------+
//| Update background function                                       |
//+------------------------------------------------------------------+
void UpdateBackground()
{
   int width = (int)ChartGetInteger(0, CHART_WIDTH_IN_PIXELS); //--- Get current chart width
   int height = (ShowSpread ? 4 : 3) * (MathMax(MathMax(MathMax(SymbolFontSize, AskFontSize), SpreadFontSize), SectionFontSize) + 2) + 40; //--- Recalculate panel height
   ObjectSetInteger(0, backgroundName, OBJPROP_XSIZE, width);  //--- Update panel width
   ObjectSetInteger(0, backgroundName, OBJPROP_YSIZE, height); //--- Update panel height
}

//+------------------------------------------------------------------+
//| Update dashboard function                                        |
//+------------------------------------------------------------------+
void UpdateDashboard()
{
   static double symbolOffset = 0;                //--- Track symbol line offset
   static double askOffset = 0;                   //--- Track ask line offset
   static double spreadOffset = 0;                //--- Track spread line offset
   static double sectionOffset = 0;               //--- Track section offset
   int totalWidthSymbol = totalSymbols * SymbolHorizontalSpacing;   //--- Calculate total symbol line width
   int totalWidthAsk = totalSymbols * AskHorizontalSpacing;         //--- Calculate total ask line width
   int totalWidthSpread = totalSymbols * SpreadHorizontalSpacing;   //--- Calculate total spread line width
   int totalWidthSection = totalSymbols * SectionHorizontalSpacing; //--- Calculate total section width
   int rightEdge = (int)ChartGetInteger(0, CHART_WIDTH_IN_PIXELS);  //--- Get chart right boundary

   //--- Update text and image objects
   for(int i = 0; i < totalSymbols; i++)         //--- Iterate through all symbols
   {
      // Symbol line (first line)
      string symbolName = dashboardName + "_Symbol_" + IntegerToString(i); //--- Define symbol object name
      double symbolXPos = (i * SymbolHorizontalSpacing) - symbolOffset; //--- Calculate symbol x-position
      if(symbolXPos < -SymbolHorizontalSpacing) symbolXPos += totalWidthSymbol; //--- Wrap around if off-screen
      createText(symbolName, StringFormat("%-10s", symbolArray[i]), (int)symbolXPos, Y_Position, FontColor, SymbolFontSize, SymbolFont); //--- Update symbol text
      ObjectSetInteger(0, symbolName, OBJPROP_HIDDEN, symbolXPos > rightEdge || symbolXPos < 0); //--- Hide if off-screen

      // Ask line (second line)
      string askName = dashboardName + "_Ask_" + IntegerToString(i); //--- Define ask object name
      double askXPos = (i * AskHorizontalSpacing) - askOffset;       //--- Calculate ask x-position
      if(askXPos < -AskHorizontalSpacing) askXPos += totalWidthAsk;  //--- Wrap around if off-screen
      createText(askName, StringFormat("%.5f", prices[i].ask), (int)askXPos, Y_Position + SymbolFontSize + 2, clrMagenta, AskFontSize, AskFont); //--- Update ask text
      ObjectSetInteger(0, askName, OBJPROP_HIDDEN, askXPos > rightEdge || askXPos < 0); //--- Hide if off-screen

      // Spread line (third line)
      if(ShowSpread)                             //--- Check if spread display is enabled
      {
         string spreadName = dashboardName + "_Spread_" + IntegerToString(i);      //--- Define spread object name
         double spreadXPos = (i * SpreadHorizontalSpacing) - spreadOffset;         //--- Calculate spread x-position
         if(spreadXPos < -SpreadHorizontalSpacing) spreadXPos += totalWidthSpread; //--- Wrap around if off-screen
         createText(spreadName, StringFormat("%.1f", prices[i].spread), (int)spreadXPos, Y_Position + SymbolFontSize + 2 + AskFontSize + 2, clrAqua, SpreadFontSize, SpreadFont); //--- Update spread text
         ObjectSetInteger(0, spreadName, OBJPROP_HIDDEN, spreadXPos > rightEdge || spreadXPos < 0); //--- Hide if off-screen
      }

      // Section (Image, Currency, Percent Change, Arrow, Bid Price)
      double sectionXPos = (i * SectionHorizontalSpacing) - sectionOffset;          //--- Calculate section x-position
      if(sectionXPos < -SectionHorizontalSpacing) sectionXPos += totalWidthSection; //--- Wrap around if off-screen

      // Image (left)
      string imageName = dashboardName + "_Image_" + IntegerToString(i); //--- Define image object name
      ObjectSetInteger(0, imageName, OBJPROP_XDISTANCE, (int)sectionXPos); //--- Update image x-coordinate
      ObjectSetInteger(0, imageName, OBJPROP_YDISTANCE, Y_Position + (ShowSpread ? SymbolFontSize + 2 + AskFontSize + 2 + SpreadFontSize + 14 : SymbolFontSize + 2 + AskFontSize + 14)); //--- Update image y-coordinate
      ObjectSetInteger(0, imageName, OBJPROP_HIDDEN, sectionXPos > rightEdge || sectionXPos < 0); //--- Hide if off-screen

      // Currency (top, right of image)
      string currencyName = dashboardName + "_Currency_" + IntegerToString(i); //--- Define currency object name
      createText(currencyName, StringFormat("%-10s", symbolArray[i]), (int)sectionXPos + 35, Y_Position + (ShowSpread ? SymbolFontSize + 2 + AskFontSize + 2 + SpreadFontSize + 14 : SymbolFontSize + 2 + AskFontSize + 14), FontColor, SectionFontSize, "Arial Bold"); //--- Update currency text

      // Percent Change (next to currency, horizontal)
      string percentChangeName = dashboardName + "_PercentChange_" + IntegerToString(i); //--- Define percent change object name
      string percentText = prices[i].percent_change >= 0 ? StringFormat("+%.2f%%", prices[i].percent_change) : StringFormat("%.2f%%", prices[i].percent_change); //--- Format percent change
      createText(percentChangeName, percentText, (int)sectionXPos + 105, Y_Position + (ShowSpread ? SymbolFontSize + 2 + AskFontSize + 2 + SpreadFontSize + 14 : SymbolFontSize + 2 + AskFontSize + 14), prices[i].percent_color, SectionFontSize, SectionFont); //--- Update percent change text

      // Arrow (below currency, right of image, Wingdings)
      string arrowName = dashboardName + "_Arrow_" + IntegerToString(i); //--- Define arrow object name
      createText(arrowName, prices[i].arrow_char, (int)sectionXPos + 35, Y_Position + (ShowSpread ? SymbolFontSize + 2 + AskFontSize + 2 + SpreadFontSize + 14 : SymbolFontSize + 2 + AskFontSize + 14) + SectionFontSize + 2, prices[i].arrow_color, SectionFontSize, "Wingdings"); //--- Update arrow text

      // Bid Price (next to arrow, horizontal)
      string bidName = dashboardName + "_Bid_" + IntegerToString(i); //--- Define bid object name
      createText(bidName, StringFormat("%.5f", prices[i].bid), (int)sectionXPos + 50, Y_Position + (ShowSpread ? SymbolFontSize + 2 + AskFontSize + 2 + SpreadFontSize + 14 : SymbolFontSize + 2 + AskFontSize + 14) + SectionFontSize + 2, prices[i].bid_color, SectionFontSize, SectionFont); //--- Update bid price text
   }

   //--- Increment offsets for scrolling effect
   symbolOffset = fmod(symbolOffset + SymbolScrollSpeed, totalWidthSymbol);     //--- Update symbol line offset
   askOffset = fmod(askOffset + AskScrollSpeed, totalWidthAsk);                 //--- Update ask line offset
   spreadOffset = fmod(spreadOffset + SpreadScrollSpeed, totalWidthSpread);     //--- Update spread line offset
   sectionOffset = fmod(sectionOffset + SectionScrollSpeed, totalWidthSection); //--- Update section offset

   //--- Redraw chart
   ChartRedraw();                                //--- Refresh chart display
}
Aquí implementamos la función «UpdateBackground» para ajustar el panel de fondo cuando se cambia el tamaño del gráfico. Recuperamos el ancho actual del gráfico con la función ChartGetInteger utilizando CHART_WIDTH_IN_PIXELS y lo convertimos a un entero en «width». Recalculamos la altura del panel en «height» utilizando un operador ternario sobre «ShowSpread» para determinar si hay 4 o 3 líneas, multiplicando por el tamaño máximo de fuente de «SymbolFontSize», «AskFontSize», «SpreadFontSize» y «SectionFontSize» (más 2 para el relleno) y sumando 40 para el espacio adicional. Por último, actualizamos las dimensiones del panel con ObjectSetInteger para «OBJPROP_XSIZE» y OBJPROP_YSIZE en «backgroundName».
A continuación, implementamos la función «UpdateDashboard» para gestionar el desplazamiento y las actualizaciones de los objetos de texto e imagen. Definimos los desplazamientos estáticos «symbolOffset», «askOffset», «spreadOffset» y «sectionOffset» para realizar un seguimiento de las posiciones de las líneas. Calculamos las anchuras totales «totalWidthSymbol», «totalWidthAsk», «totalWidthSpread» y «totalWidthSection» multiplicando «totalSymbols» por los valores de espaciado correspondientes. Obtenemos el borde derecho del gráfico con «ChartGetInteger» utilizando «CHART_WIDTH_IN_PIXELS». Recorremos «totalSymbols», actualizando la posición de cada símbolo con «symbolXPos» ajustada mediante «symbolOffset», aplicando el módulo si está fuera de visualización, y llamamos a «createText» para actualizar el texto, ocultándolo con «ObjectSetInteger» para «OBJPROP_HIDDEN» si está fuera de «rightEdge».
Realizamos actualizaciones similares para los elementos «ask», «spread» (si se ha activado «ShowSpread») y «section», incluyendo imágenes con «ObjectSetInteger» para OBJPROP_XDISTANCE y «OBJPROP_YDISTANCE», la divisa, el porcentaje de variación (formateado con StringFormat), la flecha (utilizando «prices[i].arrow_char») y el texto del precio de compra (Bid). Incrementamos los desplazamientos con «fmod» utilizando las velocidades de desplazamiento y llamamos a ChartRedraw para actualizar la visualización. Estas funciones garantizarán que el ticker se adapte a los cambios y se desplace con fluidez para permitir un seguimiento en tiempo real. A continuación, podemos llamar al controlador de eventos OnTimer, pero antes tendremos que configurar el intervalo del temporizador. Esto es importante.
//--- Set timer
EventSetMillisecondTimer(UpdateInterval);     //--- Set timer for updates

//--- Initialize last day
lastDay = TimeCurrent() / 86400;              //--- Set current day for daily open tracking
Aquí, simplemente configuramos el intervalo del temporizador llamando a la función EventSetMillisecondTimer y pasándole el intervalo de actualización definido; por último, inicializamos la variable del último día para el seguimiento del nuevo día. Ahora podemos definir la lógica del temporizador.
//+------------------------------------------------------------------+
//| Expert timer function                                            |
//+------------------------------------------------------------------+
void OnTimer()
{
   //--- Check for new day to update daily open
   datetime currentDay = TimeCurrent() / 86400;  //--- Calculate current day
   if(currentDay > lastDay)                      //--- Check if new day
   {
      for(int i = 0; i < totalSymbols; i++)      //--- Iterate through symbols
      {
         prices[i].daily_open = iOpen(symbolArray[i], PERIOD_D1, 0); //--- Update daily open price
      }
      lastDay = currentDay;                      //--- Update last day
   }

   //--- Update background size in case chart is resized
   UpdateBackground();                           //--- Update background dimensions

   //--- Update dashboard display
   UpdateDashboard();                            //--- Update dashboard visuals
}
Aquí implementamos el controlador de eventos OnTimer para gestionar las actualizaciones periódicas en nuestra cinta de cotizaciones deslizante para la supervisión de símbolos en tiempo real, que se activa en el intervalo establecido por «UpdateInterval». Empezamos calculando «currentDay» como TimeCurrent dividido entre 86 400 para obtener el día en segundos, que equivale a 1 día * 24 horas * 60 minutos * 60 segundos. Si «currentDay» es mayor que «lastDay», recorremos «totalSymbols» y actualizamos «prices[i].daily_open» para cada símbolo utilizando iOpen en «PERIOD_D1» con desplazamiento 0; a continuación, establecemos «lastDay» en «currentDay» para hacer un seguimiento del nuevo día. Esto garantiza que las variaciones porcentuales diarias se reinicien correctamente a medianoche.
A continuación, llamamos a «UpdateBackground» para ajustar el panel de fondo si se cambia el tamaño del gráfico. Por último, llamamos a «UpdateDashboard» para actualizar todos los objetos de texto e imagen con los datos actuales y las posiciones de desplazamiento, de modo que el ticker se mantenga dinámico y se adapte a los cambios que se producen con el paso del tiempo. Obtenemos el siguiente resultado.
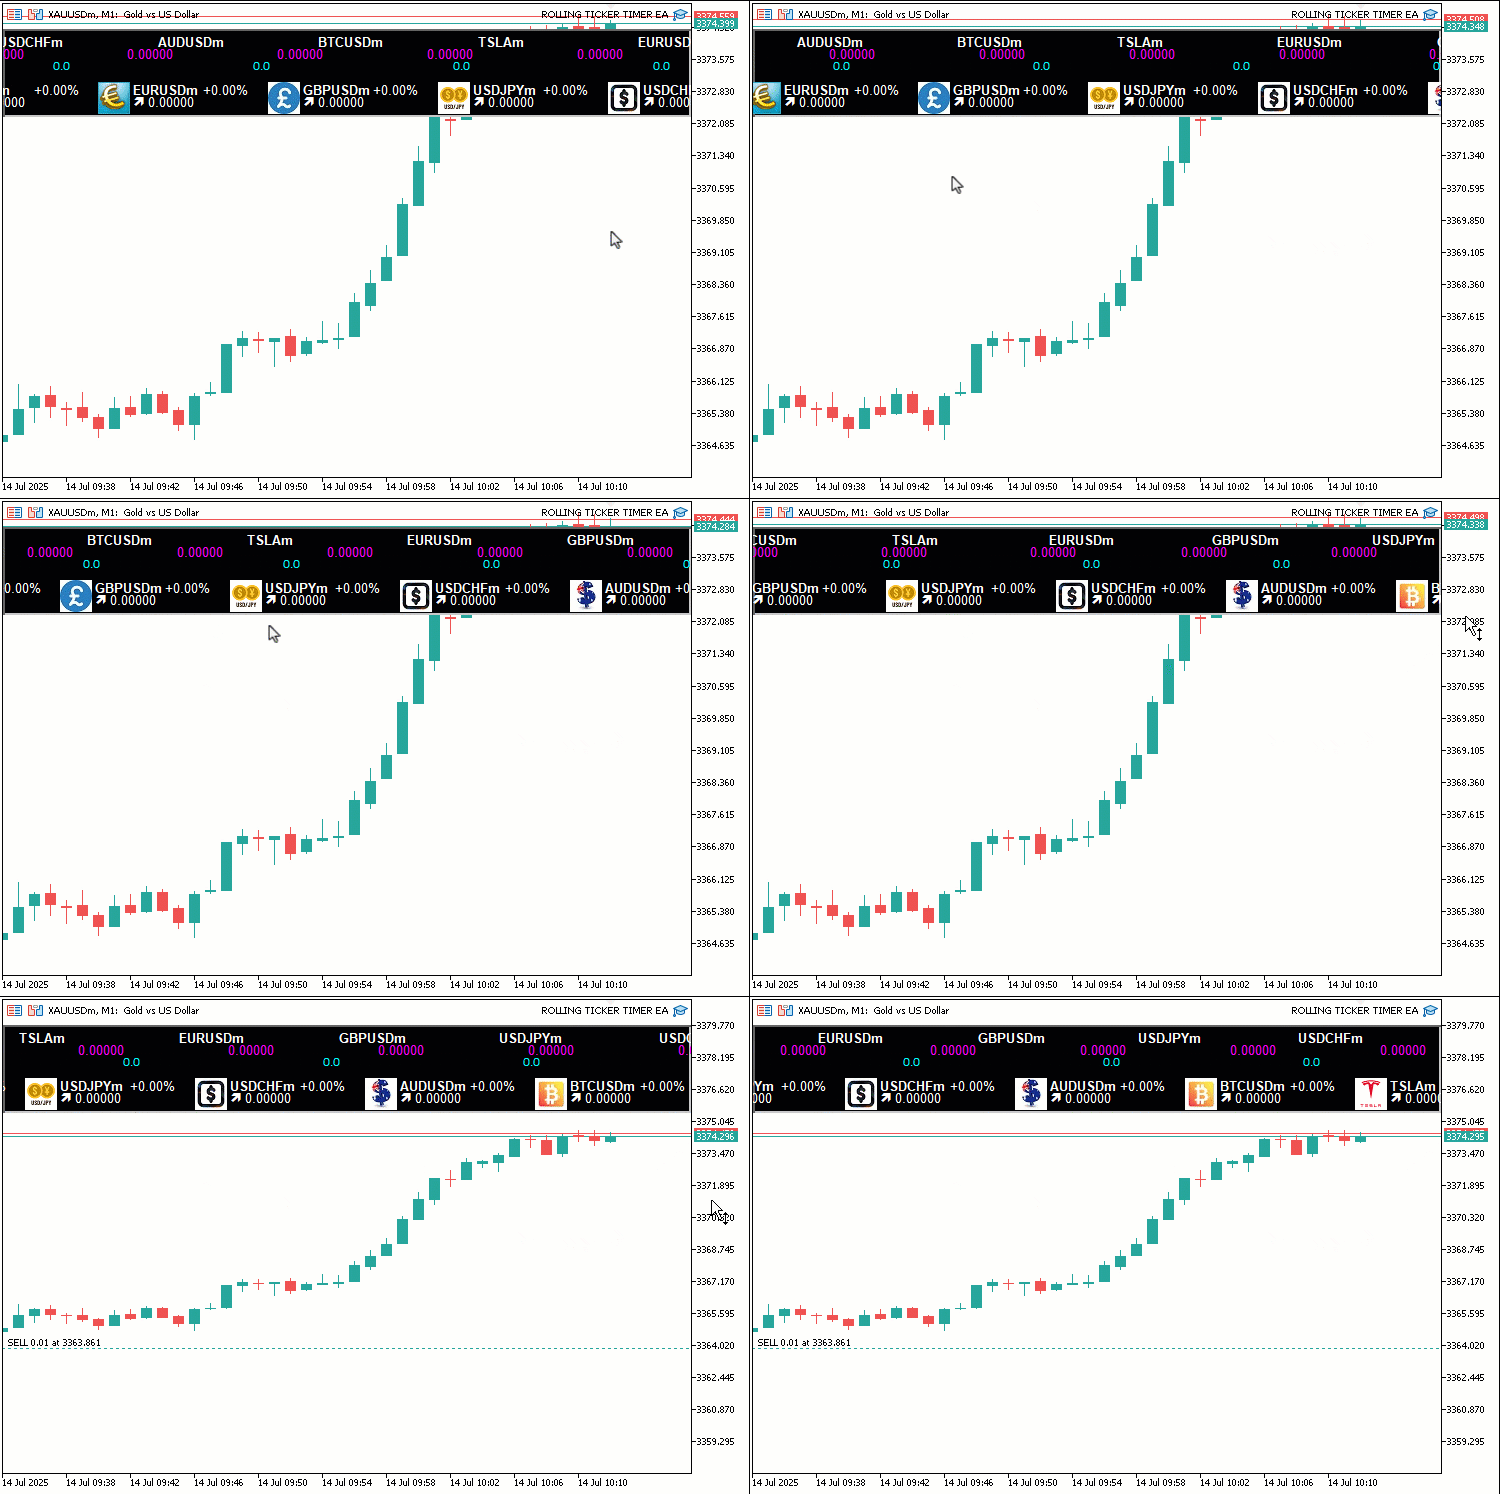
En la imagen podemos ver que tenemos una cinta que se está moviendo. Ahora tenemos que actualizar los precios, y con eso ya está todo. Pongamos también esa lógica de actualización en una función.
//+------------------------------------------------------------------+
//| Update prices function                                           |
//+------------------------------------------------------------------+
void UpdatePrices()
{
   for(int i = 0; i < totalSymbols; i++)         //--- Iterate through all symbols
   {
      double bid = SymbolInfoDouble(symbolArray[i], SYMBOL_BID); //--- Retrieve current bid price
      double ask = SymbolInfoDouble(symbolArray[i], SYMBOL_ASK); //--- Retrieve current ask price

      //--- Validate prices
      if(bid == 0 || ask == 0)                   //--- Check for invalid prices
      {
         LogError("UpdatePrices: Failed to retrieve prices for " + symbolArray[i]); //--- Log price retrieval failure
         continue;                               //--- Skip to next symbol
      }

      //--- Update color and arrow based on price change (tick-to-tick for bid and arrow)
      if(bid > prices[i].prev_bid && prices[i].prev_bid != 0) //--- Check if bid increased
      {
         prices[i].bid_color = UpColor;            //--- Set bid color to up color
         prices[i].arrow_char = CharToString(236); //--- Set up arrow character
         prices[i].arrow_color = ArrowUpColor;     //--- Set arrow to up color
      }
      else if(bid < prices[i].prev_bid && prices[i].prev_bid != 0) //--- Check if bid decreased
      {
         prices[i].bid_color = DownColor;          //--- Set bid color to down color
         prices[i].arrow_char = CharToString(238); //--- Set down arrow character
         prices[i].arrow_color = ArrowDownColor;   //--- Set arrow to down color
      }
      else                                         //--- Handle no change or first tick
      {
         prices[i].bid_color = FontColor;          //--- Set bid color to default
         prices[i].arrow_char = CharToString(236); //--- Set default up arrow
         prices[i].arrow_color = FontColor;        //--- Set arrow to default color
      }

      //--- Calculate daily percentage change
      prices[i].percent_change = prices[i].daily_open != 0 ? ((bid - prices[i].daily_open) / prices[i].daily_open) * 100 : 0; //--- Compute percentage change
      prices[i].percent_color = prices[i].percent_change >= 0 ? UpColor : DownColor; //--- Set percent color based on change

      //--- Update data
      prices[i].bid = bid;                       //--- Store current bid
      prices[i].ask = ask;                       //--- Store current ask
      prices[i].spread = (ask - bid) * MathPow(10, SymbolInfoInteger(symbolArray[i], SYMBOL_DIGITS)); //--- Calculate spread
      prices[i].prev_bid = bid;                  //--- Update previous bid
   }
}
Implementamos la función «UpdatePrices» para actualizar los datos de los símbolos. Recorremos «totalSymbols» y obtenemos los valores de «bid» y «ask» para cada «symbolArray[i]» utilizando la función «SymbolInfoDouble» con SYMBOL_BID y «SYMBOL_ASK». Si «bid» o «ask» es 0, registramos un error con «LogError» y pasamos al siguiente símbolo. Actualizamos «bid_color», «arrow_char» (utilizando la función CharToString para las flechas arriba y abajo) y «arrow_color» en función de si «bid» es mayor, menor o igual que «prev_bid» (sin tener en cuenta el 0 inicial). Las flechas siguen la estructura predeterminada de Wingdings en MQL5, que es la siguiente.
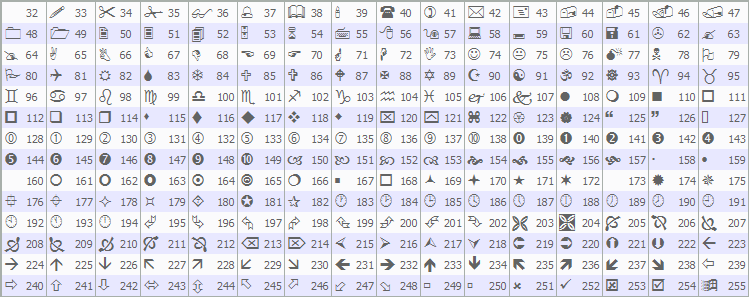
No obstante, puedes usar el código de flecha que más te guste. A continuación, calculamos «percent_change» utilizando «daily_open» y establecemos «percent_color» mediante un operador ternario para indicar si el valor ha subido o bajado. Por último, actualizamos «prices[i].bid», «prices[i].ask» y «spread» (calculados con MathPow y SymbolInfoInteger para «SYMBOL_DIGITS») y «prev_bid», garantizando que los datos que se muestran y los cambios sean actuales, y manteniendo actualizados los precios y los indicadores del ticker en cada tick. Ahora llamamos a la función en cada tick para procesar los cambios de precio, aunque también se podría llamar desde la función «on-timer». La elección vuelve a quedar en tus manos.
//+------------------------------------------------------------------+
//| Expert tick function                                             |
//+------------------------------------------------------------------+
void OnTick()
{
   //--- Update prices on every tick for live changes
   UpdatePrices();                               //--- Update symbol prices
}

//+------------------------------------------------------------------+
//| Expert deinitialization function                                 |
//+------------------------------------------------------------------+
void OnDeinit(const int reason)
{
   //--- Clean up objects
   for(int i = objManager.Total() - 1; i >= 0; i--) //--- Iterate through all managed objects
   {
      string name = objManager.At(i);               //--- Get object name
      if(ObjectFind(0, name) >= 0)                  //--- Check if object exists
      {
         if(!ObjectDelete(0, name))                 //--- Delete object
            LogError("OnDeinit: Failed to delete object: " + name + ", Error: " + IntegerToString(GetLastError())); //--- Log deletion failure
      }
      objManager.Delete(i);                        //--- Remove object from manager
   }
   EventKillTimer();                               //--- Stop timer
}
En el controlador de eventos OnTick, llamamos a «UpdatePrices» para actualizar los datos de oferta, demanda, spread y variación de todos los símbolos, lo que garantiza que el ticker refleje con rapidez los movimientos del mercado en tiempo real. A continuación, implementamos la función OnDeinit para realizar la limpieza cuando se elimine el programa. Recorremos «objManager» hacia atrás utilizando «Total» y obtenemos el «nombre» de cada objeto con «At». Si el objeto existe mediante ObjectFind, lo eliminamos con la función ObjectDelete y, en caso de fallo, registramos el error con «LogError». Eliminamos el nombre de «objManager» con el operador Delete. Por último, detenemos el temporizador con EventKillTimer para poner fin a las actualizaciones periódicas. Esto es importante. De este modo se garantiza que todos los objetos se eliminen correctamente, evitando que queden elementos residuales en el gráfico. Al ejecutar el programa, obtenemos el siguiente resultado.
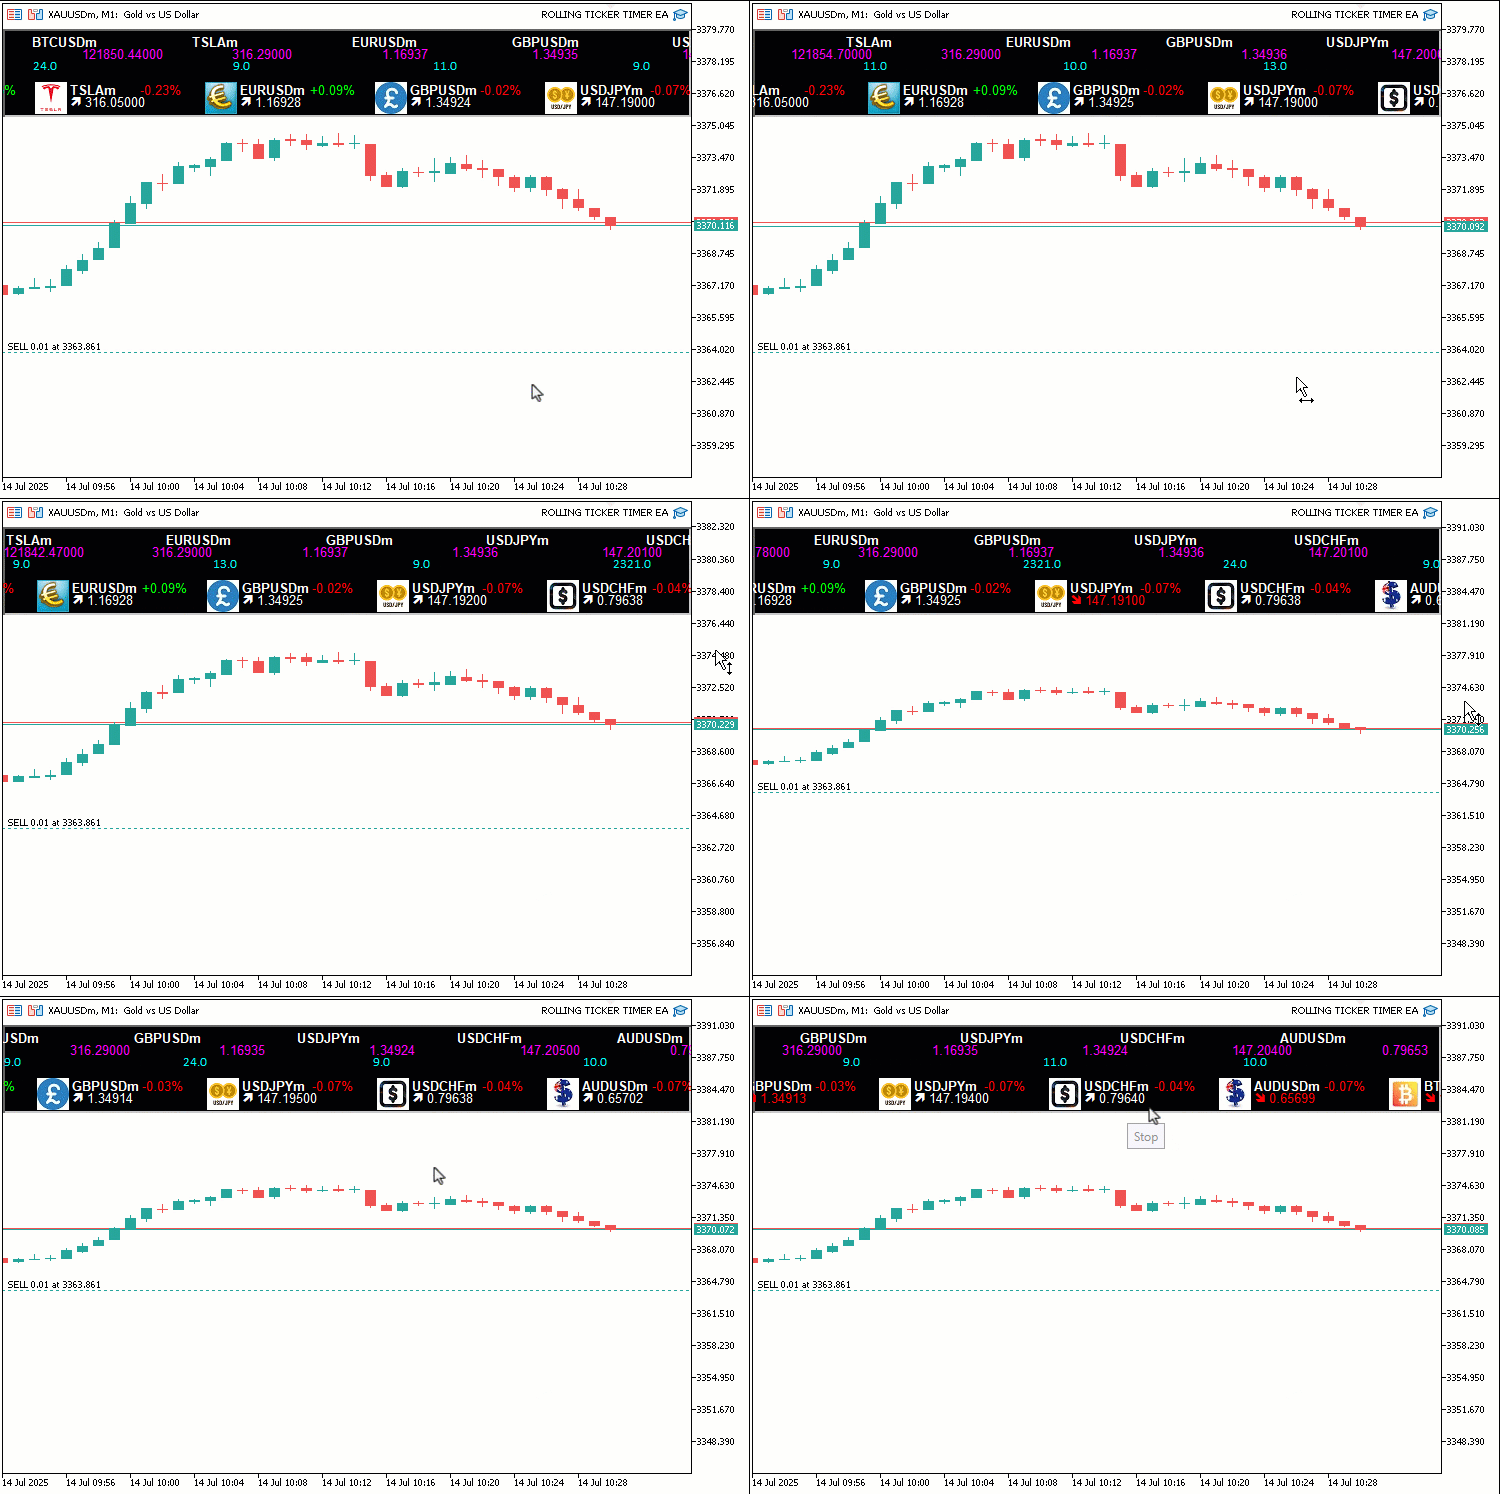
En la visualización podemos ver que todo funciona según lo previsto, por lo que estamos alcanzando nuestros objetivos. Ahora solo queda comprobar el funcionamiento del proyecto, y eso se aborda en la siguiente sección.
Backtesting
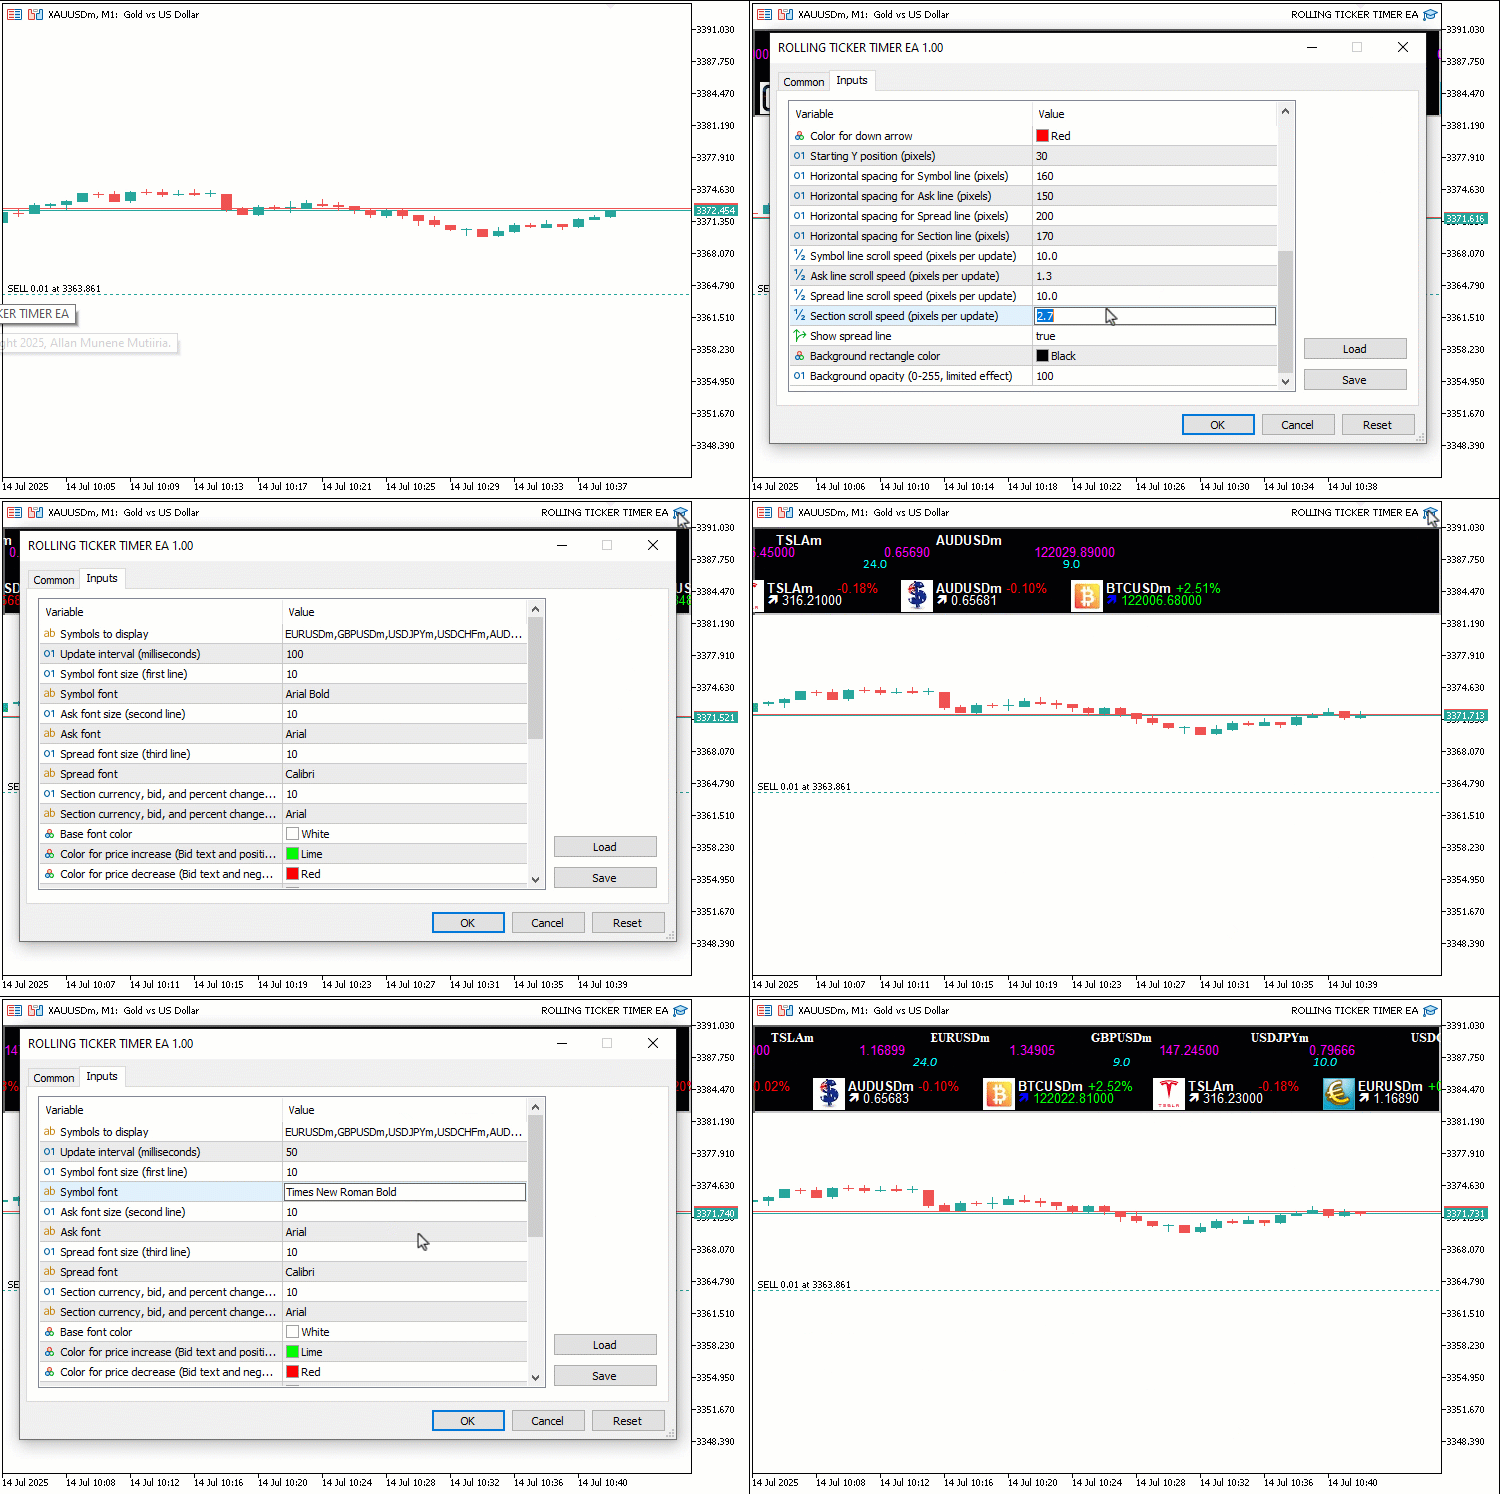
Hemos realizado las pruebas y, a continuación, se muestra la visualización compilada como una imagen GIF (Graphics Interchange Format).
Conclusión
En conclusión, hemos desarrollado un Ticker Tape en MQL5 para el seguimiento en tiempo real de múltiples símbolos, que incluye líneas en desplazamiento con los precio Bid (oferta), los spreads y las variaciones diarias, con fuentes, colores y velocidades personalizables para resaltar eficazmente los movimientos del mercado. Hemos mostrado la arquitectura y la implementación, desde estructuras de datos como «SymbolData» hasta funciones como «UpdateDashboard» y «UpdatePrices», lo que garantiza un desplazamiento fluido y actualizaciones precisas para obtener información útil sobre las operaciones. Puedes personalizar este ticker para adaptarlo a tus necesidades, lo que te permitirá mejorar considerablemente tu capacidad para realizar un seguimiento de múltiples símbolos y reaccionar ante las tendencias de los precios en tiempo real.
Traducción del inglés realizada por MetaQuotes Ltd.
Artículo original: https://www.mql5.com/en/articles/18844
Advertencia: todos los derechos de estos materiales pertenecen a MetaQuotes Ltd. Queda totalmente prohibido el copiado total o parcial.
Este artículo ha sido escrito por un usuario del sitio web y refleja su punto de vista personal. MetaQuotes Ltd. no se responsabiliza de la exactitud de la información ofrecida, ni de las posibles consecuencias del uso de las soluciones, estrategias o recomendaciones descritas.

 Desarrollo de un kit de herramientas para el análisis de la acción del precio (Parte 32): Motor de reconocimiento de velas japonesas en Python (II) — Detección con TA-Lib
 Desarrollo de asesores expertos autooptimizables en MQL5 (Parte 9): Cruce de dos medias móviles
 Reimaginando las estrategias clásicas en MQL5 (Parte 14): Análisis de múltiples estrategias
 Características del Wizard MQL5 que debe conocer (Parte 75): Uso del Awesome Oscillator y Envelopes

- Aplicaciones de trading gratuitas
- 8 000+ señales para copiar
- Noticias económicas para analizar los mercados financieros
Usted acepta la política del sitio web y las condiciones de uso
No funciona
¿Te has molestado siquiera en leer el artículo?