

Herramientas de trading de MQL5 (Parte 6): Panel de control holográfico dinámico con animaciones de pulso y controles interactivos
 141
141
 2
2

Introducción
En nuestro artículo anterior (Parte 5), creamos una cinta de cotizaciones deslizante en MetaQuotes Language 5 (MQL5) para el seguimiento en tiempo real de símbolos, con precios, spreads y variaciones que se van desplazando, con el fin de mantener informados a los traders de forma eficaz. En la parte 6, desarrollamos un panel holográfico dinámico que muestra indicadores de varios símbolos y marcos temporales, como el Relative Strength Index (RSI) y la volatilidad (basada en el Average True Range (ATR)), con animaciones de pulso, opciones de ordenación y controles interactivos, creando una herramienta de análisis atractiva y dinámica. Trataremos los siguientes temas:
- Comprender la arquitectura del panel de control holográfico
- Implementación en MQL5
- Pruebas retrospectivas (Backtesting)
- Conclusión
Al final, tendrás un panel de control holográfico personalizable listo para tu configuración de trading. ¡Empecemos!
Comprender la arquitectura del panel de control holográfico
El panel de control holográfico que estamos desarrollando es una herramienta visual que supervisa múltiples símbolos y marcos temporales, mostrando indicadores como el RSI y la volatilidad, además de funciones de ordenación y alertas, para ayudarnos a detectar rápidamente las oportunidades. Esta arquitectura es importante porque combina datos en tiempo real con controles interactivos y animaciones, lo que hace que el análisis resulte más atractivo y eficaz en un entorno de gráficos con mucha información.
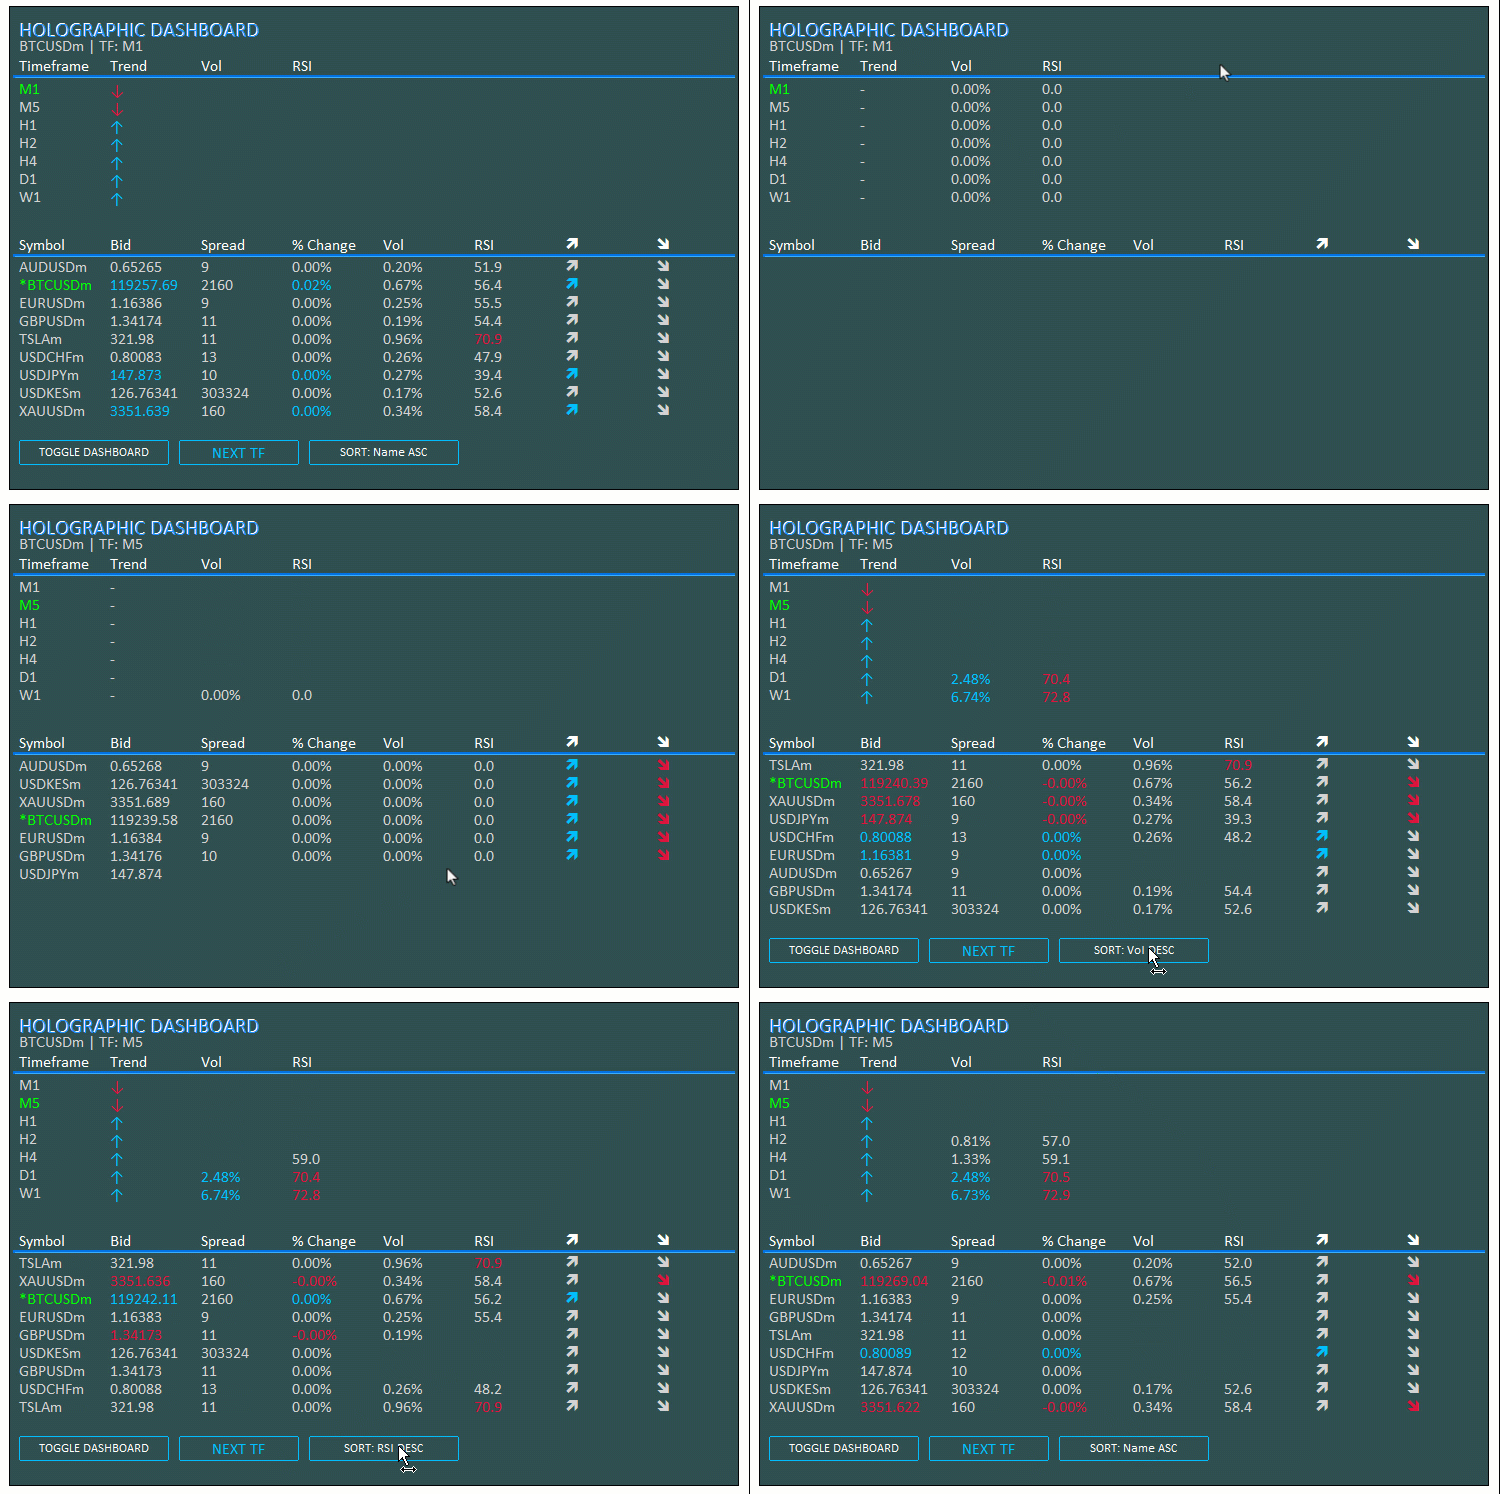
Lo conseguiremos utilizando arrays para la gestión de datos, manejadores de indicadores para indicadores como ATR y RSI, y funciones para ordenar y aplicar efectos de pulso, con botones para activar o desactivar la visibilidad y cambiar de vista. Tenemos previsto centralizar las actualizaciones en un bucle que actualice la interfaz de usuario (UI) de forma dinámica, garantizando que el panel de control siga siendo adaptable y receptivo para el trading estratégico. Observa la visualización siguiente para hacerte una idea del resultado que queremos lograr antes de pasar a la implementación.
Implementación en MQL5
Para crear el programa en MQL5, tendremos que definir los metadatos del programa y, a continuación, definir algunas entradas que nos permitan modificar fácilmente el funcionamiento del programa sin tener que modificar el código directamente.
//+------------------------------------------------------------------+
//|                                  Holographic Dashboard EA.mq5    |
//|                           Copyright 2025, Allan Munene Mutiiria. |
//|                                   https://t.me/Forex_Algo_Trader |
//+------------------------------------------------------------------+
#property copyright "Copyright 2025, Allan Munene Mutiiria."
#property link      "https://t.me/Forex_Algo_Trader"
#property version   "1.00"

#include <Arrays\ArrayString.mqh> //--- Include ArrayString library for string array operations
#include <Files\FileTxt.mqh>      //--- Include FileTxt library for text file operations

// Input Parameters
input int BaseFontSize = 9;           // Base Font Size
input string FontType = "Calibri";    // Font Type (Professional)
input int X_Offset = 30;              // X Offset
input int Y_Offset = 30;              // Y Offset
input color PanelColor = clrDarkSlateGray; // Panel Background Color
input color TitleColor = clrWhite;    // Title/Symbol Color
input color DataColor = clrLightGray; // Bid/Neutral Color
input color ActiveColor = clrLime;    // Active Timeframe/Symbol Color
input color UpColor = clrDeepSkyBlue; // Uptrend Color
input color DownColor = clrCrimson;   // Downtrend Color
input color LineColor = clrSilver;    // Grid Line Color
input bool EnableAnimations = true;   // Enable Pulse Animations
input int PanelWidth = 730;           // Panel Width (px)
input int ATR_Period = 14;            // ATR Period for Volatility
input int RSI_Period = 14;            // RSI Period
input double Vol_Alert_Threshold = 2.0; // Volatility Alert Threshold (%)
input color GlowColor = clrDodgerBlue; // Glow Color for holographic effect
input int AnimationSpeed = 30; // Animation delay in ms for pulse
input int PulseCycles = 3; // Number of pulse cycles for animations
Empezamos incorporando bibliotecas para arrays de cadenas y el registro en archivos de texto, y configurando las entradas para personalizar la interfaz de usuario y los indicadores. Incluimos «<Arrays\ArrayString.mqh>» para gestionar listas de símbolos y «<Files\FileTxt.mqh>» para registrar errores en un archivo. Estos ajustes nos permitirán ajustar el tamaño de fuente base a 9, elegir una fuente profesional como Calibri, establecer desplazamientos para el posicionamiento en los ejes x e y de 30 píxeles cada uno, y seleccionar colores como el gris pizarra oscuro para el fondo del panel, el blanco para los títulos, el gris claro para los datos, el verde lima para los elementos activos, el azul cielo intenso para las tendencias alcistas, el carmesí para las tendencias bajistas y el plateado para las líneas de la cuadrícula.
Habilitamos por defecto las animaciones de pulso, definimos el ancho del panel en 730 píxeles, fijamos los períodos del ATR y el RSI en 14 para los cálculos de volatilidad e impulso, establecemos un umbral del 2,0 % para las alertas de volatilidad, elegimos «Dodger Blue» para el resplandor holográfico y configuramos la velocidad de animación en 30 ms con 3 ciclos de pulso. Estos ajustes harán que el panel de control se adapte perfectamente a las preferencias visuales y funcionales de cada usuario. A continuación, debemos definir algunas variables globales que utilizaremos a lo largo del programa.
// Global Variables
double prices_PrevArray[];            //--- Array for previous prices
double volatility_Array[];            //--- Array for volatility values
double bid_array[];                   //--- Array for bid prices
long spread_array[];                  //--- Array for spreads
double change_array[];                //--- Array for percentage changes
double vol_array[];                   //--- Array for volumes
double rsi_array[];                   //--- Array for RSI values
int indices[];                        //--- Array for sorted indices
ENUM_TIMEFRAMES periods[] = {PERIOD_M1, PERIOD_M5, PERIOD_H1, PERIOD_H2, PERIOD_H4, PERIOD_D1, PERIOD_W1}; //--- Array of timeframes
string logFileName = "Holographic_Dashboard_Log.txt"; //--- Log file name
int sortMode = 0;                     //--- Current sort mode
string sortNames[] = {"Name ASC", "Vol DESC", "Change ABS DESC", "RSI DESC"}; //--- Sort mode names
int atr_handles_sym[];                //--- ATR handles for symbols
int rsi_handles_sym[];                //--- RSI handles for symbols
int atr_handles_tf[];                 //--- ATR handles for timeframes
int rsi_handles_tf[];                 //--- RSI handles for timeframes
int totalSymbols;                     //--- Total number of symbols
bool dashboardVisible = true;         //--- Dashboard visibility flag
Aquí definimos variables globales para gestionar los datos y los indicadores de nuestro programa, lo que permite la supervisión en tiempo real, la ordenación y las animaciones. Creamos arrays como «prices_PrevArray» para los precios anteriores con el fin de calcular las variaciones, «volatility_Array» para los valores de volatilidad, «bid_array» para el precio Bid actual, «spread_array» para los spreads como valores de tipo long, «change_array» para las variaciones porcentuales, «vol_array» para los volúmenes, «rsi_array» para los valores del RSI y «indices» para ordenar los índices. Configuramos «periods» como una matriz de marcos temporales que van desde PERIOD_M1 hasta PERIOD_W1; «logFileName» como «Holographic_Dashboard_Log.txt» para el registro de errores; «sortMode» en 0 para la ordenación inicial; «sortNames» como cadenas de caracteres para opciones de ordenación como «Name ASC» o «Vol DESC», y arrays para los manejadores de ATR y RSI («atr_handles_sym», «rsi_handles_sym» para símbolos, «atr_handles_tf», «rsi_handles_tf» para marcos temporales).
El entero «totalSymbols» registra el número de símbolos, y «dashboardVisible» es «true», lo que controla el estado del panel de control. Para gestionar mejor los objetos, vamos a crear una clase.
// Object Manager Class
class CObjectManager : public CArrayString {
public:
   void AddObject(string name) {      //--- Add object name to manager
      if (!Add(name)) {               //--- Check if add failed
         LogError(__FUNCTION__ + ": Failed to add object name: " + name); //--- Log error
      }
   }

   void DeleteAllObjects() {          //--- Delete all managed objects
      for (int i = Total() - 1; i >= 0; i--) { //--- Iterate through objects
         string name = At(i);         //--- Get object name
         if (ObjectFind(0, name) >= 0) { //--- Check if object exists
            if (!ObjectDelete(0, name)) { //--- Delete object
               LogError(__FUNCTION__ + ": Failed to delete object: " + name + ", Error: " + IntegerToString(GetLastError())); //--- Log deletion failure
            }
         }
         Delete(i);                   //--- Remove from array
      }
      ChartRedraw(0);                 //--- Redraw chart
   }
};
Para gestionar los objetos del panel de control de forma eficiente, creamos la clase «CObjectManager», que hereda de la clase CArrayString. En el método «AddObject», añadimos el objeto «name» a la matriz mediante «Add» y, si la operación falla, registramos el error mediante «LogError». Utilizamos el método «DeleteAllObjects» recorriendo el array hacia atrás con «Total», obtenemos cada «name» con «At», comprobamos si existe con la función ObjectFind, lo eliminamos con ObjectDelete y registramos los errores si falla, lo eliminamos del array con «Delete», y volvemos a dibujar el gráfico con la función ChartRedraw. Con la extensión de la clase, podemos crear algunas funciones auxiliares a las que recurriremos a lo largo del programa para reutilizarlas.
CObjectManager objManager;            //--- Object manager instance

//+------------------------------------------------------------------+
//| Utility Functions                                                |
//+------------------------------------------------------------------+
void LogError(string message) {
   CFileTxt file;                     //--- Create file object
   if (file.Open(logFileName, FILE_WRITE | FILE_TXT | FILE_COMMON, true) >= 0) { //--- Open log file
      file.WriteString(message + "\n"); //--- Write message
      file.Close();                   //--- Close file
   }
   Print(message);                    //--- Print message
}

string Ask(string symbol) {
   double value;                      //--- Variable for ask price
   if (SymbolInfoDouble(symbol, SYMBOL_ASK, value)) { //--- Get ask price
      return DoubleToString(value, (int)SymbolInfoInteger(symbol, SYMBOL_DIGITS)); //--- Return formatted ask
   }
   LogError(__FUNCTION__ + ": Failed to get ask price for " + symbol + ", Error: " + IntegerToString(GetLastError())); //--- Log error
   return "N/A";                      //--- Return N/A on failure
}

string Bid(string symbol) {
   double value;                      //--- Variable for bid price
   if (SymbolInfoDouble(symbol, SYMBOL_BID, value)) { //--- Get bid price
      return DoubleToString(value, (int)SymbolInfoInteger(symbol, SYMBOL_DIGITS)); //--- Return formatted bid
   }
   LogError(__FUNCTION__ + ": Failed to get bid price for " + symbol + ", Error: " + IntegerToString(GetLastError())); //--- Log error
   return "N/A";                      //--- Return N/A on failure
}

string Spread(string symbol) {
   long value;                        //--- Variable for spread
   if (SymbolInfoInteger(symbol, SYMBOL_SPREAD, value)) { //--- Get spread
      return IntegerToString(value);  //--- Return spread as string
   }
   LogError(__FUNCTION__ + ": Failed to get spread for " + symbol + ", Error: " + IntegerToString(GetLastError())); //--- Log error
   return "N/A";                      //--- Return N/A on failure
}

string PercentChange(double current, double previous) {
   if (previous == 0) return "0.00%"; //--- Handle zero previous value
   return StringFormat("%.2f%%", ((current - previous) / previous) * 100); //--- Calculate and format percentage
}

string TruncPeriod(ENUM_TIMEFRAMES period) {
   return StringSubstr(EnumToString(period), 7); //--- Truncate timeframe string
}
Para gestionar objetos y datos, creamos una instancia de «objManager» como «CObjectManager» para realizar un seguimiento de los elementos de la interfaz de usuario. Creamos la función «LogError» para registrar errores: abrimos «logFileName» con «CFileTxt» utilizando «FILE_WRITE | FILE_TXT | FILE_COMMON», escribimos el «message» con «WriteString», cerramos el archivo y lo mostramos en pantalla. La función «Ask» recupera el precio Ask de un «símbolo» mediante SymbolInfoDouble, lo formatea con DoubleToString utilizando «SymbolInfoInteger» para los dígitos, registra los errores con «LogError» si falla y devuelve «N/A» en caso de error. Del mismo modo, la función «Bid» recupera el precio Bid, le aplica el formato adecuado y gestiona los errores.
La función «Spread» obtiene el spread mediante «SymbolInfoInteger», lo devuelve como una cadena con IntegerToString o «N/A» en caso de error. La función «PercentChange» calcula la variación porcentual entre los precios «actual» y «anterior» utilizando StringFormat, y devuelve «0,00 %» si «anterior» es cero. La función «TruncPeriod» trunca las cadenas ENUM_TIMEFRAMES con StringSubstr para mostrar los marcos temporales de forma concisa, lo que garantiza que los resultados sean claros. Ahora podemos crear la función para los pulsos holográficos.
//+------------------------------------------------------------------+
//| Holographic Animation Function                                   |
//+------------------------------------------------------------------+
void HolographicPulse(string objName, color mainClr, color glowClr) {
   if (!EnableAnimations) return;     //--- Exit if animations disabled
   int cycles = PulseCycles;          //--- Set pulse cycles
   int delay = AnimationSpeed;        //--- Set animation delay
   for (int i = 0; i < cycles; i++) { //--- Iterate through cycles
      ObjectSetInteger(0, objName, OBJPROP_COLOR, glowClr); //--- Set glow color
      ChartRedraw(0);                 //--- Redraw chart
      Sleep(delay);                   //--- Delay
      ObjectSetInteger(0, objName, OBJPROP_COLOR, mainClr); //--- Set main color
      ChartRedraw(0);                 //--- Redraw chart
      Sleep(delay / 2);               //--- Shorter delay
   }
}
Aquí implementamos la función «HolographicPulse» para crear un efecto de animación de pulso en los elementos del panel de control. Se sale de la función de forma anticipada si «EnableAnimations» es «false» para omitir las animaciones. Establecemos «cycles» en «PulseCycles» y «delay» en «AnimationSpeed», y luego recorremos «cycles» con un bucle «for». En cada iteración, establecemos el color del objeto en «glowClr» con ObjectSetInteger para OBJPROP_COLOR, volvemos a dibujar el gráfico con ChartRedraw, hacemos una pausa con «Sleep» durante «delay», volvemos a «mainClr», volvemos a dibujar el gráfico y hacemos una pausa de «delay / 2» para conseguir un efecto más breve. Esto añadirá el pulso holográfico para resaltar visualmente los elementos activos o en estado de alerta. Con estas funciones, ya podemos pasar a crear el panel de control de inicialización principal. Para ello, necesitaremos algunas funciones auxiliares que nos permitan mantener la modularidad del programa.
//+------------------------------------------------------------------+
//| Create Text Label Function                                       |
//+------------------------------------------------------------------+
bool createText(string objName, string text, int x, int y, color clrTxt, int fontsize, string font, bool animate = false, double opacity = 1.0) {
   ResetLastError();                  //--- Reset error code
   if (ObjectFind(0, objName) < 0) {  //--- Check if object exists
      if (!ObjectCreate(0, objName, OBJ_LABEL, 0, 0, 0)) { //--- Create label
         LogError(__FUNCTION__ + ": Failed to create label: " + objName + ", Error: " + IntegerToString(GetLastError())); //--- Log error
         return false;                //--- Return failure
      }
      objManager.AddObject(objName);  //--- Add to manager
   }
   ObjectSetInteger(0, objName, OBJPROP_XDISTANCE, x); //--- Set x-coordinate
   ObjectSetInteger(0, objName, OBJPROP_YDISTANCE, y); //--- Set y-coordinate
   ObjectSetInteger(0, objName, OBJPROP_CORNER, CORNER_LEFT_UPPER); //--- Set corner
   ObjectSetString(0, objName, OBJPROP_TEXT, text); //--- Set text
   ObjectSetInteger(0, objName, OBJPROP_COLOR, clrTxt); //--- Set color
   ObjectSetInteger(0, objName, OBJPROP_FONTSIZE, fontsize); //--- Set font size
   ObjectSetString(0, objName, OBJPROP_FONT, font); //--- Set font
   ObjectSetInteger(0, objName, OBJPROP_BACK, false); //--- Set foreground
   ObjectSetInteger(0, objName, OBJPROP_SELECTABLE, false); //--- Disable selection
   ObjectSetInteger(0, objName, OBJPROP_ZORDER, StringFind(objName, "Glow") >= 0 ? -1 : 0); //--- Set z-order

   if (animate && EnableAnimations) { //--- Check for animation
      ObjectSetInteger(0, objName, OBJPROP_COLOR, DataColor); //--- Set temporary color
      ChartRedraw(0);                 //--- Redraw chart
      Sleep(50);                      //--- Delay
      ObjectSetInteger(0, objName, OBJPROP_COLOR, clrTxt); //--- Set final color
   }

   ChartRedraw(0);                    //--- Redraw chart
   return true;                       //--- Return success
}

//+------------------------------------------------------------------+
//| Create Button Function                                           |
//+------------------------------------------------------------------+
bool createButton(string objName, string text, int x, int y, int width, int height, color textColor, color bgColor, color borderColor, bool animate = false) {
   ResetLastError();                  //--- Reset error code
   if (ObjectFind(0, objName) < 0) {  //--- Check if object exists
      if (!ObjectCreate(0, objName, OBJ_BUTTON, 0, 0, 0)) { //--- Create button
         LogError(__FUNCTION__ + ": Failed to create button: " + objName + ", Error: " + IntegerToString(GetLastError())); //--- Log error
         return false;                //--- Return failure
      }
      objManager.AddObject(objName);  //--- Add to manager
   }
   ObjectSetInteger(0, objName, OBJPROP_XDISTANCE, x); //--- Set x-coordinate
   ObjectSetInteger(0, objName, OBJPROP_YDISTANCE, y); //--- Set y-coordinate
   ObjectSetInteger(0, objName, OBJPROP_XSIZE, width); //--- Set width
   ObjectSetInteger(0, objName, OBJPROP_YSIZE, height); //--- Set height
   ObjectSetString(0, objName, OBJPROP_TEXT, text); //--- Set text
   ObjectSetInteger(0, objName, OBJPROP_COLOR, textColor); //--- Set text color
   ObjectSetInteger(0, objName, OBJPROP_BGCOLOR, bgColor); //--- Set background color
   ObjectSetInteger(0, objName, OBJPROP_BORDER_COLOR, borderColor); //--- Set border color
   ObjectSetInteger(0, objName, OBJPROP_FONTSIZE, BaseFontSize + (StringFind(objName, "SwitchTFBtn") >= 0 ? 3 : 0)); //--- Set font size
   ObjectSetString(0, objName, OBJPROP_FONT, FontType); //--- Set font
   ObjectSetInteger(0, objName, OBJPROP_ZORDER, 1); //--- Set z-order
   ObjectSetInteger(0, objName, OBJPROP_STATE, false); //--- Reset state

   if (animate && EnableAnimations) { //--- Check for animation
      ObjectSetInteger(0, objName, OBJPROP_BGCOLOR, clrLightGray); //--- Set temporary background
      ChartRedraw(0);                 //--- Redraw chart
      Sleep(50);                      //--- Delay
      ObjectSetInteger(0, objName, OBJPROP_BGCOLOR, bgColor); //--- Set final background
   }

   ChartRedraw(0);                    //--- Redraw chart
   return true;                       //--- Return success
}

//+------------------------------------------------------------------+
//| Create Panel Function                                            |
//+------------------------------------------------------------------+
bool createPanel(string objName, int x, int y, int width, int height, color clr, double opacity = 1.0) {
   ResetLastError();                  //--- Reset error code
   if (ObjectFind(0, objName) < 0) {  //--- Check if object exists
      if (!ObjectCreate(0, objName, OBJ_RECTANGLE_LABEL, 0, 0, 0)) { //--- Create panel
         LogError(__FUNCTION__ + ": Failed to create panel: " + objName + ", Error: " + IntegerToString(GetLastError())); //--- Log error
         return false;                //--- Return failure
      }
      objManager.AddObject(objName);  //--- Add to manager
   }
   ObjectSetInteger(0, objName, OBJPROP_XDISTANCE, x); //--- Set x-coordinate
   ObjectSetInteger(0, objName, OBJPROP_YDISTANCE, y); //--- Set y-coordinate
   ObjectSetInteger(0, objName, OBJPROP_XSIZE, width); //--- Set width
   ObjectSetInteger(0, objName, OBJPROP_YSIZE, height); //--- Set height
   ObjectSetInteger(0, objName, OBJPROP_BGCOLOR, clr); //--- Set background color
   ObjectSetInteger(0, objName, OBJPROP_BORDER_TYPE, BORDER_FLAT); //--- Set border type
   ObjectSetInteger(0, objName, OBJPROP_ZORDER, -1); //--- Set z-order
   ChartRedraw(0);                    //--- Redraw chart
   return true;                       //--- Return success
}

//+------------------------------------------------------------------+
//| Create Line Function                                             |
//+------------------------------------------------------------------+
bool createLine(string objName, int x1, int y1, int x2, int y2, color clrLine, double opacity = 1.0) {
   ResetLastError();                  //--- Reset error code
   if (ObjectFind(0, objName) < 0) {  //--- Check if object exists
      if (!ObjectCreate(0, objName, OBJ_RECTANGLE_LABEL, 0, 0, 0)) { //--- Create line as rectangle
         LogError(__FUNCTION__ + ": Failed to create line: " + objName + ", Error: " + IntegerToString(GetLastError())); //--- Log error
         return false;                //--- Return failure
      }
      objManager.AddObject(objName);  //--- Add to manager
   }
   ObjectSetInteger(0, objName, OBJPROP_XDISTANCE, x1); //--- Set x1
   ObjectSetInteger(0, objName, OBJPROP_YDISTANCE, y1); //--- Set y1
   ObjectSetInteger(0, objName, OBJPROP_XSIZE, x2 - x1); //--- Set width
   ObjectSetInteger(0, objName, OBJPROP_YSIZE, StringFind(objName, "Glow") >= 0 ? 3 : 1); //--- Set height
   ObjectSetInteger(0, objName, OBJPROP_BGCOLOR, clrLine); //--- Set color
   ObjectSetInteger(0, objName, OBJPROP_ZORDER, StringFind(objName, "Glow") >= 0 ? -1 : 0); //--- Set z-order
   ChartRedraw(0);                    //--- Redraw chart
   return true;                       //--- Return success
}
Aquí definimos la función «createText» para generar una etiqueta de texto. Empezamos llamando a ResetLastError para borrar cualquier error anterior. Si el objeto no existe (lo comprobamos mediante «ObjectFind(0, objName) < 0»), lo creamos mediante ObjectCreate con el tipo OBJ_LABEL. Si se produce un error, lo registramos y devolvemos «false». Lo añadimos a «objManager» mediante «AddObject». Establecemos las propiedades: OBJPROP_XDISTANCE en «x», «OBJPROP_YDISTANCE» en «y» y lo mismo con las demás. Si «animate» y «EnableAnimations» son «true», establecemos temporalmente «OBJPROP_COLOR» en «DataColor», volvemos a dibujar, esperamos un tiempo con «Sleep(50)» y, a continuación, lo configuramos con el color del texto. Por último, vuelve a dibujar y devuelve «true».
A continuación, definimos «createButton» de forma similar: restablecemos el error, comprobamos si existe, lo creamos con OBJ_BUTTON si es necesario, registramos el error en caso de fallo y lo añadimos al gestor. A continuación, configuramos las propiedades del objeto y, si las animaciones están activadas, establecemos temporalmente OBJPROP_BGCOLOR en «clrLightGray», volvemos a dibujar, esperamos 50 ms y, a continuación, lo establecemos en «bgColor». Vuelve a dibujar y devuelve «true». Para «createPanel», utilizamos un enfoque similar.
Por último, «createLine» sigue un patrón similar: restablecer, comprobar, crear como OBJ_RECTANGLE_LABEL (simulando una línea), registrar el error en caso de fallo y añadirlo al gestor. Establece «OBJPROP_XDISTANCE» en «x1», «OBJPROP_YDISTANCE» en «y1», «OBJPROP_XSIZE» en «x2-x1», «OBJPROP_YSIZE» en 3 si el nombre contiene «Glow»; en caso contrario, en 1; «OBJPROP_BGCOLOR» en «clrLine»; OBJPROP_ZORDER en -1 si el nombre contiene «Glow»; en caso contrario, en 0. Vuelve a dibujar y devuelve «true». Ahora utilizamos estas funciones para crear la función principal que nos permitirá diseñar el panel de control principal de la siguiente manera.
//+------------------------------------------------------------------+
//| Dashboard Creation Function with Holographic Effects             |
//+------------------------------------------------------------------+
void InitDashboard() {
   // Get chart dimensions
   long chartWidth, chartHeight;      //--- Variables for chart dimensions
   if (!ChartGetInteger(0, CHART_WIDTH_IN_PIXELS, 0, chartWidth) || !ChartGetInteger(0, CHART_HEIGHT_IN_PIXELS, 0, chartHeight)) { //--- Get chart size
      LogError(__FUNCTION__ + ": Failed to get chart dimensions, Error: " + IntegerToString(GetLastError())); //--- Log error
      return;                         //--- Exit on failure
   }
   int fontSize = (int)(BaseFontSize * (chartWidth / 800.0)); //--- Calculate font size
   int cellWidth = PanelWidth / 8;    //--- Calculate cell width
   int cellHeight = 18;               //--- Set cell height
   int panelHeight = 70 + (ArraySize(periods) + 1) * cellHeight + 40 + (totalSymbols + 1) * cellHeight + 50; //--- Calculate panel height

   // Create Dark Panel
   createPanel("DashboardPanel", X_Offset, Y_Offset, PanelWidth, panelHeight, PanelColor); //--- Create dashboard panel

   // Create Header with Glow
   createText("Header", "HOLOGRAPHIC DASHBOARD", X_Offset + 10, Y_Offset + 10, TitleColor, fontSize + 4, FontType); //--- Create header text
   createText("HeaderGlow", "HOLOGRAPHIC DASHBOARD", X_Offset + 11, Y_Offset + 11, GlowColor, fontSize + 4, FontType, true); //--- Create header glow
   createText("SubHeader", StringFormat("%s | TF: %s", _Symbol, TruncPeriod(_Period)), X_Offset + 10, Y_Offset + 30, DataColor, fontSize, FontType); //--- Create subheader

   // Timeframe Grid
   int y = Y_Offset + 50;             //--- Set y-coordinate for timeframe grid
   createText("TF_Label", "Timeframe", X_Offset + 10, y, TitleColor, fontSize, FontType); //--- Create timeframe label
   createText("Trend_Label", "Trend", X_Offset + 10 + cellWidth, y, TitleColor, fontSize, FontType); //--- Create trend label
   createText("Vol_Label", "Vol", X_Offset + 10 + cellWidth * 2, y, TitleColor, fontSize, FontType); //--- Create vol label
   createText("RSI_Label", "RSI", X_Offset + 10 + cellWidth * 3, y, TitleColor, fontSize, FontType); //--- Create RSI label
   createLine("TF_Separator", X_Offset + 5, y + cellHeight + 2, X_Offset + PanelWidth - 5, y + cellHeight + 2, LineColor, 0.6); //--- Create separator line
   createLine("TF_Separator_Glow", X_Offset + 4, y + cellHeight + 1, X_Offset + PanelWidth - 4, y + cellHeight + 3, GlowColor, 0.3); //--- Create glow separator
   if (EnableAnimations) HolographicPulse("TF_Separator", LineColor, GlowColor); //--- Animate separator if enabled

   y += cellHeight + 5;               //--- Update y-coordinate
   for (int i = 0; i < ArraySize(periods); i++) { //--- Iterate through timeframes
      color periodColor = (periods[i] == _Period) ? ActiveColor : DataColor; //--- Set period color
      createText("Period_" + IntegerToString(i), TruncPeriod(periods[i]), X_Offset + 10, y, periodColor, fontSize, FontType); //--- Create period text
      createText("Trend_" + IntegerToString(i), "-", X_Offset + 10 + cellWidth, y, DataColor, fontSize, FontType); //--- Create trend text
      createText("Vol_" + IntegerToString(i), "0.00%", X_Offset + 10 + cellWidth * 2, y, DataColor, fontSize, FontType); //--- Create vol text
      createText("RSI_" + IntegerToString(i), "0.0", X_Offset + 10 + cellWidth * 3, y, DataColor, fontSize, FontType); //--- Create RSI text
      y += cellHeight;                //--- Update y-coordinate
   }

   // Symbol Grid
   y += 30;                           //--- Update y-coordinate for symbol grid
   createText("Symbol_Label", "Symbol", X_Offset + 10, y, TitleColor, fontSize, FontType); //--- Create symbol label
   createText("Bid_Label", "Bid", X_Offset + 10 + cellWidth, y, TitleColor, fontSize, FontType); //--- Create bid label
   createText("Spread_Label", "Spread", X_Offset + 10 + cellWidth * 2, y, TitleColor, fontSize, FontType); //--- Create spread label
   createText("Change_Label", "% Change", X_Offset + 10 + cellWidth * 3, y, TitleColor, fontSize, FontType); //--- Create change label
   createText("Vol_Label_Symbol", "Vol", X_Offset + 10 + cellWidth * 4, y, TitleColor, fontSize, FontType); //--- Create vol label
   createText("RSI_Label_Symbol", "RSI", X_Offset + 10 + cellWidth * 5, y, TitleColor, fontSize, FontType); //--- Create RSI label
   createText("UpArrow_Label", CharToString(236), X_Offset + 10 + cellWidth * 6, y, TitleColor, fontSize, "Wingdings"); //--- Create up arrow label
   createText("DownArrow_Label", CharToString(238), X_Offset + 10 + cellWidth * 7, y, TitleColor, fontSize, "Wingdings"); //--- Create down arrow label
   createLine("Symbol_Separator", X_Offset + 5, y + cellHeight + 2, X_Offset + PanelWidth - 5, y + cellHeight + 2, LineColor, 0.6); //--- Create separator line
   createLine("Symbol_Separator_Glow", X_Offset + 4, y + cellHeight + 1, X_Offset + PanelWidth - 4, y + cellHeight + 3, GlowColor, 0.3); //--- Create glow separator
   if (EnableAnimations) HolographicPulse("Symbol_Separator", LineColor, GlowColor); //--- Animate separator if enabled

   y += cellHeight + 5;               //--- Update y-coordinate
   for (int i = 0; i < totalSymbols; i++) { //--- Iterate through symbols
      string symbol = SymbolName(i, true); //--- Get symbol name
      string displaySymbol = (symbol == _Symbol) ? "*" + symbol : symbol; //--- Format display symbol
      color symbolColor = (symbol == _Symbol) ? ActiveColor : DataColor; //--- Set symbol color
      createText("Symbol_" + IntegerToString(i), displaySymbol, X_Offset + 10, y, symbolColor, fontSize, FontType); //--- Create symbol text
      createText("Bid_" + IntegerToString(i), Bid(symbol), X_Offset + 10 + cellWidth, y, DataColor, fontSize, FontType); //--- Create bid text
      createText("Spread_" + IntegerToString(i), Spread(symbol), X_Offset + 10 + cellWidth * 2, y, DataColor, fontSize, FontType); //--- Create spread text
      createText("Change_" + IntegerToString(i), "0.00%", X_Offset + 10 + cellWidth * 3, y, DataColor, fontSize, FontType); //--- Create change text
      createText("Vol_" + IntegerToString(i), "0.00%", X_Offset + 10 + cellWidth * 4, y, DataColor, fontSize, FontType); //--- Create vol text
      createText("RSI_" + IntegerToString(i), "0.0", X_Offset + 10 + cellWidth * 5, y, DataColor, fontSize, FontType); //--- Create RSI text
      createText("ArrowUp_" + IntegerToString(i), CharToString(236), X_Offset + 10 + cellWidth * 6, y, UpColor, fontSize, "Wingdings"); //--- Create up arrow
      createText("ArrowDown_" + IntegerToString(i), CharToString(238), X_Offset + 10 + cellWidth * 7, y, DownColor, fontSize, "Wingdings"); //--- Create down arrow
      y += cellHeight;                //--- Update y-coordinate
   }

   // Interactive Buttons with Pulse Animation
   createButton("ToggleBtn", "TOGGLE DASHBOARD", X_Offset + 10, y + 20, 150, 25, TitleColor, PanelColor, UpColor); //--- Create toggle button
   createButton("SwitchTFBtn", "NEXT TF", X_Offset + 170, y + 20, 120, 25, UpColor, PanelColor, UpColor); //--- Create switch TF button
   createButton("SortBtn", "SORT: " + sortNames[sortMode], X_Offset + 300, y + 20, 150, 25, TitleColor, PanelColor, UpColor); //--- Create sort button

   ChartRedraw(0);                    //--- Redraw chart
}
Aquí inicializamos el panel de control recuperando primero las dimensiones del gráfico mediante las variables «chartWidth» y «chartHeight». Para ello, llamamos dos veces a la función ChartGetInteger: una vez con CHART_WIDTH_IN_PIXELS para obtener la anchura y otra con «CHART_HEIGHT_IN_PIXELS» para obtener la altura. A continuación, calculamos el «fontSize» escalando el «BaseFontSize» en función del ancho del gráfico en relación con 800 píxeles y convirtiendo el resultado a un número entero. A continuación, calculamos el valor de «cellWidth» dividiendo «PanelWidth» entre 8 y establecemos «cellHeight» en un valor fijo de 18. El valor de «panelHeight» se calcula sumando 70, el producto de («ArraySize(periods)» + 1) y «cellHeight», 40, el producto de («totalSymbols» + 1) y «cellHeight», y 50; esto tiene en cuenta el diseño general, incluidos los marcos temporales y los símbolos.
A continuación, creamos el fondo oscuro del panel llamando a la función «createPanel» con el nombre «DashboardPanel», situado en las coordenadas «X_Offset» y «Y_Offset», con las dimensiones «PanelWidth» y «panelHeight», y con el color «PanelColor». Para el encabezado, creamos la etiqueta de texto principal «Header» con la cadena «HOLOGRAPHIC DASHBOARD» utilizando la función «createText» en las coordenadas «X_Offset» + 10« y «Y_Offset» + 10», con el estilo «TitleColor», un tamaño de fuente de «fontSize» + 4" y «FontType». Para añadir un efecto de resplandor, creamos otra etiqueta de texto «HeaderGlow» con la misma cadena, pero desplazada 1 píxel tanto en la dirección x como en la y, utilizando «GlowColor», el mismo tamaño de fuente, «FontType», y estableciendo el indicador de opacidad en «true».
A continuación, añadimos una etiqueta de subtítulo «SubHeader», con el formato del símbolo actual _Symbol y el periodo truncado de «TruncPeriod(_Period)» mediante «StringFormat», situada en «X_Offset» + 10« y «Y_Offset» + 30», con el color «DataColor», el «fontSize» y el «FontType».
Pasando a la sección de la cuadrícula temporal, establecemos «y» en «Y_Offset» + 50". Creamos etiquetas para «Timeframe», «Trend», «Vol» y «RSI» utilizando «createText» para cada una de ellas, colocadas horizontalmente con desplazamientos basados en «cellWidth», y todas ellas utilizando «TitleColor», «fontSize» y «FontType». Debajo de estos, dibujamos una línea separadora «TF_Separator» utilizando la función «createLine», desde «X_Offset + 5» hasta «X_Offset + PanelWidth - 5», a una altura de «y + cellHeight + 2», con el color «LineColor» y una opacidad de 0,6. Para el resplandor, añadimos «TF_Separator_Glow» como otra línea ligeramente desplazada y más ancha, con «GlowColor» y una opacidad de 0,3. Si «EnableAnimations» es «true», aplicamos la animación mediante «HolographicPulse» con «LineColor» y «GlowColor». Aplicamos una lógica similar al resto de objetos de etiqueta.
Por último, creamos botones interactivos: «ToggleBtn» con el texto «TOGGLE DASHBOARD» en la posición «X_Offset» + 10", «y + 20», tamaño 150x25, con «TitleColor», «PanelColor» y «UpColor»; «SwitchTFBtn» con el texto «NEXT TF» en la posición «X_Offset» + 170», con la misma coordenada y, tamaño 120x25, con «UpColor», «PanelColor» y «UpColor»; y «SortBtn» como «SORT: » + sortNames[sortMode]» en «X_Offset» + 300", misma y, tamaño 150x25, con «TitleColor», «PanelColor», «UpColor». Concluimos volviendo a dibujar el gráfico con la función «ChartRedraw(0)». Con esta función, podemos llamarla en el controlador de eventos de inicialización y delegar en ella la mayor parte de la inicialización.
//+------------------------------------------------------------------+
//| Expert Initialization Function                                   |
//+------------------------------------------------------------------+
int OnInit() {
   // Clear existing objects
   if (ObjectsDeleteAll(0, -1, -1) < 0) { //--- Delete all objects
      LogError(__FUNCTION__ + ": Failed to delete objects, Error: " + IntegerToString(GetLastError())); //--- Log error
   }
   objManager.DeleteAllObjects();     //--- Delete managed objects

   // Initialize arrays
   totalSymbols = SymbolsTotal(true); //--- Get total symbols
   if (totalSymbols == 0) {           //--- Check for symbols
      LogError(__FUNCTION__ + ": No symbols available"); //--- Log error
      return INIT_FAILED;             //--- Return failure
   }
   ArrayResize(prices_PrevArray, totalSymbols); //--- Resize previous prices array
   ArrayResize(volatility_Array, totalSymbols); //--- Resize volatility array
   ArrayResize(bid_array, totalSymbols); //--- Resize bid array
   ArrayResize(spread_array, totalSymbols); //--- Resize spread array
   ArrayResize(change_array, totalSymbols); //--- Resize change array
   ArrayResize(vol_array, totalSymbols); //--- Resize vol array
   ArrayResize(rsi_array, totalSymbols); //--- Resize RSI array
   ArrayResize(indices, totalSymbols);   //--- Resize indices array
   ArrayResize(atr_handles_sym, totalSymbols); //--- Resize ATR symbol handles
   ArrayResize(rsi_handles_sym, totalSymbols); //--- Resize RSI symbol handles
   ArrayResize(atr_handles_tf, ArraySize(periods)); //--- Resize ATR timeframe handles
   ArrayResize(rsi_handles_tf, ArraySize(periods)); //--- Resize RSI timeframe handles
   ArrayInitialize(prices_PrevArray, 0); //--- Initialize previous prices
   ArrayInitialize(volatility_Array, 0); //--- Initialize volatility

   // Create indicator handles for timeframes
   for (int i = 0; i < ArraySize(periods); i++) { //--- Iterate through timeframes
      atr_handles_tf[i] = iATR(_Symbol, periods[i], ATR_Period); //--- Create ATR handle
      if (atr_handles_tf[i] == INVALID_HANDLE) { //--- Check for invalid handle
         LogError(__FUNCTION__ + ": Failed to create ATR handle for TF " + EnumToString(periods[i])); //--- Log error
         return INIT_FAILED;          //--- Return failure
      }
      rsi_handles_tf[i] = iRSI(_Symbol, periods[i], RSI_Period, PRICE_CLOSE); //--- Create RSI handle
      if (rsi_handles_tf[i] == INVALID_HANDLE) { //--- Check for invalid handle
         LogError(__FUNCTION__ + ": Failed to create RSI handle for TF " + EnumToString(periods[i])); //--- Log error
         return INIT_FAILED;          //--- Return failure
      }
   }

   // Create indicator handles for symbols on H1
   for (int i = 0; i < totalSymbols; i++) { //--- Iterate through symbols
      string symbol = SymbolName(i, true); //--- Get symbol name
      atr_handles_sym[i] = iATR(symbol, PERIOD_H1, ATR_Period); //--- Create ATR handle
      if (atr_handles_sym[i] == INVALID_HANDLE) { //--- Check for invalid handle
         LogError(__FUNCTION__ + ": Failed to create ATR handle for symbol " + symbol); //--- Log error
         return INIT_FAILED;          //--- Return failure
      }
      rsi_handles_sym[i] = iRSI(symbol, PERIOD_H1, RSI_Period, PRICE_CLOSE); //--- Create RSI handle
      if (rsi_handles_sym[i] == INVALID_HANDLE) { //--- Check for invalid handle
         LogError(__FUNCTION__ + ": Failed to create RSI handle for symbol " + symbol); //--- Log error
         return INIT_FAILED;          //--- Return failure
      }
   }

   InitDashboard();                   //--- Initialize dashboard
   dashboardVisible = true;           //--- Set dashboard visible

   return INIT_SUCCEEDED;             //--- Return success
}
En la función OnInit, borramos los objetos existentes mediante la función ObjectsDeleteAll para el gráfico actual, en todas las subventanas y tipos de objeto; si la operación no se realiza correctamente, registramos los errores con «LogError»; y llamamos a «objManager.DeleteAllObjects» para eliminar los elementos gestionados. Obtenemos «totalSymbols» a partir de SymbolsTotal, donde el valor es «true» para los símbolos del mercado en observación; si es cero, se devuelve INIT_FAILED y se registra en el log con «LogError». Cambiamos el tamaño de los arrays como «prices_PrevArray», «volatility_Array», «bid_array», «spread_array», «change_array», «vol_array», «rsi_array», «indices», «atr_handles_sym», «rsi_handles_sym», «atr_handles_tf» y «rsi_handles_tf» para que coincidan con «totalSymbols» o «ArraySize(periods)» utilizando ArrayResize, e inicializamos «prices_PrevArray» y «volatility_Array» a cero con la función ArrayInitialize.
En cuanto a los marcos temporales, recorremos los «periodos» y creamos «atr_handles_tf[i]» con iATR en «_Symbol», «periods[i]» y «ATR_Period», y «rsi_handles_tf[i]» con «iRSI» en _Symbol, «periods[i]», «RSI_Period» y «PRICE_CLOSE», registrando y devolviendo INIT_FAILED si se produce un «INVALID_HANDLE». Del mismo modo, para los símbolos, recorremos «totalSymbols», obtenemos «symbol» con «SymbolName» y «true», creamos «atr_handles_sym[i]» con «iATR» en «symbol», «PERIOD_H1» y «ATR_Period», y «rsi_handles_sym[i]» con iRSI en «symbol», «PERIOD_H1», «RSI_Period» y «PRICE_CLOSE», registrándolo y devolviendo «INIT_FAILED» si no es válido. Llamamos a «InitDashboard» para crear la interfaz de usuario, establecemos «dashboardVisible» en «true» y devolvemos un resultado de éxito. Al ejecutar el programa, obtenemos el siguiente resultado.
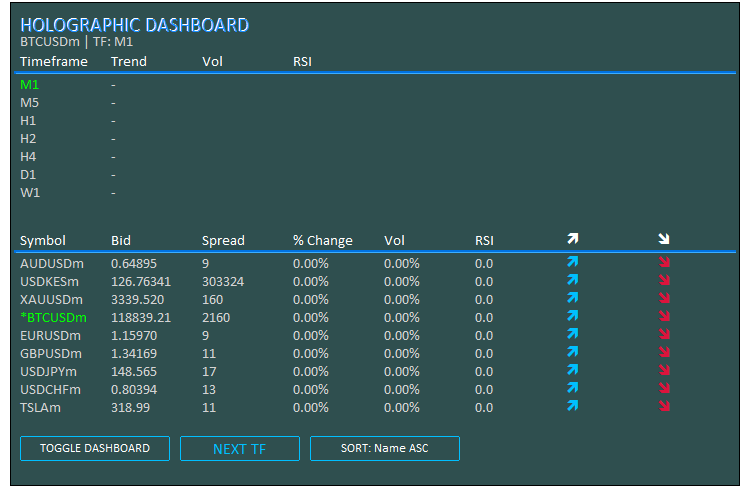
En la imagen se puede ver que hemos inicializado el programa correctamente. Podemos encargarnos de la desinicialización del programa, en la que tendremos que eliminar los objetos creados y liberar los manejadores de los indicadores.
//+------------------------------------------------------------------+
//| Expert Deinitialization Function                                 |
//+------------------------------------------------------------------+
void OnDeinit(const int reason) {
   if (ObjectsDeleteAll(0, -1, -1) < 0) { //--- Delete all objects
      LogError(__FUNCTION__ + ": Failed to delete objects, Error: " + IntegerToString(GetLastError())); //--- Log error
   }
   objManager.DeleteAllObjects();     //--- Delete managed objects

   // Release indicator handles
   for (int i = 0; i < ArraySize(atr_handles_tf); i++) { //--- Iterate through timeframe ATR handles
      if (atr_handles_tf[i] != INVALID_HANDLE) IndicatorRelease(atr_handles_tf[i]); //--- Release handle
      if (rsi_handles_tf[i] != INVALID_HANDLE) IndicatorRelease(rsi_handles_tf[i]); //--- Release handle
   }
   for (int i = 0; i < ArraySize(atr_handles_sym); i++) { //--- Iterate through symbol ATR handles
      if (atr_handles_sym[i] != INVALID_HANDLE) IndicatorRelease(atr_handles_sym[i]); //--- Release handle
      if (rsi_handles_sym[i] != INVALID_HANDLE) IndicatorRelease(rsi_handles_sym[i]); //--- Release handle
   }
}
En el controlador de eventos OnDeinit, liberamos los recursos cuando se elimina el EA. Eliminamos todos los objetos de los gráficos con ObjectsDeleteAll, utilizando el valor -1 para todos los gráficos y tipos, y registramos los errores con «LogError» si el resultado es negativo. Llamamos a «objManager.DeleteAllObjects» para eliminar los elementos gestionados. En el caso de los manejadores de marcos temporales, recorremos «atr_handles_tf» y «rsi_handles_tf» con ArraySize, liberando los manejadores válidos mediante IndicatorRelease si no son «INVALID_HANDLE». Del mismo modo, para los manejadores de símbolos en «atr_handles_sym» y «rsi_handles_sym». Esto garantiza la eliminación completa de los objetos y los indicadores. A continuación se muestra una ilustración.
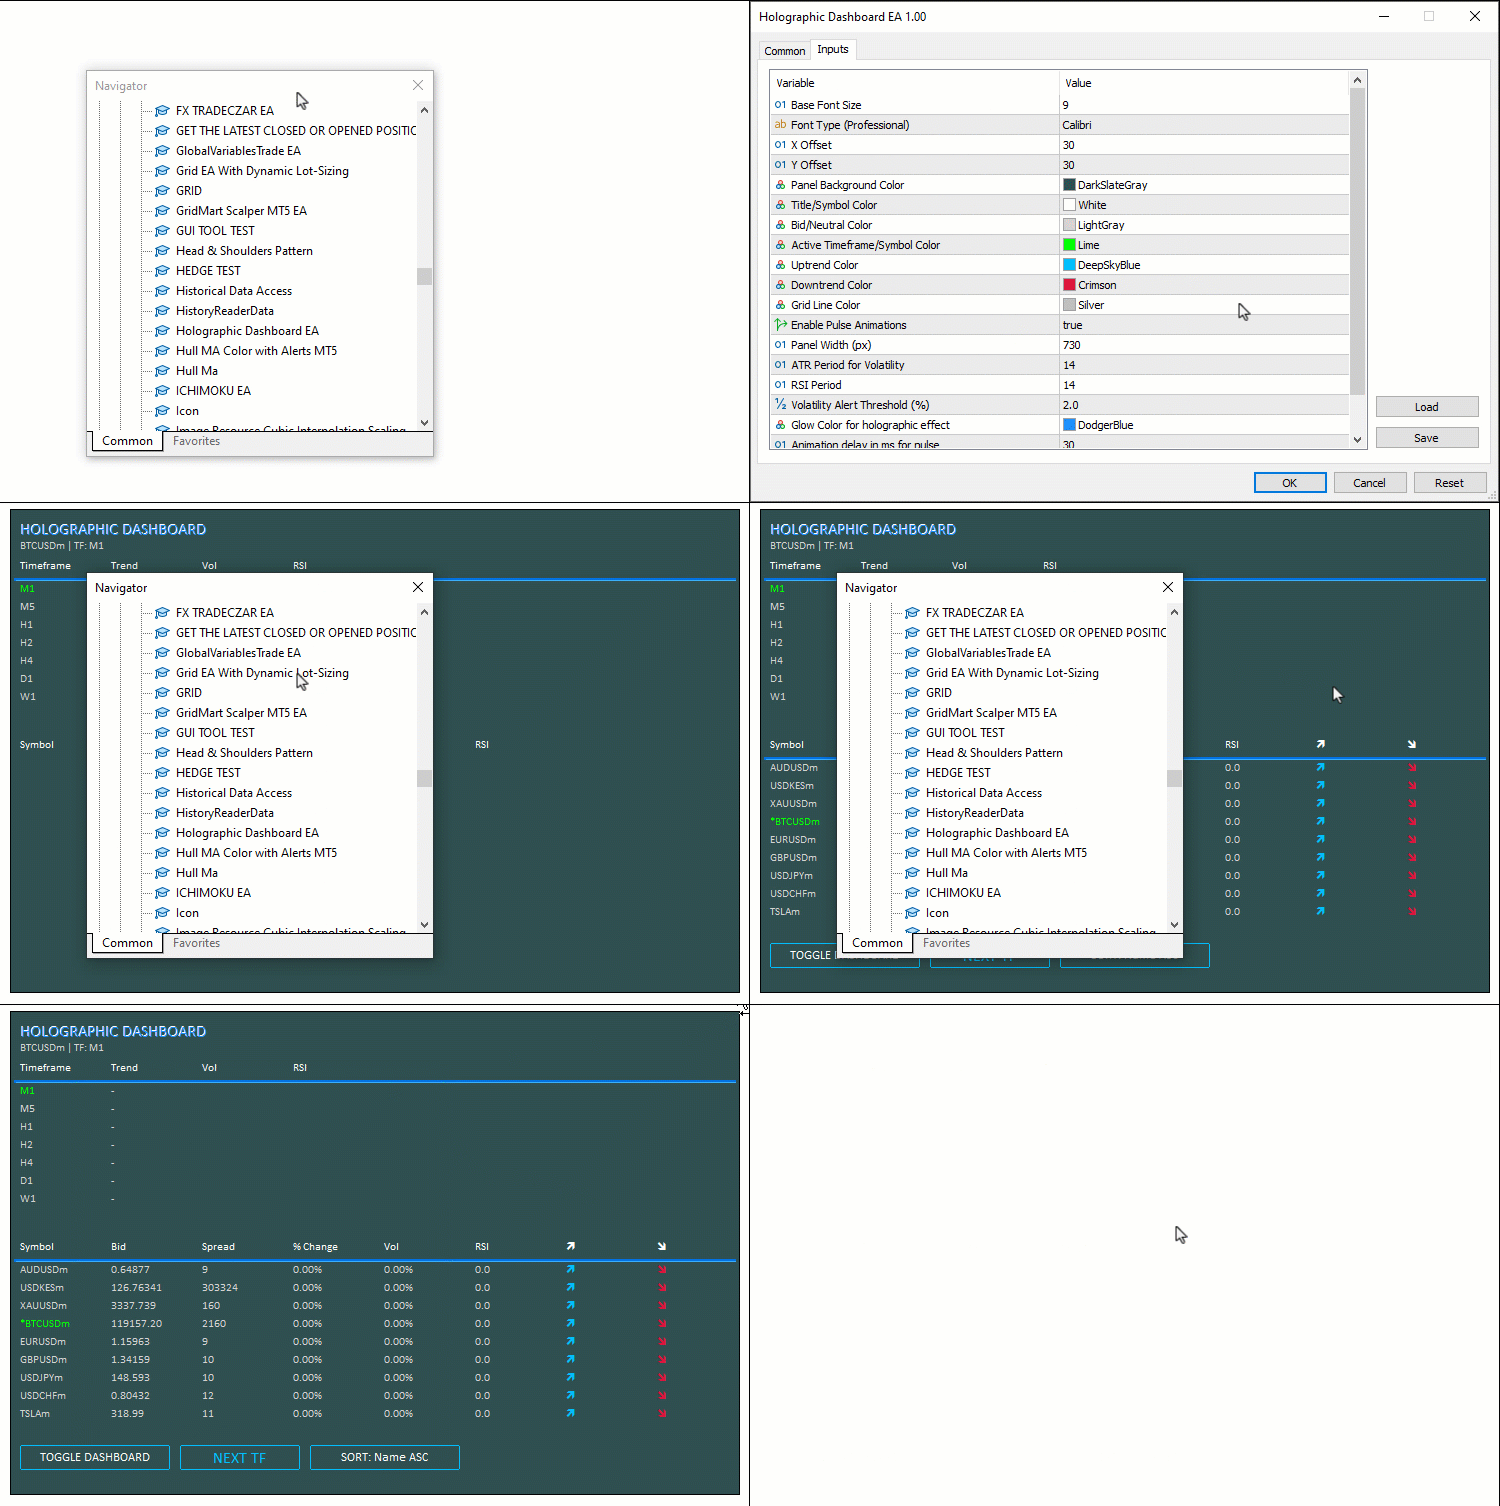
Una vez que ya nos hemos ocupado por completo de los objetos creados, podemos pasar ahora a las actualizaciones. Tenemos la intención de realizar las actualizaciones en el controlador de eventos OnTick para que todo sea más sencillo, pero también podrías realizarlas en el controlador de eventos OnTimer. Empecemos primero por la sección dedicada al marco temporal.
//+------------------------------------------------------------------+
//| Expert Tick Function with Holographic Updates                    |
//+------------------------------------------------------------------+
void OnTick() {
   if (!dashboardVisible) return;     //--- Exit if dashboard hidden

   long chartWidth;                   //--- Variable for chart width
   ChartGetInteger(0, CHART_WIDTH_IN_PIXELS, 0, chartWidth); //--- Get chart width
   int fontSize = (int)(BaseFontSize * (chartWidth / 800.0)); //--- Calculate font size
   int cellWidth = PanelWidth / 8;    //--- Calculate cell width
   int cellHeight = 18;               //--- Set cell height
   int y = Y_Offset + 75;             //--- Set y-coordinate for timeframe data

   // Update Timeframe Data with Pulse
   for (int i = 0; i < ArraySize(periods); i++) { //--- Iterate through timeframes
      double open = iOpen(_Symbol, periods[i], 0); //--- Get open price
      double close = iClose(_Symbol, periods[i], 0); //--- Get close price
      double atr_buf[1];              //--- Buffer for ATR
      if (CopyBuffer(atr_handles_tf[i], 0, 0, 1, atr_buf) != 1) { //--- Copy ATR data
         LogError(__FUNCTION__ + ": Failed to copy ATR buffer for TF " + EnumToString(periods[i])); //--- Log error
         continue;                    //--- Skip on failure
      }
      double vol = (close > 0) ? (atr_buf[0] / close) * 100 : 0.0; //--- Calculate volatility
      double rsi_buf[1];              //--- Buffer for RSI
      if (CopyBuffer(rsi_handles_tf[i], 0, 0, 1, rsi_buf) != 1) { //--- Copy RSI data
         LogError(__FUNCTION__ + ": Failed to copy RSI buffer for TF " + EnumToString(periods[i])); //--- Log error
         continue;                    //--- Skip on failure
      }
      double rsi = rsi_buf[0];        //--- Get RSI value
      color clr = DataColor;          //--- Set default color
      string trend = "-";             //--- Set default trend
      if (rsi > 50) { clr = UpColor; trend = "↑"; } //--- Set up trend
      else if (rsi < 50) { clr = DownColor; trend = "↓"; } //--- Set down trend
      createText("Trend_" + IntegerToString(i), trend, X_Offset + 10 + cellWidth, y, clr, fontSize, FontType, EnableAnimations); //--- Update trend text
      createText("Vol_" + IntegerToString(i), StringFormat("%.2f%%", vol), X_Offset + 10 + cellWidth * 2, y, vol > Vol_Alert_Threshold ? UpColor : DataColor, fontSize, FontType, vol > Vol_Alert_Threshold && EnableAnimations); //--- Update vol text
      color rsi_clr = (rsi > 70 ? DownColor : (rsi < 30 ? UpColor : DataColor)); //--- Set RSI color
      createText("RSI_" + IntegerToString(i), StringFormat("%.1f", rsi), X_Offset + 10 + cellWidth * 3, y, rsi_clr, fontSize, FontType, (rsi > 70 || rsi < 30) && EnableAnimations); //--- Update RSI text
      HolographicPulse("Period_" + IntegerToString(i), (periods[i] == _Period) ? ActiveColor : DataColor, GlowColor); //--- Pulse period text
      y += cellHeight;                //--- Update y-coordinate
   }

   // Update Symbol Data with Advanced Glow
   y += 50;                           //--- Update y-coordinate for symbol data
   for (int i = 0; i < totalSymbols; i++) { //--- Iterate through symbols
      string symbol = SymbolName(i, true); //--- Get symbol name
      double bidPrice;                //--- Variable for bid price
      if (!SymbolInfoDouble(symbol, SYMBOL_BID, bidPrice)) { //--- Get bid price
         LogError(__FUNCTION__ + ": Failed to get bid for " + symbol + ", Error: " + IntegerToString(GetLastError())); //--- Log error
         continue;                    //--- Skip on failure
      }
      long spread;                    //--- Variable for spread
      if (!SymbolInfoInteger(symbol, SYMBOL_SPREAD, spread)) { //--- Get spread
         LogError(__FUNCTION__ + ": Failed to get spread for " + symbol + ", Error: " + IntegerToString(GetLastError())); //--- Log error
         continue;                    //--- Skip on failure
      }
      double change = (prices_PrevArray[i] == 0 ? 0 : (bidPrice - prices_PrevArray[i]) / prices_PrevArray[i] * 100); //--- Calculate change
      double close = iClose(symbol, PERIOD_H1, 0); //--- Get close price
      double atr_buf[1];              //--- Buffer for ATR
      if (CopyBuffer(atr_handles_sym[i], 0, 0, 1, atr_buf) != 1) { //--- Copy ATR data
         LogError(__FUNCTION__ + ": Failed to copy ATR buffer for symbol " + symbol); //--- Log error
         continue;                    //--- Skip on failure
      }
      double vol = (close > 0) ? (atr_buf[0] / close) * 100 : 0.0; //--- Calculate volatility
      double rsi_buf[1];              //--- Buffer for RSI
      if (CopyBuffer(rsi_handles_sym[i], 0, 0, 1, rsi_buf) != 1) { //--- Copy RSI data
         LogError(__FUNCTION__ + ": Failed to copy RSI buffer for symbol " + symbol); //--- Log error
         continue;                    //--- Skip on failure
      }
      double rsi = rsi_buf[0];        //--- Get RSI value
      bid_array[i] = bidPrice;        //--- Store bid
      spread_array[i] = spread;       //--- Store spread
      change_array[i] = change;       //--- Store change
      vol_array[i] = vol;             //--- Store vol
      rsi_array[i] = rsi;             //--- Store RSI
      volatility_Array[i] = vol;      //--- Store volatility
      prices_PrevArray[i] = bidPrice; //--- Update previous price
   }
}
En la función OnTick, gestionamos las actualizaciones con cada tick del mercado, lo que garantiza la actualización de los datos en tiempo real para los marcos temporales y los símbolos. Salimos antes de tiempo si «dashboardVisible» es falso para evitar un procesamiento innecesario. Obtenemos «chartWidth» con ChartGetInteger utilizando CHART_WIDTH_IN_PIXELS, calculamos «fontSize» escalado por «chartWidth / 800,0», «cellWidth» como «PanelWidth / 8» y «cellHeight» como 18. Establecemos «y» en «Y_Offset + 75» para la cuadrícula temporal y recorremos los «periodos» con la función ArraySize. Para cada marco temporal, obtenemos el «precio de apertura» con iOpen y el «precio de cierre» con «iClose» en la posición 0, copiamos «atr_buf» con CopyBuffer desde «atr_handles_tf[i]» y calculamos «vol» como el porcentaje de ATR sobre el «precio de cierre» si es positivo.
Copiamos «rsi_buf» de «rsi_handles_tf[i]» y obtenemos «rsi», estableciendo «clr» y «trend» en función de si el RSI es > 50 para una tendencia alcista («↑» en «UpColor») o < 50 para una tendencia bajista («↓» en «DownColor»). Podríamos haber utilizado las flechas de las fuentes, pero estas, creadas a mano, se integran a la perfección y realzan el efecto holográfico. Actualizamos los textos con «createText» para la tendencia, el volumen (con el color «UpColor» si es mayor que «Vol_Alert_Threshold», con animación) y el RSI (con un color según si está en sobrecompra o sobreventa, con animación), y llamamos a «HolographicPulse» en el texto del período con «ActiveColor» si coincide con _Period. Incrementamos «y» en «cellHeight».
Actualizamos «y» en 50 para la cuadrícula de símbolos y recorremos «totalSymbols». Para cada símbolo de SymbolName cuyo valor sea «true», recuperamos «bidPrice» con «SymbolInfoDouble» utilizando «SYMBOL_BID» y «spread» con SymbolInfoInteger utilizando SYMBOL_SPREAD, registrando el resultado y omitiendo el proceso en caso de error. Calculamos la «variación» como porcentaje respecto a «prices_PrevArray[i]», obtenemos el «cierre» con iClose en «PERIOD_H1» en la posición 0, copiamos «atr_buf» desde «atr_handles_sym[i]» para calcular «vol», y «rsi_buf» de «rsi_handles_sym[i]» para obtener «rsi». Almacenamos los valores en «bid_array», «spread_array», «change_array», «vol_array», «rsi_array» y «volatility_array», y actualizamos «prices_PrevArray[i]» con «bidPrice». Ahora podemos pasar a la sección de símbolos, donde tendremos que ordenarlos y mostrarlos con efectos.
// Sort indices
for (int i = 0; i < totalSymbols; i++) indices[i] = i; //--- Initialize indices
bool swapped = true;               //--- Swap flag
while (swapped) {                  //--- Loop until no swaps
   swapped = false;                //--- Reset flag
   for (int j = 0; j < totalSymbols - 1; j++) { //--- Iterate through indices
      bool do_swap = false;        //--- Swap decision
      int a = indices[j], b = indices[j + 1]; //--- Get indices
      if (sortMode == 0) {         //--- Sort by name ASC
         string na = SymbolName(a, true), nb = SymbolName(b, true); //--- Get names
         if (na > nb) do_swap = true; //--- Swap if needed
      } else if (sortMode == 1) {  //--- Sort by vol DESC
         if (vol_array[a] < vol_array[b]) do_swap = true; //--- Swap if needed
      } else if (sortMode == 2) {  //--- Sort by change ABS DESC
         if (MathAbs(change_array[a]) < MathAbs(change_array[b])) do_swap = true; //--- Swap if needed
      } else if (sortMode == 3) {  //--- Sort by RSI DESC
         if (rsi_array[a] < rsi_array[b]) do_swap = true; //--- Swap if needed
      }
      if (do_swap) {               //--- Perform swap
         int temp = indices[j];    //--- Temporary store
         indices[j] = indices[j + 1]; //--- Swap
         indices[j + 1] = temp;    //--- Complete swap
         swapped = true;           //--- Set flag
      }
   }
}

// Display sorted symbols with pulse on high vol
for (int j = 0; j < totalSymbols; j++) { //--- Iterate through sorted indices
   int i = indices[j];                   //--- Get index
   string symbol = SymbolName(i, true);  //--- Get symbol
   double bidPrice = bid_array[i];       //--- Get bid
   long spread = spread_array[i];        //--- Get spread
   double change = change_array[i];      //--- Get change
   double vol = vol_array[i];            //--- Get vol
   double rsi = rsi_array[i];            //--- Get RSI
   color clr_s = (symbol == _Symbol) ? ActiveColor : DataColor; //--- Set symbol color
   color clr_p = DataColor, clr_sp = DataColor, clr_ch = DataColor, clr_vol = DataColor, clr_rsi = DataColor; //--- Set default colors
   color clr_a1 = DataColor, clr_a2 = DataColor; //--- Set arrow colors

   // Price Change
   if (change > 0) {               //--- Check positive change
      clr_p = UpColor; clr_ch = UpColor; clr_a1 = UpColor; clr_a2 = DataColor; //--- Set up colors
   } else if (change < 0) {        //--- Check negative change
      clr_p = DownColor; clr_ch = DownColor; clr_a1 = DataColor; clr_a2 = DownColor; //--- Set down colors
   }

   // Volatility Alert
   if (vol > Vol_Alert_Threshold) { //--- Check high volatility
      clr_vol = UpColor;            //--- Set vol color
      clr_s = (symbol == _Symbol) ? ActiveColor : UpColor; //--- Set symbol color
   }

   // RSI Color
   clr_rsi = (rsi > 70 ? DownColor : (rsi < 30 ? UpColor : DataColor)); //--- Set RSI color

   // Update Texts
   string displaySymbol = (symbol == _Symbol) ? "*" + symbol : symbol; //--- Format display symbol
   createText("Symbol_" + IntegerToString(j), displaySymbol, X_Offset + 10, y, clr_s, fontSize, FontType, vol > Vol_Alert_Threshold && EnableAnimations); //--- Update symbol text
   createText("Bid_" + IntegerToString(j), Bid(symbol), X_Offset + 10 + cellWidth, y, clr_p, fontSize, FontType, EnableAnimations); //--- Update bid text
   createText("Spread_" + IntegerToString(j), Spread(symbol), X_Offset + 10 + cellWidth * 2, y, clr_sp, fontSize, FontType); //--- Update spread text
   createText("Change_" + IntegerToString(j), StringFormat("%.2f%%", change), X_Offset + 10 + cellWidth * 3, y, clr_ch, fontSize, FontType); //--- Update change text
   createText("Vol_" + IntegerToString(j), StringFormat("%.2f%%", vol), X_Offset + 10 + cellWidth * 4, y, clr_vol, fontSize, FontType, vol > Vol_Alert_Threshold && EnableAnimations); //--- Update vol text
   createText("RSI_" + IntegerToString(j), StringFormat("%.1f", rsi), X_Offset + 10 + cellWidth * 5, y, clr_rsi, fontSize, FontType, (rsi > 70 || rsi < 30) && EnableAnimations); //--- Update RSI text
   createText("ArrowUp_" + IntegerToString(j), CharToString(236), X_Offset + 10 + cellWidth * 6, y, clr_a1, fontSize, "Wingdings"); //--- Update up arrow
   createText("ArrowDown_" + IntegerToString(j), CharToString(238), X_Offset + 10 + cellWidth * 7, y, clr_a2, fontSize, "Wingdings"); //--- Update down arrow

   // Pulse on high volatility
   if (vol > Vol_Alert_Threshold) { //--- Check high volatility
      HolographicPulse("Symbol_" + IntegerToString(j), clr_s, GlowColor); //--- Pulse symbol text
   }

   y += cellHeight;                //--- Update y-coordinate
}

ChartRedraw(0);                    //--- Redraw chart
}
Aquí ordenamos los índices inicializando primero el array «indices» desde 0 hasta «totalSymbols» - 1 en un bucle. Utilizamos un algoritmo de ordenación por burbuja con el indicador «swapped» establecido inicialmente en «true», entrando en un bucle «while» hasta que ya no se produzcan más intercambios. En el interior, restablecemos «swapped» a «false» y, a continuación, realizamos un bucle desde 0 hasta «totalSymbols» - 2, estableciendo «do_swap» en «false» y obteniendo «a» y «b» como «indices[j]» e «indices[j+1]». Dependiendo de «sortMode»: para 0 (nombre ASC), obtenemos los nombres mediante «SymbolName(a, true)» y «SymbolName(b, true)», y los intercambiamos si «na > nb»; para 1 (vol DESC), los intercambiamos si «vol_array[a] < vol_array[b]»; para 2 (variación ABS DESC), se intercambian si «MathAbs(change_array[a]) < MathAbs(change_array[b])»; para 3 (RSI DESC), se intercambian si «rsi_array[a] < rsi_array[b]». Si «do_swap», intercambiamos «indices[j]» e «indices[j+1]» utilizando una variable «temp» y establecemos «swapped» en «true».
A continuación, mostramos los símbolos ordenados recorriendo «totalSymbols», asignando «i» a «indices[j]» y, a continuación, obteniendo «symbol» mediante «SymbolName(i, true)», «bidPrice» de «bid_array[i]», «spread» de «spread_array[i]», «change» de «change_array[i]», «vol» de «vol_array[i]» y «rsi» de «rsi_array[i]». Establecemos «clr_s» en «ActiveColor» si coincide con «_Symbol»; en caso contrario, en «DataColor»; el resto de colores se establecen por defecto en «DataColor». Para el cambio de precio: si «change > 0», establece «clr_p», «clr_ch» y «clr_a1» en «UpColor» y «clr_a2» en «DataColor»; si «change < 0», establece «UpColor» en «DownColor» y «clr_a1» en «DataColor». Para la alerta de volatilidad: si «vol > Vol_Alert_Threshold», establece «clr_vol» en «UpColor» y actualiza «clr_s» si no se trata del símbolo actual. Para el RSI: establece «clr_rsi» en «DownColor» si es >70, en «UpColor» si es <30 y, en caso contrario, en «DataColor».
Formateamos «displaySymbol» con «*» si coincide con «_Symbol». Actualizar textos mediante «createText»: símbolo («Symbol_j») con «displaySymbol», «clr_s», animar si el volumen es alto y está habilitado; oferta («Bid_j») con «Bid(symbol)», «clr_p», animada si está habilitada; diferencial («Spread_j») con «Spread(symbol)», «clr_sp»; variación («Change_j») con formato «%.2f%%» mediante «StringFormat», «clr_ch»; vol («Vol_j») con formato «%.2f%%», «clr_vol», animado si el volumen es alto y está activado; RSI («RSI_j») con formato «%.1f», «clr_rsi», animado si hay sobrecompra/sobreventa y está habilitado; flecha hacia arriba («ArrowUp_j») con «CharToString(236)», «clr_a1», «Wingdings»; flecha hacia abajo («ArrowDown_j») con «CharToString(238)», «clr_a2», «Wingdings». Si el volumen es alto, aplica «HolographicPulse» al texto del símbolo con «clr_s» y «GlowColor». Incrementa «y» en «cellHeight» en cada iteración y, finalmente, vuelve a dibujar. Al compilar, obtenemos el siguiente resultado.
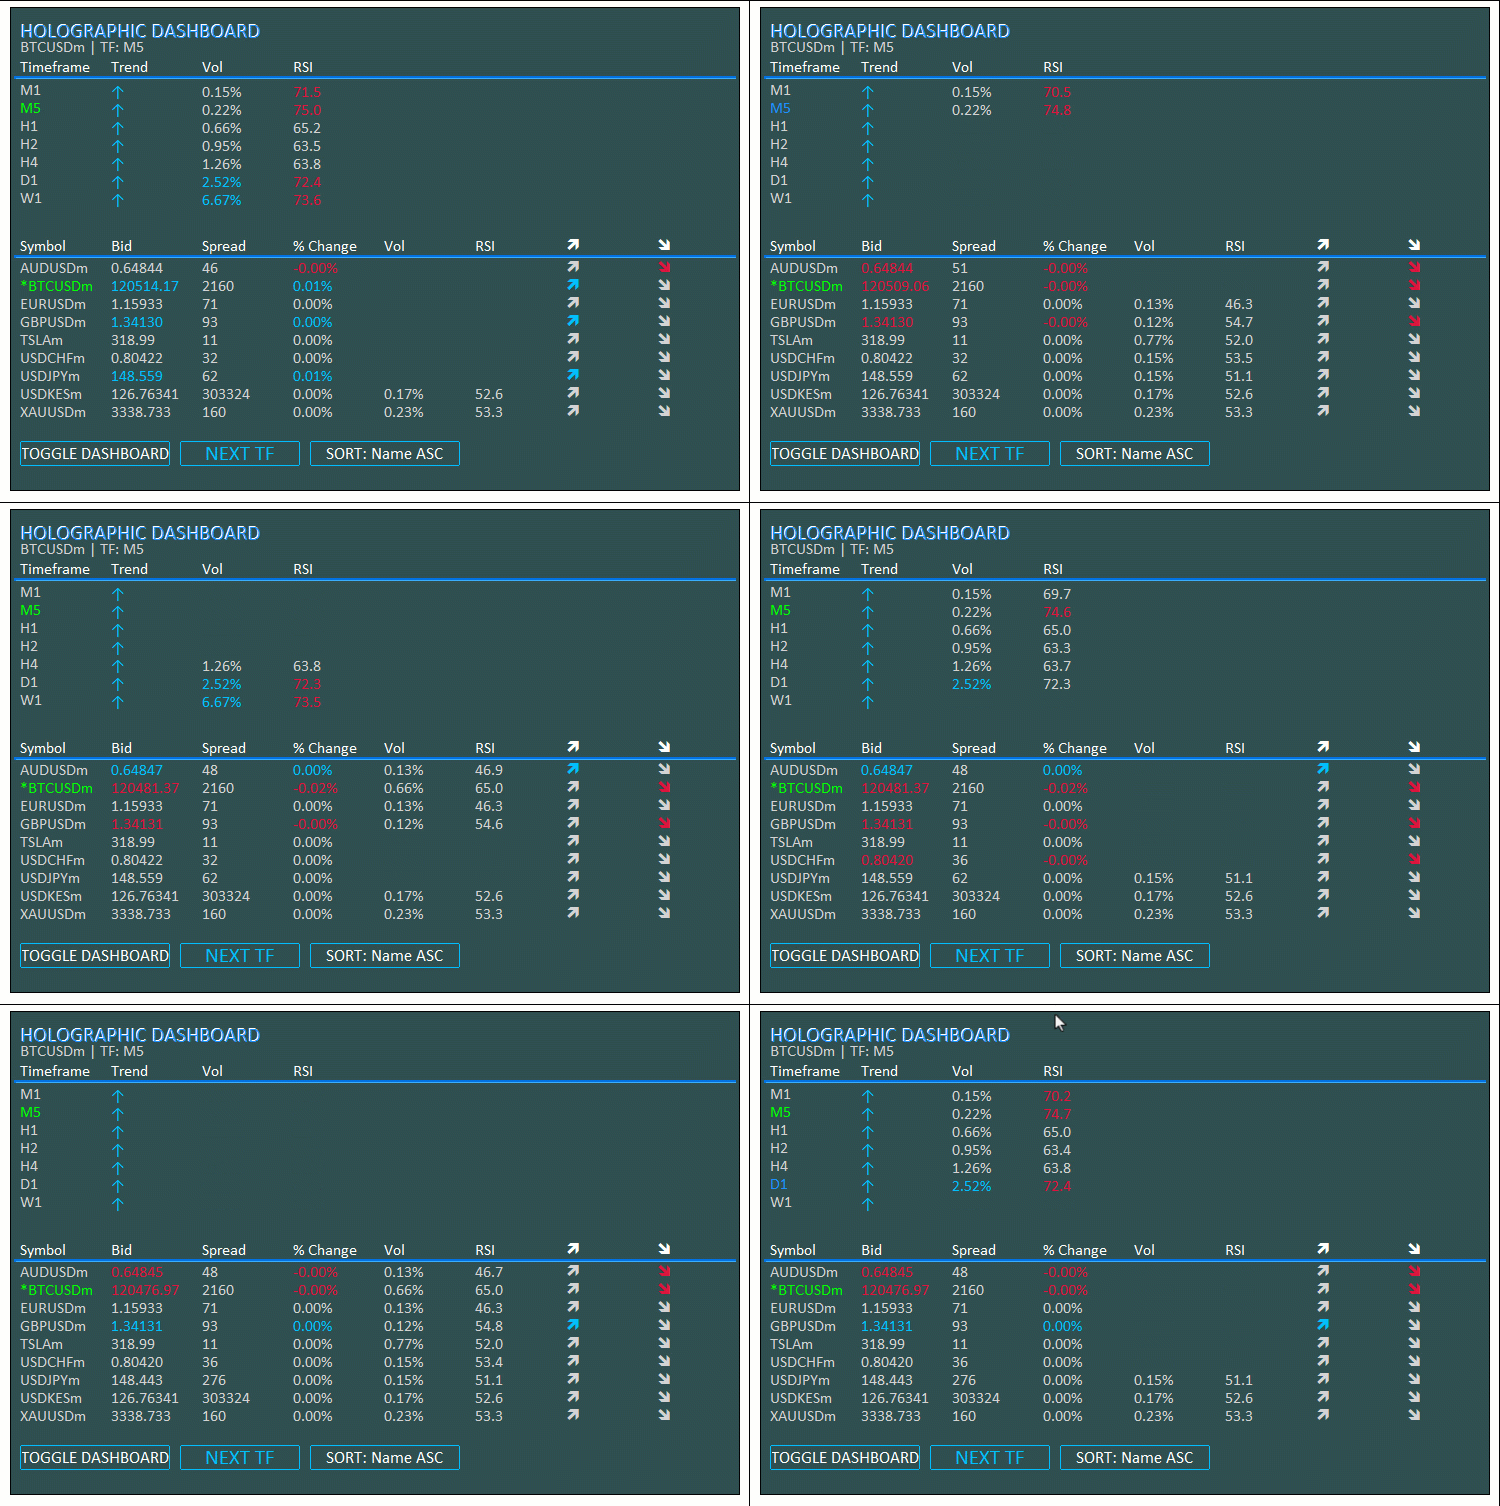
En la visualización se puede observar que las actualizaciones se aplican con cada tick del mercado. Ahora podemos dar un paso más y dar vida a los botones que hemos creado. Lo conseguiremos mediante el controlador de eventos OnChartEvent.
//+------------------------------------------------------------------+
//| Chart Event Handler                                              |
//+------------------------------------------------------------------+
void OnChartEvent(const int id, const long &lparam, const double &dparam, const string &sparam) {
   if (id == CHARTEVENT_OBJECT_CLICK) { //--- Handle click event
      if (sparam == "ToggleBtn") {    //--- Check toggle button
         dashboardVisible = !dashboardVisible; //--- Toggle visibility
         objManager.DeleteAllObjects(); //--- Delete objects
         if (dashboardVisible) {      //--- Check if visible
            InitDashboard();          //--- Reinitialize dashboard
         } else {
            createButton("ToggleBtn", "TOGGLE DASHBOARD", X_Offset + 10, Y_Offset + 10, 150, 25, TitleColor, PanelColor, UpColor); //--- Create toggle button
         }
      }
      else if (sparam == "SwitchTFBtn") { //--- Check switch TF button
         int currentIdx = -1;         //--- Initialize current index
         for (int i = 0; i < ArraySize(periods); i++) { //--- Find current timeframe
            if (periods[i] == _Period) { //--- Match found
               currentIdx = i;        //--- Set index
               break;                 //--- Exit loop
            }
         }
         int nextIdx = (currentIdx + 1) % ArraySize(periods); //--- Calculate next index
         if (!ChartSetSymbolPeriod(0, _Symbol, periods[nextIdx])) { //--- Switch timeframe
            LogError(__FUNCTION__ + ": Failed to switch timeframe, Error: " + IntegerToString(GetLastError())); //--- Log error
         }
         createButton("SwitchTFBtn", "NEXT TF", X_Offset + 170, (int)ObjectGetInteger(0, "SwitchTFBtn", OBJPROP_YDISTANCE), 120, 25, UpColor, PanelColor, UpColor, EnableAnimations); //--- Update button
      }
      else if (sparam == "SortBtn") { //--- Check sort button
         sortMode = (sortMode + 1) % 4; //--- Cycle sort mode
         createButton("SortBtn", "SORT: " + sortNames[sortMode], X_Offset + 300, (int)ObjectGetInteger(0, "SortBtn", OBJPROP_YDISTANCE), 150, 25, TitleColor, PanelColor, UpColor, EnableAnimations); //--- Update button
      }
      ObjectSetInteger(0, sparam, OBJPROP_STATE, false); //--- Reset button state
      ChartRedraw(0);                 //--- Redraw chart
   }
}
Implementamos el controlador de eventos OnChartEvent para gestionar los eventos interactivos, respondiendo a los clics en los botones para activar o desactivar la visibilidad, cambiar de marco temporal y alternar entre los modos de ordenación. Para CHARTEVENT_OBJECT_CLICK, comprobamos «sparam» con respecto a «ToggleBtn», alternamos el estado de «dashboardVisible», eliminamos los objetos con «objManager.DeleteAllObjects», y reiniciamos con «InitDashboard» si está visible o creamos un nuevo «ToggleBtn» con «createButton» si está oculto. Si «sparam» es «SwitchTFBtn», buscamos el índice del marco temporal actual en «periods» mediante un bucle, calculamos «nextIdx» como «(currentIdx + 1) % ArraySize(periods)», cambiamos el gráfico con «ChartSetSymbolPeriod» utilizando «periods[nextIdx]», registramos los errores con «LogError» y actualizamos el botón con «createButton», incluyendo una animación si «EnableAnimations» está activado.
Para «SortBtn», hacemos un bucle con «sortMode» mediante «(sortMode + 1) % 4» y actualizamos el texto del botón a «SORT: » + «sortNames[sortMode]» utilizando «createButton» con animación. Restablecemos el estado del botón con ObjectSetInteger para OBJPROP_STATE a «false» y volvemos a dibujar el gráfico con la función ChartRedraw. Esto permite controlar la visualización del panel de control y la organización de los datos. Tras la compilación, obtenemos el siguiente resultado.
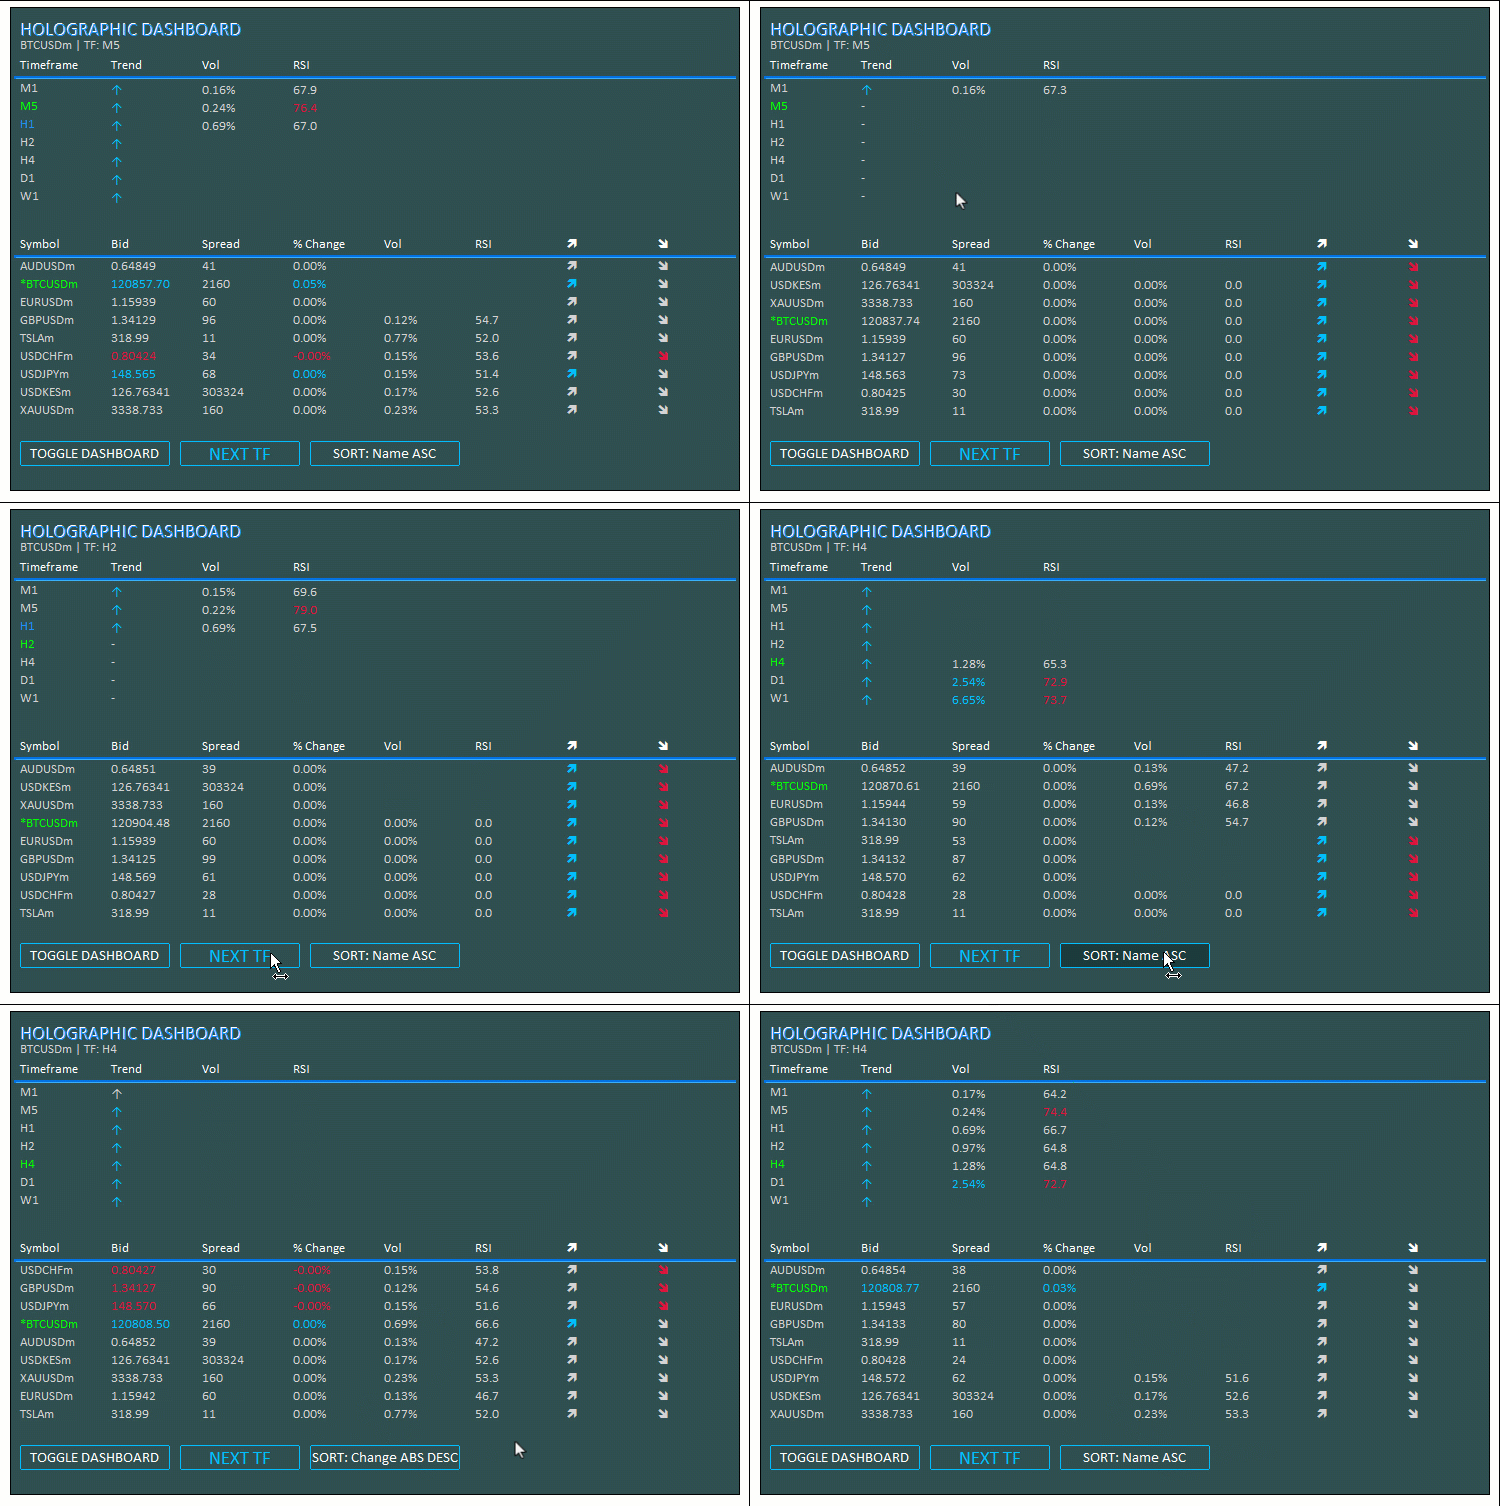
Podemos observar que podemos actualizar el panel de control con cada tick del mercado y responder a los clics en los botones para activar o desactivar el panel, cambiar el marco temporal y ordenar los índices de las métricas de los símbolos, logrando así nuestros objetivos. Ahora solo queda comprobar el funcionamiento del proyecto, y eso se aborda en la siguiente sección.
Pruebas retrospectivas (Backtesting)
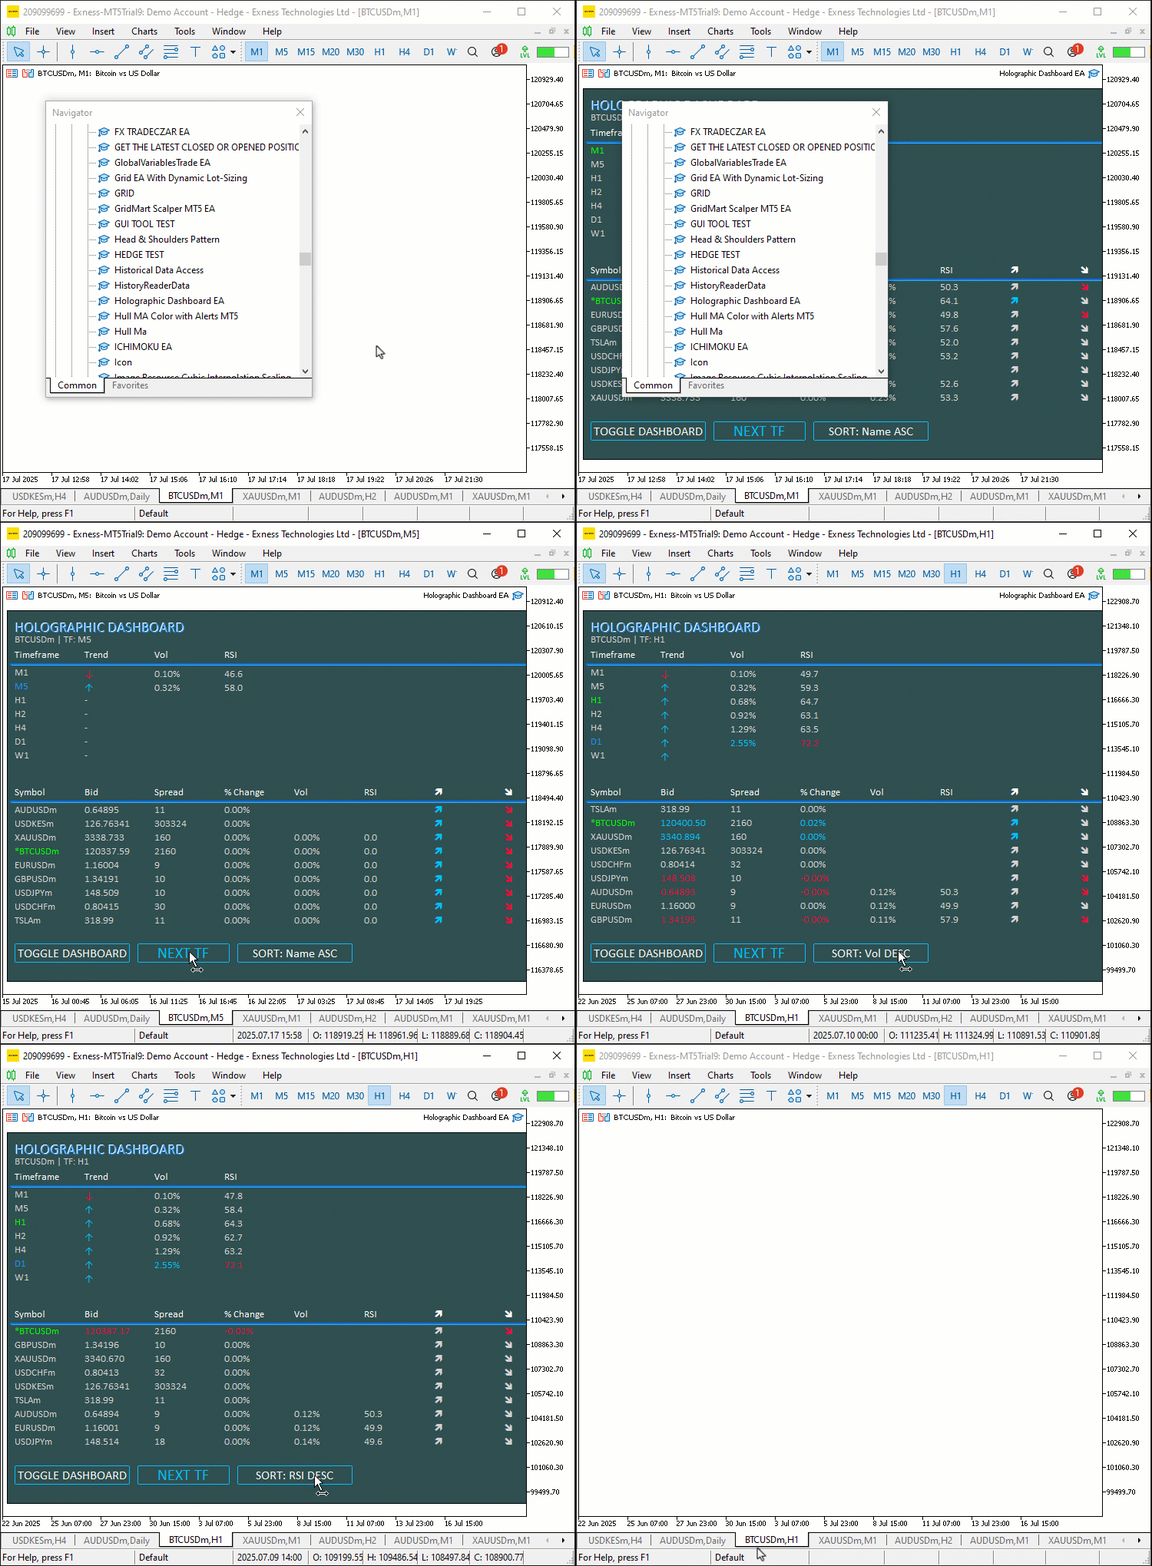
Hemos realizado las pruebas y, a continuación, se muestra la visualización compilada en una única imagen Graphics Interchange Format (GIF).
Conclusión
En conclusión, hemos creado un panel de control holográfico dinámico en MQL5 que supervisa símbolos y marcos temporales mediante el RSI, alertas de volatilidad y funciones de ordenación, y que cuenta con animaciones de pulso y botones interactivos para ofrecer una experiencia de negociación inmersiva. Hemos detallado la arquitectura y la implementación, utilizando componentes de clase como «CObjectManager» y funciones como «HolographicPulse» para ofrecer información en tiempo real y visualmente atractiva. Puedes personalizar este panel de control para adaptarlo a tus necesidades de negociación, mejorando tu análisis con efectos holográficos y controles.
Traducción del inglés realizada por MetaQuotes Ltd.
Artículo original: https://www.mql5.com/en/articles/18880
Advertencia: todos los derechos de estos materiales pertenecen a MetaQuotes Ltd. Queda totalmente prohibido el copiado total o parcial.
Este artículo ha sido escrito por un usuario del sitio web y refleja su punto de vista personal. MetaQuotes Ltd. no se responsabiliza de la exactitud de la información ofrecida, ni de las posibles consecuencias del uso de las soluciones, estrategias o recomendaciones descritas.

 Redes neuronales en el trading: entrenamiento de metaparámetros basado en la heterogeneidad (HimNet)
 Entrenamiento de un U-Transformer no lineal sobre los residuos de un modelo autorregresivo lineal
 Análisis de la dinámica horaria de los símbolos de trading y de sus spreads en MetaTrader 5
 Redes neuronales en el trading: Modelo de consultas temporales (Final)

- Aplicaciones de trading gratuitas
- 8 000+ señales para copiar
- Noticias económicas para analizar los mercados financieros
Usted acepta la política del sitio web y las condiciones de uso
He intentado instalarlo, pero no he podido porque parece que faltan dos archivos; lo único que hay en la carpeta ZIP es un documento llamado «5 holographic_dashboard_EA», y cuando intento compilarlo, me sale un error. Según la IA, faltan dos archivos, y como no sé programar, eso complica aún más las cosas, pero gracias de todos modos.
ArrayString.mqh se coloca en tu MT5 ==> Archivo ==> Abrir carpeta de datos ==> MQL5 ==> Include ==> Arrays [carpeta]. A continuación, compílalo en MetaEditor.
El archivo FileTxt.mqh va en tu MT5 > Archivo > Abrir carpeta de datos > MQL5 > Include > Files [carpeta]. A continuación, compílalo en MetaEditor.
A continuación, compila el archivo mq5.