MQL5 Trading Tools (Part 5): Creating a Rolling Ticker Tape for Real-Time Symbol Monitoring

Introduction
In our previous article (Part 4), we improved the Multi-Timeframe Scanner Dashboard with dynamic positioning and toggle features in MetaQuotes Language 5 (MQL5), enabling movable and minimizable displays for better usability. In Part 5, we create a rolling ticker tape for real-time monitoring of multiple symbols, featuring scrolling bid prices, spreads, daily percentage changes, and customizable visuals to keep traders informed at a glance. We will cover the following topics:
By the end, you’ll have a versatile MQL5 ticker tool ready for customization and integration into your trading setup—let’s dive in!
Understanding the Rolling Ticker Tape Architecture
The rolling ticker tape we’re creating is a tool to display real-time data for multiple symbols in a scrolling format, showing bid prices, spreads, and daily percentage changes to help us stay updated at a glance. This feature is important because it provides a compact, dynamic view of market movements, highlighting price trends and volatility without overwhelming the chart, which is essential for quick decision-making in fast-paced trading.
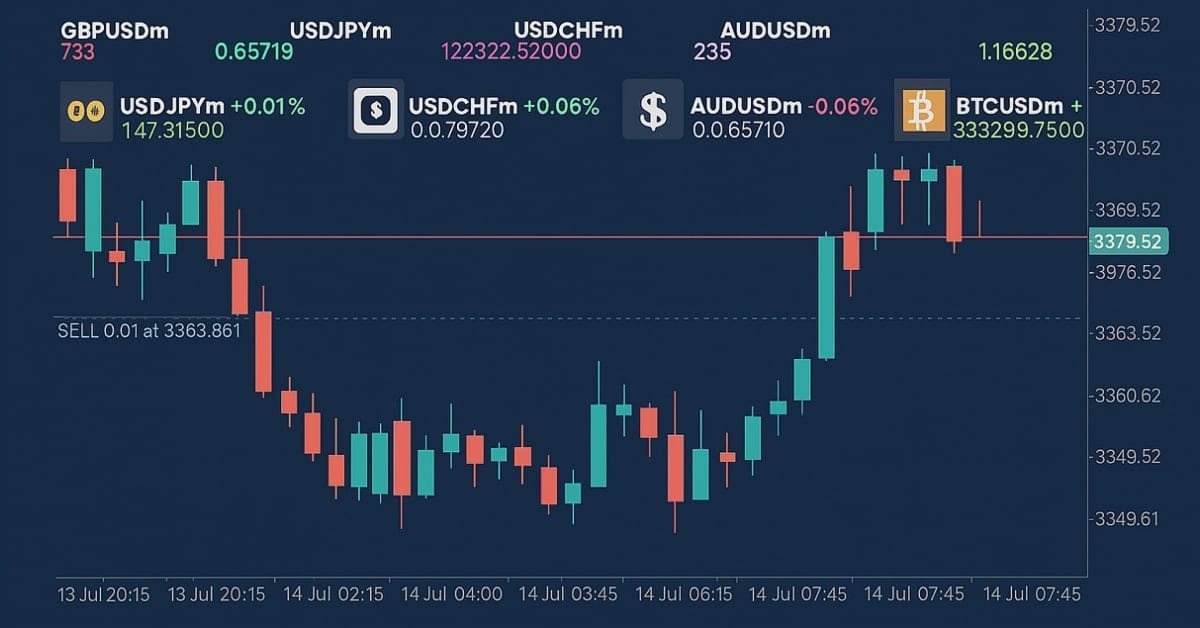
We will achieve this by structuring the display into separate scrolling lines for symbols, prices, spreads, and changes, using customizable speeds and colors to indicate up or down movements. We plan to use arrays for symbol data and timers for smooth scrolling, ensuring the ticker adapts to user preferences while running efficiently in the background. Let’s move on to see how we bring this to life! In a nutshell, below is a visualization of what we want to achieve.

Implementation in MQL5
To create the program in MQL5, we will need to define the program metadata and then define some inputs that will enable us to easily modify the functioning of the program without interfering with the code directly.
//+------------------------------------------------------------------+
//|                                      ROLLING TICKER TIMER EA.mq5 |
//|                           Copyright 2025, Allan Munene Mutiiria. |
//|                                   https://t.me/Forex_Algo_Trader |
//+------------------------------------------------------------------+
#property copyright "Copyright 2025, Allan Munene Mutiiria."
#property link      "https://t.me/Forex_Algo_Trader"
#property version   "1.00"

#include <Arrays\ArrayString.mqh> //--- Include ArrayString library for string array operations

//--- Input parameters
input string Symbols = "EURUSDm,GBPUSDm,USDJPYm,USDCHFm,AUDUSDm,BTCUSDm,TSLAm"; // Symbols to display
input int UpdateInterval = 50;                     // Update interval (milliseconds)
input int SymbolFontSize = 10;                     // Symbol font size (first line)
input string SymbolFont = "Arial Bold";            // Symbol font
input int AskFontSize = 10;                        // Ask font size (second line)
input string AskFont = "Arial";                    // Ask font
input int SpreadFontSize = 10;                     // Spread font size (third line)
input string SpreadFont = "Calibri";               // Spread font
input int SectionFontSize = 10;                    // Section currency, bid, and percent change font size
input string SectionFont = "Arial";                // Section currency, bid, and percent change font
input color FontColor = clrWhite;                  // Base font color
input color UpColor = clrLime;                     // Color for price increase (Bid text and positive % change)
input color DownColor = clrRed;                    // Color for price decrease (Bid text and negative % change)
input color ArrowUpColor = clrBlue;                // Color for up arrow
input color ArrowDownColor = clrRed;               // Color for down arrow
input int Y_Position = 30;                         // Starting Y position (pixels)
input int SymbolHorizontalSpacing = 160;           // Horizontal spacing for Symbol line (pixels)
input int AskHorizontalSpacing = 150;              // Horizontal spacing for Ask line (pixels)
input int SpreadHorizontalSpacing = 200;           // Horizontal spacing for Spread line (pixels)
input int SectionHorizontalSpacing = 170;          // Horizontal spacing for Section line (pixels)
input double SymbolScrollSpeed = 3.0;              // Symbol line scroll speed (pixels per update)
input double AskScrollSpeed = 1.3;                 // Ask line scroll speed (pixels per update)
input double SpreadScrollSpeed = 10.0;             // Spread line scroll speed (pixels per update)
input double SectionScrollSpeed = 2.7;             // Section scroll speed (pixels per update)
input bool ShowSpread = true;                      // Show spread line
input color BackgroundColor = clrBlack;            // Background rectangle color
input int BackgroundOpacity = 100;                 // Background opacity (0-255, limited effect)
Here, we begin implementing our Rolling Ticker Tape for Real-Time Symbol Monitoring in MQL5 by including the "<Arrays\ArrayString.mqh>" library and defining the input parameters for customization. We include "<Arrays\ArrayString.mqh>" to enable efficient string array operations, essential for handling and splitting the list of symbols to display. The input "Symbols" is a string set to "EURUSDm, GBPUSDm, USDJPYm, USDCHFm, AUDUSDm, BTCUSDm, TSLAm" to specify the symbols for monitoring, allowing us to configure which assets appear in the ticker. We set "UpdateInterval" to 50 milliseconds for the refresh rate, balancing responsiveness and performance.
For visual customization, we define "SymbolFontSize" at 10, "SymbolFont" as "Arial Bold" for the symbol line, "AskFontSize" at 10, "AskFont" as "Arial" for the ask price line, "SpreadFontSize" at 10, "SpreadFont" as "Calibri" for the spread line, "SectionFontSize" at 10, and "SectionFont" as "Arial" for the currency, bid, and percent change section.
We provide "FontColor" as clrWhite for base text, "UpColor" as "clrLime" and "DownColor" as "clrRed" for price changes, "ArrowUpColor" as "clrBlue" and "ArrowDownColor" as "clrRed" for direction arrows. Positioning and spacing inputs include "Y_Position" at 30 pixels for the starting vertical placement, "SymbolHorizontalSpacing" at 160 pixels, "AskHorizontalSpacing" at 150 pixels, "SpreadHorizontalSpacing" at 200 pixels, and "SectionHorizontalSpacing" at 170 pixels to control layout.
Scrolling speeds are set with "SymbolScrollSpeed" at 3.0 pixels per update, "AskScrollSpeed" at 1.3, "SpreadScrollSpeed" at 10.0, and "SectionScrollSpeed" at 2.7 for independent line movement. We set "ShowSpread" to true to enable the spread line, "BackgroundColor" to "clrBlack", and "BackgroundOpacity" to 100 for the background rectangle. These inputs will allow us to tailor the ticker's appearance, behavior, and content for optimal real-time monitoring. Upon compilation, we have the following input sets.

With the inputs defined, we can continue to define some global variables and structures that we will use throughout the program and use to store recurrent information for the ticker tape, respectively.
//--- Global variables
string symbolArray[];                              //--- Array to store symbol names
int totalSymbols;                                  //--- Total number of symbols
struct SymbolData                                  //--- Structure to hold symbol price data
{
   double bid;                                     //--- Current bid price
   double ask;                                     //--- Current ask price
   double spread;                                  //--- Current spread
   double prev_bid;                                //--- Previous bid price
   double daily_open;                              //--- Daily opening price
   color bid_color;                                //--- Color for bid price display
   double percent_change;                          //--- Daily percentage change
   color percent_color;                            //--- Color for percentage change
   string arrow_char;                              //--- Arrow character for price direction
   color arrow_color;                              //--- Color for arrow
};
SymbolData prices[];                               //--- Array of symbol data structures
string dashboardName = "TickerDashboard";          //--- Name for dashboard objects
string backgroundName = "TickerBackground";        //--- Name for background object
CArrayString objManager;                           //--- Object manager for text and image objects
datetime lastDay = 0;                              //--- Track last day for daily open update
Here, we define global variables and a structure to manage symbol data and dashboard elements. We declare "symbolArray" as an array of strings to store the names of symbols from the input "Symbols". The "totalSymbols" integer will track the number of symbols after splitting the input string. We define the "SymbolData" structure to hold price information for each symbol, including "bid" for the current bid price, "ask" for the current ask price, "spread" for the calculated spread, "prev_bid" for the previous bid to detect changes, "daily_open" for the day's opening price, "bid_color" to color the bid display, "percent_change" for the daily percentage shift, "percent_color" for change coloring, "arrow_char" for direction arrows, and "arrow_color" for arrow coloring.
We create "prices" as an array of "SymbolData" structures to store data for all symbols. The "dashboardName" string is set to "TickerDashboard" for naming dashboard objects, and "backgroundName" to "TickerBackground" for the background rectangle. We use "CArrayString objManager" to manage all text and image object names for easy cleanup. Finally, "lastDay" as a datetime will track the last day to update daily opens. These globals organize symbol data and object management, enabling efficient real-time updates and scrolling. Next, we will define some global utility functions for creating the core ticker panel as follows.
//+------------------------------------------------------------------+
//| Utility Functions                                                |
//+------------------------------------------------------------------+
void LogError(string message)                      // Log error messages
{
   Print(message);                                 //--- Output message to log
}

//+------------------------------------------------------------------+
//| Create Text Label Function                                       |
//+------------------------------------------------------------------+
bool createText(string objName, string text, int x, int y, color clrTxt, int fontsize, string font)
{
   ResetLastError();                               //--- Clear last error code
   if(ObjectFind(0, objName) < 0)                  //--- Check if object does not exist
   {
      if(!ObjectCreate(0, objName, OBJ_LABEL, 0, 0, 0)) //--- Create text label object
      {
         LogError(__FUNCTION__ + ": Failed to create label: " + objName + ", Error: " + IntegerToString(GetLastError())); //--- Log creation failure
         return false;                             //--- Return failure
      }
      objManager.Add(objName);                     //--- Add object name to manager
   }
   ObjectSetInteger(0, objName, OBJPROP_XDISTANCE, x);       //--- Set x-coordinate
   ObjectSetInteger(0, objName, OBJPROP_YDISTANCE, y);       //--- Set y-coordinate
   ObjectSetInteger(0, objName, OBJPROP_CORNER, CORNER_LEFT_UPPER); //--- Set corner alignment
   ObjectSetString(0, objName, OBJPROP_TEXT, text);          //--- Set text content
   ObjectSetInteger(0, objName, OBJPROP_COLOR, clrTxt);      //--- Set text color
   ObjectSetInteger(0, objName, OBJPROP_FONTSIZE, fontsize); //--- Set font size
   ObjectSetString(0, objName, OBJPROP_FONT, font);          //--- Set font type
   ObjectSetInteger(0, objName, OBJPROP_BACK, false);        //--- Disable background
   ObjectSetInteger(0, objName, OBJPROP_SELECTABLE, false);  //--- Disable selection
   ObjectSetInteger(0, objName, OBJPROP_ZORDER, 0);          //--- Set z-order
   return true;                                              //--- Return success
}

//+------------------------------------------------------------------+
//| Create Panel Function                                            |
//+------------------------------------------------------------------+
bool createPanel(string objName, int y, int width, int height, color clr)
{
   ResetLastError();                               //--- Clear last error code
   if(ObjectFind(0, objName) < 0)                  //--- Check if panel does not exist
   {
      if(!ObjectCreate(0, objName, OBJ_RECTANGLE_LABEL, 0, 0, 0)) //--- Create rectangle panel
      {
         LogError(__FUNCTION__ + ": Failed to create panel: " + objName + ", Error: " + IntegerToString(GetLastError())); //--- Log creation failure
         return false;                             //--- Return failure
      }
      objManager.Add(objName);                     //--- Add panel to object manager
   }
   ObjectSetInteger(0, objName, OBJPROP_XDISTANCE, 0);  //--- Set x-coordinate to 0
   ObjectSetInteger(0, objName, OBJPROP_YDISTANCE, y);  //--- Set y-coordinate
   ObjectSetInteger(0, objName, OBJPROP_XSIZE, width);  //--- Set panel width
   ObjectSetInteger(0, objName, OBJPROP_YSIZE, height); //--- Set panel height
   ObjectSetInteger(0, objName, OBJPROP_BGCOLOR, clr);  //--- Set background color
   ObjectSetInteger(0, objName, OBJPROP_FILL, true);    //--- Enable fill
   ObjectSetInteger(0, objName, OBJPROP_COLOR, clr);    //--- Set border color
   ObjectSetInteger(0, objName, OBJPROP_STYLE, STYLE_SOLID); //--- Set border style
   ObjectSetInteger(0, objName, OBJPROP_WIDTH, 1);      //--- Set border width
   ObjectSetInteger(0, objName, OBJPROP_BACK, false);   //--- Enable background drawing
   ObjectSetInteger(0, objName, OBJPROP_ZORDER, -1);    //--- Set z-order behind other objects
   return true;                                         //--- Return success
}
We implement utility functions to handle error logging, text label creation, and panel setup, ensuring reliable User Interface (UI) elements and debugging. We start with the "LogError" function, which takes a "message" string and outputs it to the log using the Print function. Next, we create the "createText" function to generate text labels for the ticker display. It takes "objName", "text", "x", "y", "clrTxt", "fontsize", and "font" as parameters.
We clear the last error with ResetLastError and check if the object exists using the ObjectFind function. If not, we create a label with the ObjectCreate function as OBJ_LABEL, logging failures, and returning false. We add "objName" to "objManager" for management, then set properties with ObjectSetInteger for OBJPROP_XDISTANCE and all other integer properties and "ObjectSetString" for "OBJPROP_TEXT" and "OBJPROP_FONT". This function will ensure consistent text rendering for symbols, prices, and changes.
We then define the "createPanel" function to build the background panel. It takes "objName", "y", "width", "height", and "clr" as parameters and uses the same structure as the "createText" function, which provides a customizable background for the ticker, supporting opacity-like effects through color choice. We can now graduate to creating the tape panel, but first, let us organize the necessary data, which involves splitting the symbols' string into separate independent symbols that we can use and initializing the prices and colors data. We will do this in the OnInit event handler.
//+------------------------------------------------------------------+
//| Expert initialization function                                   |
//+------------------------------------------------------------------+
int OnInit()
{
   //--- Split symbols string into array
   totalSymbols = StringSplit(Symbols, ',', symbolArray); //--- Split input symbols into array
   ArrayResize(prices, totalSymbols);            //--- Resize prices array to match symbol count

   //--- Verify symbols exist and initialize data
   for(int i = 0; i < totalSymbols; i++)         //--- Iterate through all symbols
   {
      if(!SymbolSelect(symbolArray[i], true))    //--- Select symbol for market watch
      {
         LogError("OnInit: Symbol " + symbolArray[i] + " not found"); //--- Log symbol not found
         return(INIT_FAILED);                    //--- Return initialization failure
      }
      prices[i].bid = 0;                         //--- Initialize bid price
      prices[i].ask = 0;                         //--- Initialize ask price
      prices[i].spread = 0;                      //--- Initialize spread
      prices[i].prev_bid = 0;                    //--- Initialize previous bid
      prices[i].daily_open = iOpen(symbolArray[i], PERIOD_D1, 0); //--- Set daily opening price
      prices[i].bid_color = FontColor;           //--- Set initial bid color
      prices[i].percent_change = 0;              //--- Initialize percentage change
      prices[i].percent_color = FontColor;       //--- Set initial percent color
      prices[i].arrow_char = CharToString(236);  //--- Set default up arrow
      prices[i].arrow_color = FontColor;         //--- Set initial arrow color
   }
   ArrayPrint(symbolArray);
   ArrayPrint(prices);
}
In the OnInit event handler, we initialize our program, setting up symbols and data structures. We start by splitting the input "Symbols" string into "symbolArray" using the StringSplit function with a comma delimiter, storing the number of symbols in "totalSymbols". If you had defined any other delimiter, just use it here. We then resize "prices" to "totalSymbols" using ArrayResize to match the symbol count. Then, we loop through each symbol in "symbolArray", selecting it for the market watch with SymbolSelect and logging an error with "LogError" if it fails, returning "INIT_FAILED".
For each symbol, we initialize "prices[i].bid", "prices[i].ask", "prices[i].spread", and "prices[i].prev_bid" to 0, set "prices[i].daily_open" to the daily open price using iOpen on "PERIOD_D1", and assign initial colors and values to "prices[i].bid_color", "prices[i].percent_change", "prices[i].percent_color", "prices[i].arrow_char" (using CharToString for an up arrow), and "prices[i].arrow_color". We print "symbolArray" and "prices" with the ArrayPrint function for debugging. This ensures all symbols are valid and data is prepared for real-time updates. Upon compilation, we get the following output.

From the image, we can see that we successfully initialized all symbols and data holders, meaning everything is now ready. We can now create the dashboard background.
//+------------------------------------------------------------------+
//| Create background function                                       |
//+------------------------------------------------------------------+
void CreateBackground()
{
   int width = (int)ChartGetInteger(0, CHART_WIDTH_IN_PIXELS); //--- Get chart width
   int height = (ShowSpread ? 4 : 3) * (MathMax(MathMax(MathMax(SymbolFontSize, AskFontSize), SpreadFontSize), SectionFontSize) + 2) + 40; //--- Calculate panel height
   createPanel(backgroundName, Y_Position - 5, width, height, BackgroundColor); //--- Create background panel
}
Here, we implement the "CreateBackground" function and set up the background panel for the ticker display. We start by retrieving the chart width with the ChartGetInteger function using CHART_WIDTH_IN_PIXELS and casting it to an integer in "width". We calculate the panel height in "height" using a ternary operator on "ShowSpread" to determine if there are 4 or 3 lines, multiplying by the maximum font size from "SymbolFontSize", "AskFontSize", "SpreadFontSize", and "SectionFontSize" (plus 2 for padding) and adding 40 for extra space. Finally, we call the "createPanel" function with "backgroundName", "Y_Position - 5" for vertical alignment, "width", "height", and "BackgroundColor" to draw the background rectangle, providing a consistent base for the scrolling text elements. When we call the function on initialization, we get the following outcome.

With the background created, we can continue to create the other dashboard elements. We create a function to house everything as below.
//+------------------------------------------------------------------+
//| Create dashboard function                                        |
//+------------------------------------------------------------------+
void CreateDashboard()
{
   //--- Create text and image objects for each symbol
   for(int i = 0; i < totalSymbols; i++)         //--- Iterate through all symbols
   {
      // Determine image based on symbol
      string imageFile;                          //--- Variable for image file path
      if(symbolArray[i] == "EURUSDm")            //--- Check for EURUSDm
         imageFile = "\\Images\\euro.bmp";       //--- Set EURUSD image
      else if(symbolArray[i] == "GBPUSDm")       //--- Check for GBPUSDm
         imageFile = "\\Images\\gbpusd.bmp";     //--- Set GBPUSD image
      else if(symbolArray[i] == "USDJPYm")       //--- Check for USDJPYm
         imageFile = "\\Images\\usdjpy.bmp";     //--- Set USDJPY image
      else if(symbolArray[i] == "USDCHFm")       //--- Check for USDCHFm
         imageFile = "\\Images\\usdchf.bmp";     //--- Set USDCHF image
      else if(symbolArray[i] == "AUDUSDm")       //--- Check for AUDUSDm
         imageFile = "\\Images\\audusd.bmp";     //--- Set AUDUSD image
      else if(symbolArray[i] == "BTCUSDm")       //--- Check for BTCUSDm
         imageFile = "\\Images\\btcusd.bmp";     //--- Set BTCUSD image
      else if(symbolArray[i] == "TSLAm")         //--- Check for TSLAm
         imageFile = "\\Images\\tesla.bmp";      //--- Set Tesla image
      else
         imageFile = "\\Images\\euro.bmp";       //--- Set default image

      // Symbol line (first line)
      createText(dashboardName + "_Symbol_" + IntegerToString(i), "", (i * SymbolHorizontalSpacing), Y_Position, FontColor, SymbolFontSize, SymbolFont); //--- Create symbol text label

      // Ask line (second line)
      createText(dashboardName + "_Ask_" + IntegerToString(i), "", (i * AskHorizontalSpacing), Y_Position + SymbolFontSize + 2, FontColor, AskFontSize, AskFont); //--- Create ask price text label

      // Spread line (third line, if enabled)
      if(ShowSpread)                             //--- Check if spread display is enabled
      {
         createText(dashboardName + "_Spread_" + IntegerToString(i), "", (i * SpreadHorizontalSpacing), Y_Position + SymbolFontSize + 2 + AskFontSize + 2, FontColor, SpreadFontSize, SpreadFont); //--- Create spread text label
      }

      // Section: Image (left)
      string imageName = dashboardName + "_Image_" + IntegerToString(i); //--- Define image object name
      if(ObjectFind(0, imageName) < 0)           //--- Check if image object does not exist
      {
         if(!ObjectCreate(0, imageName, OBJ_BITMAP_LABEL, 0, 0, 0)) //--- Create image object
         {
            LogError("CreateDashboard: Failed to create image: " + imageName + ", Error: " + IntegerToString(GetLastError())); //--- Log image creation failure
            return;                              //--- Exit function
         }
         objManager.Add(imageName);              //--- Add image to object manager
      }
      ObjectSetInteger(0, imageName, OBJPROP_XDISTANCE, (i * SectionHorizontalSpacing)); //--- Set image x-coordinate
      ObjectSetInteger(0, imageName, OBJPROP_YDISTANCE, Y_Position + (ShowSpread ? SymbolFontSize + 2 + AskFontSize + 2 + SpreadFontSize + 14 : SymbolFontSize + 2 + AskFontSize + 14)); //--- Set image y-coordinate
      ObjectSetString(0, imageName, OBJPROP_BMPFILE, imageFile); //--- Set image file
      ObjectSetInteger(0, imageName, OBJPROP_CORNER, CORNER_LEFT_UPPER); //--- Set image corner alignment

      // Section: Currency (top, right of image)
      string currencyName = dashboardName + "_Currency_" + IntegerToString(i); //--- Define currency text object name
      createText(currencyName, StringFormat("%-10s", symbolArray[i]), (i * SectionHorizontalSpacing) + 35, Y_Position + (ShowSpread ? SymbolFontSize + 2 + AskFontSize + 2 + SpreadFontSize + 14 : SymbolFontSize + 2 + AskFontSize + 14), FontColor, SectionFontSize, SectionFont); //--- Create currency text label

      // Section: Percent Change (next to currency, horizontal)
      string percentChangeName = dashboardName + "_PercentChange_" + IntegerToString(i); //--- Define percent change object name
      string percentText = prices[i].percent_change >= 0 ? StringFormat("+%.2f%%", prices[i].percent_change) : StringFormat("%.2f%%", prices[i].percent_change); //--- Format percent change text
      createText(percentChangeName, percentText, (i * SectionHorizontalSpacing) + 105, Y_Position + (ShowSpread ? SymbolFontSize + 2 + AskFontSize + 2 + SpreadFontSize + 14 : SymbolFontSize + 2 + AskFontSize + 14), prices[i].percent_color, SectionFontSize, SectionFont); //--- Create percent change text label

      // Section: Arrow (below currency, right of image, Wingdings)
      string arrowName = dashboardName + "_Arrow_" + IntegerToString(i); //--- Define arrow object name
      createText(arrowName, prices[i].arrow_char, (i * SectionHorizontalSpacing) + 35, Y_Position + (ShowSpread ? SymbolFontSize + 2 + AskFontSize + 2 + SpreadFontSize + 14 : SymbolFontSize + 2 + AskFontSize + 14) + SectionFontSize + 2, prices[i].arrow_color, SectionFontSize, "Wingdings"); //--- Create arrow text label

      // Section: Bid Price (next to arrow, horizontal)
      string bidName = dashboardName + "_Bid_" + IntegerToString(i); //--- Define bid price object name
      createText(bidName, StringFormat("%.5f", prices[i].bid), (i * SectionHorizontalSpacing) + 50, Y_Position + (ShowSpread ? SymbolFontSize + 2 + AskFontSize + 2 + SpreadFontSize + 14 : SymbolFontSize + 2 + AskFontSize + 14) + SectionFontSize + 2, prices[i].bid_color, SectionFontSize, SectionFont); //--- Create bid price text label
   }
}
Here, we implement the "CreateDashboard" function to set up the visual elements of the ticker display, including text labels and images for each symbol. We start by looping through "totalSymbols" and determining "imageFile" based on "symbolArray[i]" with if-else conditions, assigning specific Bitmap (BMP) files for symbols like "EURUSDm" or a default for others. We create the symbol line text with "createText" for "dashboardName + "Symbol" + IntegerToString(i)", positioned at "(i * SymbolHorizontalSpacing)" and "Y_Position".
For the ask line, we create another text label with "createText" for "dashboardName + 'Ask' + IntegerToString(i)", positioned at "(i * AskHorizontalSpacing)" and "Y_Position + SymbolFontSize + 2". If "ShowSpread" is true, we add a spread line text with "createText" for "dashboardName + "Spread" + IntegerToString(i)", positioned accordingly.
For the section, we create an image object with the ObjectCreate function as OBJ_BITMAP_LABEL if not existing, add it to "objManager", set its position with "ObjectSetInteger", and assign "imageFile" with the "ObjectSetString" function. Note that you need the image files as BMP files. We used the default directory as follows, but you can use your own.

We then create currency text with "createText" for "dashboardName + "Currency" + IntegerToString(i)", formatted with the StringFormat function. For percent change, we format "percentText" based on "prices[i].percent_change" and create text with "createText". We add an arrow label with "createText" using "prices[i].arrow_char" and "Wingdings" font. Finally, we create bid price text with "createText" using "StringFormat" for "prices[i].bid". This function will build the multi-line ticker layout with images and dynamic text for scrolling real-time data. Now, just call the function on initialization, and this is the output we get.

What we get is a static dashboard. What we now need to do is update the dashboard. For real-time updates, we don't want to rely on tick-based updates, because that would entirely rely on the tick frequency of the symbol to which the program is attached. What we want to do is use timer-based updates so that updates are done frequently. Let us define the functions to update the dashboard and background when needed first.
//+------------------------------------------------------------------+
//| Update background function                                       |
//+------------------------------------------------------------------+
void UpdateBackground()
{
   int width = (int)ChartGetInteger(0, CHART_WIDTH_IN_PIXELS); //--- Get current chart width
   int height = (ShowSpread ? 4 : 3) * (MathMax(MathMax(MathMax(SymbolFontSize, AskFontSize), SpreadFontSize), SectionFontSize) + 2) + 40; //--- Recalculate panel height
   ObjectSetInteger(0, backgroundName, OBJPROP_XSIZE, width);  //--- Update panel width
   ObjectSetInteger(0, backgroundName, OBJPROP_YSIZE, height); //--- Update panel height
}

//+------------------------------------------------------------------+
//| Update dashboard function                                        |
//+------------------------------------------------------------------+
void UpdateDashboard()
{
   static double symbolOffset = 0;                //--- Track symbol line offset
   static double askOffset = 0;                   //--- Track ask line offset
   static double spreadOffset = 0;                //--- Track spread line offset
   static double sectionOffset = 0;               //--- Track section offset
   int totalWidthSymbol = totalSymbols * SymbolHorizontalSpacing;   //--- Calculate total symbol line width
   int totalWidthAsk = totalSymbols * AskHorizontalSpacing;         //--- Calculate total ask line width
   int totalWidthSpread = totalSymbols * SpreadHorizontalSpacing;   //--- Calculate total spread line width
   int totalWidthSection = totalSymbols * SectionHorizontalSpacing; //--- Calculate total section width
   int rightEdge = (int)ChartGetInteger(0, CHART_WIDTH_IN_PIXELS);  //--- Get chart right boundary

   //--- Update text and image objects
   for(int i = 0; i < totalSymbols; i++)         //--- Iterate through all symbols
   {
      // Symbol line (first line)
      string symbolName = dashboardName + "_Symbol_" + IntegerToString(i); //--- Define symbol object name
      double symbolXPos = (i * SymbolHorizontalSpacing) - symbolOffset; //--- Calculate symbol x-position
      if(symbolXPos < -SymbolHorizontalSpacing) symbolXPos += totalWidthSymbol; //--- Wrap around if off-screen
      createText(symbolName, StringFormat("%-10s", symbolArray[i]), (int)symbolXPos, Y_Position, FontColor, SymbolFontSize, SymbolFont); //--- Update symbol text
      ObjectSetInteger(0, symbolName, OBJPROP_HIDDEN, symbolXPos > rightEdge || symbolXPos < 0); //--- Hide if off-screen

      // Ask line (second line)
      string askName = dashboardName + "_Ask_" + IntegerToString(i); //--- Define ask object name
      double askXPos = (i * AskHorizontalSpacing) - askOffset;       //--- Calculate ask x-position
      if(askXPos < -AskHorizontalSpacing) askXPos += totalWidthAsk;  //--- Wrap around if off-screen
      createText(askName, StringFormat("%.5f", prices[i].ask), (int)askXPos, Y_Position + SymbolFontSize + 2, clrMagenta, AskFontSize, AskFont); //--- Update ask text
      ObjectSetInteger(0, askName, OBJPROP_HIDDEN, askXPos > rightEdge || askXPos < 0); //--- Hide if off-screen

      // Spread line (third line)
      if(ShowSpread)                             //--- Check if spread display is enabled
      {
         string spreadName = dashboardName + "_Spread_" + IntegerToString(i);      //--- Define spread object name
         double spreadXPos = (i * SpreadHorizontalSpacing) - spreadOffset;         //--- Calculate spread x-position
         if(spreadXPos < -SpreadHorizontalSpacing) spreadXPos += totalWidthSpread; //--- Wrap around if off-screen
         createText(spreadName, StringFormat("%.1f", prices[i].spread), (int)spreadXPos, Y_Position + SymbolFontSize + 2 + AskFontSize + 2, clrAqua, SpreadFontSize, SpreadFont); //--- Update spread text
         ObjectSetInteger(0, spreadName, OBJPROP_HIDDEN, spreadXPos > rightEdge || spreadXPos < 0); //--- Hide if off-screen
      }

      // Section (Image, Currency, Percent Change, Arrow, Bid Price)
      double sectionXPos = (i * SectionHorizontalSpacing) - sectionOffset;          //--- Calculate section x-position
      if(sectionXPos < -SectionHorizontalSpacing) sectionXPos += totalWidthSection; //--- Wrap around if off-screen

      // Image (left)
      string imageName = dashboardName + "_Image_" + IntegerToString(i); //--- Define image object name
      ObjectSetInteger(0, imageName, OBJPROP_XDISTANCE, (int)sectionXPos); //--- Update image x-coordinate
      ObjectSetInteger(0, imageName, OBJPROP_YDISTANCE, Y_Position + (ShowSpread ? SymbolFontSize + 2 + AskFontSize + 2 + SpreadFontSize + 14 : SymbolFontSize + 2 + AskFontSize + 14)); //--- Update image y-coordinate
      ObjectSetInteger(0, imageName, OBJPROP_HIDDEN, sectionXPos > rightEdge || sectionXPos < 0); //--- Hide if off-screen

      // Currency (top, right of image)
      string currencyName = dashboardName + "_Currency_" + IntegerToString(i); //--- Define currency object name
      createText(currencyName, StringFormat("%-10s", symbolArray[i]), (int)sectionXPos + 35, Y_Position + (ShowSpread ? SymbolFontSize + 2 + AskFontSize + 2 + SpreadFontSize + 14 : SymbolFontSize + 2 + AskFontSize + 14), FontColor, SectionFontSize, "Arial Bold"); //--- Update currency text

      // Percent Change (next to currency, horizontal)
      string percentChangeName = dashboardName + "_PercentChange_" + IntegerToString(i); //--- Define percent change object name
      string percentText = prices[i].percent_change >= 0 ? StringFormat("+%.2f%%", prices[i].percent_change) : StringFormat("%.2f%%", prices[i].percent_change); //--- Format percent change
      createText(percentChangeName, percentText, (int)sectionXPos + 105, Y_Position + (ShowSpread ? SymbolFontSize + 2 + AskFontSize + 2 + SpreadFontSize + 14 : SymbolFontSize + 2 + AskFontSize + 14), prices[i].percent_color, SectionFontSize, SectionFont); //--- Update percent change text

      // Arrow (below currency, right of image, Wingdings)
      string arrowName = dashboardName + "_Arrow_" + IntegerToString(i); //--- Define arrow object name
      createText(arrowName, prices[i].arrow_char, (int)sectionXPos + 35, Y_Position + (ShowSpread ? SymbolFontSize + 2 + AskFontSize + 2 + SpreadFontSize + 14 : SymbolFontSize + 2 + AskFontSize + 14) + SectionFontSize + 2, prices[i].arrow_color, SectionFontSize, "Wingdings"); //--- Update arrow text

      // Bid Price (next to arrow, horizontal)
      string bidName = dashboardName + "_Bid_" + IntegerToString(i); //--- Define bid object name
      createText(bidName, StringFormat("%.5f", prices[i].bid), (int)sectionXPos + 50, Y_Position + (ShowSpread ? SymbolFontSize + 2 + AskFontSize + 2 + SpreadFontSize + 14 : SymbolFontSize + 2 + AskFontSize + 14) + SectionFontSize + 2, prices[i].bid_color, SectionFontSize, SectionFont); //--- Update bid price text
   }

   //--- Increment offsets for scrolling effect
   symbolOffset = fmod(symbolOffset + SymbolScrollSpeed, totalWidthSymbol);     //--- Update symbol line offset
   askOffset = fmod(askOffset + AskScrollSpeed, totalWidthAsk);                 //--- Update ask line offset
   spreadOffset = fmod(spreadOffset + SpreadScrollSpeed, totalWidthSpread);     //--- Update spread line offset
   sectionOffset = fmod(sectionOffset + SectionScrollSpeed, totalWidthSection); //--- Update section offset

   //--- Redraw chart
   ChartRedraw();                                //--- Refresh chart display
}
Here, we implement the "UpdateBackground" function to adjust the background panel on chart resizes. We retrieve the current chart width with the ChartGetInteger function using CHART_WIDTH_IN_PIXELS and cast it to an integer in "width". We recalculate the panel height in "height" using a ternary operator on "ShowSpread" to determine if there are 4 or 3 lines, multiplying by the maximum font size from "SymbolFontSize", "AskFontSize", "SpreadFontSize", and "SectionFontSize" (plus 2 for padding) and adding 40 for extra space. Finally, we update the panel dimensions with ObjectSetInteger for "OBJPROP_XSIZE" and OBJPROP_YSIZE on "backgroundName".
Next, we implement the "UpdateDashboard" function to handle scrolling and updates for text and image objects. We define static offsets "symbolOffset", "askOffset", "spreadOffset", and "sectionOffset" to track line positions. We calculate total widths "totalWidthSymbol", "totalWidthAsk", "totalWidthSpread", and "totalWidthSection" by multiplying "totalSymbols" with respective spacing inputs. We get the chart's right edge with "ChartGetInteger" using "CHART_WIDTH_IN_PIXELS". We loop through "totalSymbols", updating each symbol's position with "symbolXPos" adjusted by "symbolOffset", wrapping with modulo if off-screen, and call "createText" to update the text, hiding it with "ObjectSetInteger" for "OBJPROP_HIDDEN" if outside "rightEdge".
We do similar updates for ask, spread (if "ShowSpread"), and section elements, including images with "ObjectSetInteger" for OBJPROP_XDISTANCE and "OBJPROP_YDISTANCE", currency, percent change (formatted with StringFormat), arrow (using "prices[i].arrow_char"), and bid text. We increment offsets with "fmod" using scroll speeds, and call ChartRedraw to refresh the display. These functions will ensure the ticker adapts to changes and scrolls smoothly for real-time monitoring. We can then call in the OnTimer event handler, but first, we will need to set the timer interval. This is very necessary.
//--- Set timer
EventSetMillisecondTimer(UpdateInterval);     //--- Set timer for updates

//--- Initialize last day
lastDay = TimeCurrent() / 86400;              //--- Set current day for daily open tracking
Here, we just set the timer interval by calling the EventSetMillisecondTimer function and passing in the defined update interval, and lastly, initialize the last day variable for new day tracking. We can now define the timer logic.
//+------------------------------------------------------------------+
//| Expert timer function                                            |
//+------------------------------------------------------------------+
void OnTimer()
{
   //--- Check for new day to update daily open
   datetime currentDay = TimeCurrent() / 86400;  //--- Calculate current day
   if(currentDay > lastDay)                      //--- Check if new day
   {
      for(int i = 0; i < totalSymbols; i++)      //--- Iterate through symbols
      {
         prices[i].daily_open = iOpen(symbolArray[i], PERIOD_D1, 0); //--- Update daily open price
      }
      lastDay = currentDay;                      //--- Update last day
   }

   //--- Update background size in case chart is resized
   UpdateBackground();                           //--- Update background dimensions

   //--- Update dashboard display
   UpdateDashboard();                            //--- Update dashboard visuals
}
Here, we implement the OnTimer event handler to manage periodic updates in our Rolling Ticker Tape for Real-Time Symbol Monitoring, triggered at the interval set by "UpdateInterval". We start by calculating "currentDay" as TimeCurrent divided by 86400 to get the day in seconds, which is 1 day * 24 hours * 60 minutes * 60 seconds. If "currentDay" is greater than "lastDay", we loop through "totalSymbols" and update "prices[i].daily_open" for each symbol using iOpen on "PERIOD_D1" with shift 0, then set "lastDay" to "currentDay" to track the new day. This ensures daily percentage changes reset correctly at midnight.
Next, we call "UpdateBackground" to adjust the background panel if the chart is resized. Finally, we call "UpdateDashboard" to refresh all text and image objects with current data and scrolling positions, keeping the ticker dynamic and responsive to time-based changes. We get the following outcome.

From the visualization, we can see that we have an effective tape that is rolling. We now need to update the prices, and that will be all. Let us have that update logic in a function as well.
//+------------------------------------------------------------------+
//| Update prices function                                           |
//+------------------------------------------------------------------+
void UpdatePrices()
{
   for(int i = 0; i < totalSymbols; i++)         //--- Iterate through all symbols
   {
      double bid = SymbolInfoDouble(symbolArray[i], SYMBOL_BID); //--- Retrieve current bid price
      double ask = SymbolInfoDouble(symbolArray[i], SYMBOL_ASK); //--- Retrieve current ask price

      //--- Validate prices
      if(bid == 0 || ask == 0)                   //--- Check for invalid prices
      {
         LogError("UpdatePrices: Failed to retrieve prices for " + symbolArray[i]); //--- Log price retrieval failure
         continue;                               //--- Skip to next symbol
      }

      //--- Update color and arrow based on price change (tick-to-tick for bid and arrow)
      if(bid > prices[i].prev_bid && prices[i].prev_bid != 0) //--- Check if bid increased
      {
         prices[i].bid_color = UpColor;            //--- Set bid color to up color
         prices[i].arrow_char = CharToString(236); //--- Set up arrow character
         prices[i].arrow_color = ArrowUpColor;     //--- Set arrow to up color
      }
      else if(bid < prices[i].prev_bid && prices[i].prev_bid != 0) //--- Check if bid decreased
      {
         prices[i].bid_color = DownColor;          //--- Set bid color to down color
         prices[i].arrow_char = CharToString(238); //--- Set down arrow character
         prices[i].arrow_color = ArrowDownColor;   //--- Set arrow to down color
      }
      else                                         //--- Handle no change or first tick
      {
         prices[i].bid_color = FontColor;          //--- Set bid color to default
         prices[i].arrow_char = CharToString(236); //--- Set default up arrow
         prices[i].arrow_color = FontColor;        //--- Set arrow to default color
      }

      //--- Calculate daily percentage change
      prices[i].percent_change = prices[i].daily_open != 0 ? ((bid - prices[i].daily_open) / prices[i].daily_open) * 100 : 0; //--- Compute percentage change
      prices[i].percent_color = prices[i].percent_change >= 0 ? UpColor : DownColor; //--- Set percent color based on change

      //--- Update data
      prices[i].bid = bid;                       //--- Store current bid
      prices[i].ask = ask;                       //--- Store current ask
      prices[i].spread = (ask - bid) * MathPow(10, SymbolInfoInteger(symbolArray[i], SYMBOL_DIGITS)); //--- Calculate spread
      prices[i].prev_bid = bid;                  //--- Update previous bid
   }
}
We implement the "UpdatePrices" function to refresh symbol data. We loop through "totalSymbols" and retrieve "bid" and "ask" for each "symbolArray[i]" using the "SymbolInfoDouble" function with SYMBOL_BID and "SYMBOL_ASK". If "bid" or "ask" is 0, we log an error with "LogError" and skip to the next symbol. We update "bid_color", "arrow_char" (using the CharToString function for up or down arrows), and "arrow_color" based on whether "bid" is greater than, less than, or equal to "prev_bid" (ignoring initial 0). The arrows are in the default MQL5 Wingdings structure, which is as follows.

You can use the arrow code that makes you happy, though. We then calculate "percent_change" using "daily_open" and set "percent_color" with a ternary operator for up or down. Finally, we update "prices[i].bid", "prices[i].ask", "spread" (calculated with MathPow and SymbolInfoInteger for "SYMBOL_DIGITS"), and "prev_bid", ensuring current data for display and changes, keeping the ticker's prices and indicators up-to-date on every tick. We now call the function on every tick to process the price changes, or you could also call it in the on-timer function. Your choice again.
//+------------------------------------------------------------------+
//| Expert tick function                                             |
//+------------------------------------------------------------------+
void OnTick()
{
   //--- Update prices on every tick for live changes
   UpdatePrices();                               //--- Update symbol prices
}

//+------------------------------------------------------------------+
//| Expert deinitialization function                                 |
//+------------------------------------------------------------------+
void OnDeinit(const int reason)
{
   //--- Clean up objects
   for(int i = objManager.Total() - 1; i >= 0; i--) //--- Iterate through all managed objects
   {
      string name = objManager.At(i);               //--- Get object name
      if(ObjectFind(0, name) >= 0)                  //--- Check if object exists
      {
         if(!ObjectDelete(0, name))                 //--- Delete object
            LogError("OnDeinit: Failed to delete object: " + name + ", Error: " + IntegerToString(GetLastError())); //--- Log deletion failure
      }
      objManager.Delete(i);                        //--- Remove object from manager
   }
   EventKillTimer();                               //--- Stop timer
}
In the OnTick event handler, we call "UpdatePrices" to refresh bid, ask, spread, and change data for all symbols, ensuring the ticker reflects live market movements promptly. Next, we implement the OnDeinit function to clean up when the program is removed. We loop backward through "objManager" using "Total", getting each object's "name" with "At". If the object exists via ObjectFind, we delete it with the ObjectDelete function, logging failures with "LogError" if unsuccessful. We remove the name from "objManager" with the Delete operator. Finally, we stop the timer with EventKillTimer to end periodic updates. This is very necessary. This ensures all objects are properly cleared, preventing leftover elements on the chart. When we run the program, we get the following outcome.

From the visualization, we can see that everything is working out as expected, hence achieving our objectives. What now remains is testing the workability of the project, and that is handled in the preceding section.
Backtesting
We did the testing, and below is the compiled visualization in a single Graphics Interchange Format (GIF) bitmap image format.

Conclusion
In conclusion, we’ve developed a Rolling Ticker Tape in MQL5 for real-time symbol monitoring, featuring scrolling lines for bid prices, spreads, and daily changes with customizable fonts, colors, and speeds to highlight market movements effectively. We’ve demonstrated the architecture and implementation, from data structures like "SymbolData" to functions such as "UpdateDashboard" and "UpdatePrices", ensuring smooth scrolling and accurate updates for efficient trading insights. You can customize this ticker to match your needs, greatly boosting your ability to track multiple symbols and respond to price trends in real time.
Warning: All rights to these materials are reserved by MetaQuotes Ltd. Copying or reprinting of these materials in whole or in part is prohibited.
This article was written by a user of the site and reflects their personal views. MetaQuotes Ltd is not responsible for the accuracy of the information presented, nor for any consequences resulting from the use of the solutions, strategies or recommendations described.

- Free trading apps
- Over 8,000 signals for copying
- Economic news for exploring financial markets
You agree to website policy and terms of use
Not working
Did you even read the article?