MQL5 交易工具(第五部分):创建滚动行情条,实现交易品种实时监控

引言
在前一篇文章(第四部分)中,我们使用MQL5对多周期扫描面板进行了改进,增加了动态定位与开关切换功能,实现了可移动、可最小化的界面显示,提升了使用体验。在第五部分中,我们将创建一款滚动行情条,用于实时监控多个交易品种,支持滚动显示买价、点差、日内涨跌幅,并提供可自定义的可视化样式,让交易者能够一目了然地掌握市场信息。我们将涵盖以下主题:
到本文结束时,您将拥有一款灵活通用的MQL5行情滚动工具,可自定义并集成到您的交易系统中 —— 下面开始具体实现!
理解滚动行情条结构
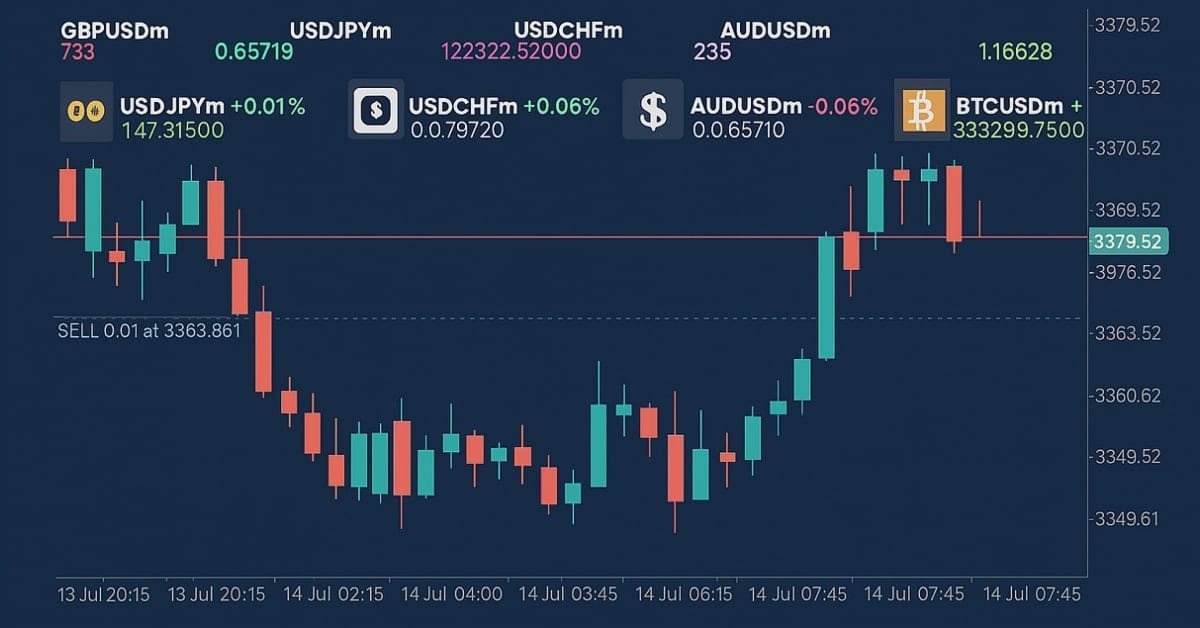
我们即将创建的滚动行情条,是一款以滚动形式展示多品种实时数据的工具,它会显示买价、点差和日内涨跌幅,方便我们快速掌握市场动态。这一功能十分重要,它能以紧凑、动态的方式呈现市场波动,突出价格趋势与波动率,同时又不会让图表信息显得拥挤或过载,这对于快节奏交易中的快速决策至关重要。
实现方式如下:我们将展示区域划分为独立的滚动行,分别显示交易品种、价格、点差和涨跌幅,并通过自定义的速度与颜色来标识涨跌走势。我们将使用数组存储交易品种数据,借助定时器实现流畅滚动,确保行情条既能适配用户偏好,又能在后台高效运行。接下来,就让我们看一下具体如何实现。简单来说,我们希望呈现的可视化效果如下:

在MQL5中的实现
要在MQL5中创建该程序,我们首先需要定义程序的基础数据,然后设置一些输入参数。这些参数能让我们在不直接修改代码的情况下,轻松调整程序的运行逻辑。
//+------------------------------------------------------------------+
//|                                      ROLLING TICKER TIMER EA.mq5 |
//|                           Copyright 2025, Allan Munene Mutiiria. |
//|                                   https://t.me/Forex_Algo_Trader |
//+------------------------------------------------------------------+
#property copyright "Copyright 2025, Allan Munene Mutiiria."
#property link      "https://t.me/Forex_Algo_Trader"
#property version   "1.00"

#include <Arrays\ArrayString.mqh> //--- Include ArrayString library for string array operations

//--- Input parameters
input string Symbols = "EURUSDm,GBPUSDm,USDJPYm,USDCHFm,AUDUSDm,BTCUSDm,TSLAm"; // Symbols to display
input int UpdateInterval = 50;                     // Update interval (milliseconds)
input int SymbolFontSize = 10;                     // Symbol font size (first line)
input string SymbolFont = "Arial Bold";            // Symbol font
input int AskFontSize = 10;                        // Ask font size (second line)
input string AskFont = "Arial";                    // Ask font
input int SpreadFontSize = 10;                     // Spread font size (third line)
input string SpreadFont = "Calibri";               // Spread font
input int SectionFontSize = 10;                    // Section currency, bid, and percent change font size
input string SectionFont = "Arial";                // Section currency, bid, and percent change font
input color FontColor = clrWhite;                  // Base font color
input color UpColor = clrLime;                     // Color for price increase (Bid text and positive % change)
input color DownColor = clrRed;                    // Color for price decrease (Bid text and negative % change)
input color ArrowUpColor = clrBlue;                // Color for up arrow
input color ArrowDownColor = clrRed;               // Color for down arrow
input int Y_Position = 30;                         // Starting Y position (pixels)
input int SymbolHorizontalSpacing = 160;           // Horizontal spacing for Symbol line (pixels)
input int AskHorizontalSpacing = 150;              // Horizontal spacing for Ask line (pixels)
input int SpreadHorizontalSpacing = 200;           // Horizontal spacing for Spread line (pixels)
input int SectionHorizontalSpacing = 170;          // Horizontal spacing for Section line (pixels)
input double SymbolScrollSpeed = 3.0;              // Symbol line scroll speed (pixels per update)
input double AskScrollSpeed = 1.3;                 // Ask line scroll speed (pixels per update)
input double SpreadScrollSpeed = 10.0;             // Spread line scroll speed (pixels per update)
input double SectionScrollSpeed = 2.7;             // Section scroll speed (pixels per update)
input bool ShowSpread = true;                      // Show spread line
input color BackgroundColor = clrBlack;            // Background rectangle color
input int BackgroundOpacity = 100;                 // Background opacity (0-255, limited effect)
现在,我们开始在MQL5中实现实时监控滚动行情条:首先引入"<Arrays\ArrayString.mqh>"库,并定义用于自定义的输入参数。从而实现高效的字符串数组操作,这对于处理和拆分待显示的交易品种列表至关重要。输入参数"Symbols"默认设置为"EURUSDm、GBPUSDm、USDJPYm、USDCHFm、AUDUSDm、BTCUSDm、TSLAm",用于指定需要监控的交易品种,我们可以自由配置在行情条中显示的资产。我们将"UpdateInterval"设置为50毫秒,在响应速度与运行性能之间取得平衡。
在界面自定义方面,我们定义了以下参数:交易品种行(将"SymbolFontSize"设置为 10,"SymbolFont"设置为"Arial Bold")、卖价行(将"AskFontSize"设置为10,"AskFont"设置为"Arial")、点差行(将"SpreadFontSize"设置为10,"SpreadFont"设置为"Calibri")以及货币、买价、涨跌幅区域(将"SectionFontSize"设置为 10,"SectionFont"设置为"Arial")
我们将基础文本的"FontColor"设置为clrWhite ,价格变动的"UpColor"设为"clrLime", "DownColor"设置为"clrRed",方向箭头的"ArrowUpColor"设置为"clrBlue","ArrowDownColor"设置为"clrRed"。定位和间距设置输入项包括:将起始垂直位置"Y_Position"设置为30像素,"SymbolHorizontalSpacing"设置为160像素,"AskHorizontalSpacing"设置为150像素,"SpreadHorizontalSpacing"设置为200像素,"SectionHorizontalSpacing"设置为170像素,用于控制布局。
滚动速度设置如下:将"SymbolScrollSpeed"设置为每次更新3.0像素,"AskScrollSpeed"设置为1.3,"SpreadScrollSpeed"设置为10.0,"SectionScrollSpeed"设置为2.7,以实现各行独立移动。我们将"ShowSpread"设置为true以启用点差线,"BackgroundColor"设为"clrBlack",并将"BackgroundOpacity"设置为100,用作背景矩形。这些输入将使我们能够调整行情显示的样式、滚动逻辑和展示内容,以实现最佳的实时监控。编译后,我们得到了以下输入集。

在定义好这些输入项之后,我们可以继续定义一些全局变量和结构体,它们将在整个程序中使用,并分别用于存储滚动行情条所需的通用信息。
//--- Global variables
string symbolArray[];                              //--- Array to store symbol names
int totalSymbols;                                  //--- Total number of symbols
struct SymbolData                                  //--- Structure to hold symbol price data
{
   double bid;                                     //--- Current bid price
   double ask;                                     //--- Current ask price
   double spread;                                  //--- Current spread
   double prev_bid;                                //--- Previous bid price
   double daily_open;                              //--- Daily opening price
   color bid_color;                                //--- Color for bid price display
   double percent_change;                          //--- Daily percentage change
   color percent_color;                            //--- Color for percentage change
   string arrow_char;                              //--- Arrow character for price direction
   color arrow_color;                              //--- Color for arrow
};
SymbolData prices[];                               //--- Array of symbol data structures
string dashboardName = "TickerDashboard";          //--- Name for dashboard objects
string backgroundName = "TickerBackground";        //--- Name for background object
CArrayString objManager;                           //--- Object manager for text and image objects
datetime lastDay = 0;                              //--- Track last day for daily open update
这里,我们定义全局变量和结构体,用于管理交易品种数据和仪表盘元素。我们声明字符串数组"symbolArray",用于存储输入项"Symbols"中的交易品种名称。整型变量"totalSymbols"用于记录拆分输入字符串后的交易品种总数。我们定义"SymbolData"结构体,用于存储每个交易品种的价格信息,其中包含:当前买价"bid"、当前卖价"ask" 、计算得出的点差"spread"、上一笔买价"prev_bid"、当日开盘价"daily_open"、买价显示的颜色"bid_color"、当日涨跌幅"percent_change"、涨跌幅的显示颜色"percent_color" 、价格方向箭头的符号"arrow_char"和箭头的颜色"arrow_color"。
我们构建"prices"数组,其元素为"SymbolData"结构体,用于存储所有交易品种的数据。将字符串变量"dashboardName"设置为"TickerDashboard",用于命名仪表盘对象;将字符串变量"backgroundName"设置为"TickerBackground",用于命名背景矩形。我们使用"CArrayString objManager"来统一管理所有文本与图形对象名称,以便后续轻松地清理。最后,通过"lastDay"记录最后一次更新的当日开盘价日期。这些全局变量负责组织交易品种数据与对象管理,以实现高效的实时更新与滚动效果。接下来,我们将定义一些全局工具函数,用于创建核心行情滚动面板,具体如下:
//+------------------------------------------------------------------+
//| Utility Functions                                                |
//+------------------------------------------------------------------+
void LogError(string message)                      // Log error messages
{
   Print(message);                                 //--- Output message to log
}

//+------------------------------------------------------------------+
//| Create Text Label Function                                       |
//+------------------------------------------------------------------+
bool createText(string objName, string text, int x, int y, color clrTxt, int fontsize, string font)
{
   ResetLastError();                               //--- Clear last error code
   if(ObjectFind(0, objName) < 0)                  //--- Check if object does not exist
   {
      if(!ObjectCreate(0, objName, OBJ_LABEL, 0, 0, 0)) //--- Create text label object
      {
         LogError(__FUNCTION__ + ": Failed to create label: " + objName + ", Error: " + IntegerToString(GetLastError())); //--- Log creation failure
         return false;                             //--- Return failure
      }
      objManager.Add(objName);                     //--- Add object name to manager
   }
   ObjectSetInteger(0, objName, OBJPROP_XDISTANCE, x);       //--- Set x-coordinate
   ObjectSetInteger(0, objName, OBJPROP_YDISTANCE, y);       //--- Set y-coordinate
   ObjectSetInteger(0, objName, OBJPROP_CORNER, CORNER_LEFT_UPPER); //--- Set corner alignment
   ObjectSetString(0, objName, OBJPROP_TEXT, text);          //--- Set text content
   ObjectSetInteger(0, objName, OBJPROP_COLOR, clrTxt);      //--- Set text color
   ObjectSetInteger(0, objName, OBJPROP_FONTSIZE, fontsize); //--- Set font size
   ObjectSetString(0, objName, OBJPROP_FONT, font);          //--- Set font type
   ObjectSetInteger(0, objName, OBJPROP_BACK, false);        //--- Disable background
   ObjectSetInteger(0, objName, OBJPROP_SELECTABLE, false);  //--- Disable selection
   ObjectSetInteger(0, objName, OBJPROP_ZORDER, 0);          //--- Set z-order
   return true;                                              //--- Return success
}

//+------------------------------------------------------------------+
//| Create Panel Function                                            |
//+------------------------------------------------------------------+
bool createPanel(string objName, int y, int width, int height, color clr)
{
   ResetLastError();                               //--- Clear last error code
   if(ObjectFind(0, objName) < 0)                  //--- Check if panel does not exist
   {
      if(!ObjectCreate(0, objName, OBJ_RECTANGLE_LABEL, 0, 0, 0)) //--- Create rectangle panel
      {
         LogError(__FUNCTION__ + ": Failed to create panel: " + objName + ", Error: " + IntegerToString(GetLastError())); //--- Log creation failure
         return false;                             //--- Return failure
      }
      objManager.Add(objName);                     //--- Add panel to object manager
   }
   ObjectSetInteger(0, objName, OBJPROP_XDISTANCE, 0);  //--- Set x-coordinate to 0
   ObjectSetInteger(0, objName, OBJPROP_YDISTANCE, y);  //--- Set y-coordinate
   ObjectSetInteger(0, objName, OBJPROP_XSIZE, width);  //--- Set panel width
   ObjectSetInteger(0, objName, OBJPROP_YSIZE, height); //--- Set panel height
   ObjectSetInteger(0, objName, OBJPROP_BGCOLOR, clr);  //--- Set background color
   ObjectSetInteger(0, objName, OBJPROP_FILL, true);    //--- Enable fill
   ObjectSetInteger(0, objName, OBJPROP_COLOR, clr);    //--- Set border color
   ObjectSetInteger(0, objName, OBJPROP_STYLE, STYLE_SOLID); //--- Set border style
   ObjectSetInteger(0, objName, OBJPROP_WIDTH, 1);      //--- Set border width
   ObjectSetInteger(0, objName, OBJPROP_BACK, false);   //--- Enable background drawing
   ObjectSetInteger(0, objName, OBJPROP_ZORDER, -1);    //--- Set z-order behind other objects
   return true;                                         //--- Return success
}
我们通过实现工具函数来处理错误日志记录、创建文本标签以及初始化面板,确保生成可靠的用户界面(UI)元素并支持调试工作。我们首先实现"LogError"函数:该函数接收一个字符串类型的参数"message",并通过Print函数将信息输出至日志中。接下来,我们创建"createText"函数,为行情滚动显示生成文本标签。该函数的参数包括:"objName"、"text"、"x"、"y"、"clrTxt"、"fontsize"和"font"。
我们调用ResetLastError清除上一次的错误信息,并通过ObjectFind函数检查图表对象是否已存在。如果对象不存在,则使用ObjectCreate函数创建一个标签对象OBJ_LABEL;如果创建失败则记录日志,并返回false。我们将"objName"添加到"objManager"中进行统一管理,随后通过ObjectSetInteger设置OBJPROP_XDISTANCE及所有其他整数类型属性,通过"ObjectSetString"设置"OBJPROP_TEXT"和 "OBJPROP_FONT"等字符串类型属性。该函数可确保交易品种、价格及涨跌幅在呈现效果上保持一致。
接下来,我们定义"createPanel"函数,用于创建背景面板。该函数接收"objName"、"y"、"width"、"height"和"clr"作为参数,采用与"createText"函数相同的代码结构;为行情滚动条提供可自定义的背景,并通过颜色选择实现模拟透明度的效果。现在我们可以进一步创建行情纸带面板,但首先需要整理所需数据:将输入的交易品种字符串拆分为彼此独立、可供调用的单个品种名称,并初始化价格与颜色数据。我们将在OnInit事件处理器中执行这些操作。
//+------------------------------------------------------------------+
//| Expert initialization function                                   |
//+------------------------------------------------------------------+
int OnInit()
{
   //--- Split symbols string into array
   totalSymbols = StringSplit(Symbols, ',', symbolArray); //--- Split input symbols into array
   ArrayResize(prices, totalSymbols);            //--- Resize prices array to match symbol count

   //--- Verify symbols exist and initialize data
   for(int i = 0; i < totalSymbols; i++)         //--- Iterate through all symbols
   {
      if(!SymbolSelect(symbolArray[i], true))    //--- Select symbol for market watch
      {
         LogError("OnInit: Symbol " + symbolArray[i] + " not found"); //--- Log symbol not found
         return(INIT_FAILED);                    //--- Return initialization failure
      }
      prices[i].bid = 0;                         //--- Initialize bid price
      prices[i].ask = 0;                         //--- Initialize ask price
      prices[i].spread = 0;                      //--- Initialize spread
      prices[i].prev_bid = 0;                    //--- Initialize previous bid
      prices[i].daily_open = iOpen(symbolArray[i], PERIOD_D1, 0); //--- Set daily opening price
      prices[i].bid_color = FontColor;           //--- Set initial bid color
      prices[i].percent_change = 0;              //--- Initialize percentage change
      prices[i].percent_color = FontColor;       //--- Set initial percent color
      prices[i].arrow_char = CharToString(236);  //--- Set default up arrow
      prices[i].arrow_color = FontColor;         //--- Set initial arrow color
   }
   ArrayPrint(symbolArray);
   ArrayPrint(prices);
}
在OnInit事件处理器中,我们对程序进行初始化,配置交易品种与数据结构。首先,我们使用StringSplit函数,以逗号作为分隔符,将输入的字符串"Symbols"拆分并存入"symbolArray"数组,并将交易品种数量存入"totalSymbols"变量。如果您之前定义了其他分隔符,直接在这里使用即可。我们通过ArrayResize函数将"prices"数组的长度调整为"totalSymbols",使其与交易品种数量匹配。接下来,我们遍历"symbolArray"数组中的每一个交易品种,通过SymbolSelect函数将其添加到市场报价列表中;如果添加失败,则通过"LogError"函数记录错误信息,并返回"INIT_FAILED"。
针对每个交易品种,我们将"prices[i].bid"、"prices[i].ask"、"prices[i].spread"以及"prices[i].prev_bid"初始化为0;通过iOpen函数将"prices[i].daily_open"设置为"PERIOD_D1"的每日开盘价;同时为以下属性分配初始颜色与数值:"prices[i].bid_color"、"prices[i].percent_change"、"prices[i].percent_color"、"prices[i].arrow_char"(使用CharToString函数将向上箭头转换为字符串)和"prices[i].arrow_color"。我们使用ArrayPrint函数打印输出"symbolArray"和"prices",以便调试排查。这样可以确保所有的交易品种有效,并为实时更新准备好数据。编译后,我们会得到以下输出。

由图可见,我们已经成功初始化所有交易品种和数据变量,意味着一切准备就绪。现在,我们可以开始构建仪表盘背景。
//+------------------------------------------------------------------+
//| Create background function                                       |
//+------------------------------------------------------------------+
void CreateBackground()
{
   int width = (int)ChartGetInteger(0, CHART_WIDTH_IN_PIXELS); //--- Get chart width
   int height = (ShowSpread ? 4 : 3) * (MathMax(MathMax(MathMax(SymbolFontSize, AskFontSize), SpreadFontSize), SectionFontSize) + 2) + 40; //--- Calculate panel height
   createPanel(backgroundName, Y_Position - 5, width, height, BackgroundColor); //--- Create background panel
}
这里,我们实现"CreateBackground"函数,并为行情滚动显示创建背景面板。首先,我们通过ChartGetInteger函数,以CHART_WIDTH_IN_PIXELS为参数获取图表宽度,并将其转换为整数后存入变量"width"。我们通过三元运算符判断"ShowSpread"(是否显示点差)的状态,以确定面板包含4行还是3行内容,之后将行数乘以这四种字体"SymbolFontSize"、"AskFontSize"、"SpreadFontSize"和"SectionFontSize"中的最大值(加上2作为内边距),最后再额外加上40像素的间距,以此计算出面板高度,并存入变量"height"中。最后,我们调用"createPanel"函数绘制背景矩形,传入参数"backgroundName"、"Y_Position - 5"(垂直对齐位置)、 "width"、"height"和"BackgroundColor",为滚动文本元素提供统一的基础背景。在初始化阶段调用该函数后,呈现的效果如下:

完成背景后,我们可以继续创建仪表盘的其他元素。我们通过创建一个函数将所有内容整合起来,如下所示:
//+------------------------------------------------------------------+
//| Create dashboard function                                        |
//+------------------------------------------------------------------+
void CreateDashboard()
{
   //--- Create text and image objects for each symbol
   for(int i = 0; i < totalSymbols; i++)         //--- Iterate through all symbols
   {
      // Determine image based on symbol
      string imageFile;                          //--- Variable for image file path
      if(symbolArray[i] == "EURUSDm")            //--- Check for EURUSDm
         imageFile = "\\Images\\euro.bmp";       //--- Set EURUSD image
      else if(symbolArray[i] == "GBPUSDm")       //--- Check for GBPUSDm
         imageFile = "\\Images\\gbpusd.bmp";     //--- Set GBPUSD image
      else if(symbolArray[i] == "USDJPYm")       //--- Check for USDJPYm
         imageFile = "\\Images\\usdjpy.bmp";     //--- Set USDJPY image
      else if(symbolArray[i] == "USDCHFm")       //--- Check for USDCHFm
         imageFile = "\\Images\\usdchf.bmp";     //--- Set USDCHF image
      else if(symbolArray[i] == "AUDUSDm")       //--- Check for AUDUSDm
         imageFile = "\\Images\\audusd.bmp";     //--- Set AUDUSD image
      else if(symbolArray[i] == "BTCUSDm")       //--- Check for BTCUSDm
         imageFile = "\\Images\\btcusd.bmp";     //--- Set BTCUSD image
      else if(symbolArray[i] == "TSLAm")         //--- Check for TSLAm
         imageFile = "\\Images\\tesla.bmp";      //--- Set Tesla image
      else
         imageFile = "\\Images\\euro.bmp";       //--- Set default image

      // Symbol line (first line)
      createText(dashboardName + "_Symbol_" + IntegerToString(i), "", (i * SymbolHorizontalSpacing), Y_Position, FontColor, SymbolFontSize, SymbolFont); //--- Create symbol text label

      // Ask line (second line)
      createText(dashboardName + "_Ask_" + IntegerToString(i), "", (i * AskHorizontalSpacing), Y_Position + SymbolFontSize + 2, FontColor, AskFontSize, AskFont); //--- Create ask price text label

      // Spread line (third line, if enabled)
      if(ShowSpread)                             //--- Check if spread display is enabled
      {
         createText(dashboardName + "_Spread_" + IntegerToString(i), "", (i * SpreadHorizontalSpacing), Y_Position + SymbolFontSize + 2 + AskFontSize + 2, FontColor, SpreadFontSize, SpreadFont); //--- Create spread text label
      }

      // Section: Image (left)
      string imageName = dashboardName + "_Image_" + IntegerToString(i); //--- Define image object name
      if(ObjectFind(0, imageName) < 0)           //--- Check if image object does not exist
      {
         if(!ObjectCreate(0, imageName, OBJ_BITMAP_LABEL, 0, 0, 0)) //--- Create image object
         {
            LogError("CreateDashboard: Failed to create image: " + imageName + ", Error: " + IntegerToString(GetLastError())); //--- Log image creation failure
            return;                              //--- Exit function
         }
         objManager.Add(imageName);              //--- Add image to object manager
      }
      ObjectSetInteger(0, imageName, OBJPROP_XDISTANCE, (i * SectionHorizontalSpacing)); //--- Set image x-coordinate
      ObjectSetInteger(0, imageName, OBJPROP_YDISTANCE, Y_Position + (ShowSpread ? SymbolFontSize + 2 + AskFontSize + 2 + SpreadFontSize + 14 : SymbolFontSize + 2 + AskFontSize + 14)); //--- Set image y-coordinate
      ObjectSetString(0, imageName, OBJPROP_BMPFILE, imageFile); //--- Set image file
      ObjectSetInteger(0, imageName, OBJPROP_CORNER, CORNER_LEFT_UPPER); //--- Set image corner alignment

      // Section: Currency (top, right of image)
      string currencyName = dashboardName + "_Currency_" + IntegerToString(i); //--- Define currency text object name
      createText(currencyName, StringFormat("%-10s", symbolArray[i]), (i * SectionHorizontalSpacing) + 35, Y_Position + (ShowSpread ? SymbolFontSize + 2 + AskFontSize + 2 + SpreadFontSize + 14 : SymbolFontSize + 2 + AskFontSize + 14), FontColor, SectionFontSize, SectionFont); //--- Create currency text label

      // Section: Percent Change (next to currency, horizontal)
      string percentChangeName = dashboardName + "_PercentChange_" + IntegerToString(i); //--- Define percent change object name
      string percentText = prices[i].percent_change >= 0 ? StringFormat("+%.2f%%", prices[i].percent_change) : StringFormat("%.2f%%", prices[i].percent_change); //--- Format percent change text
      createText(percentChangeName, percentText, (i * SectionHorizontalSpacing) + 105, Y_Position + (ShowSpread ? SymbolFontSize + 2 + AskFontSize + 2 + SpreadFontSize + 14 : SymbolFontSize + 2 + AskFontSize + 14), prices[i].percent_color, SectionFontSize, SectionFont); //--- Create percent change text label

      // Section: Arrow (below currency, right of image, Wingdings)
      string arrowName = dashboardName + "_Arrow_" + IntegerToString(i); //--- Define arrow object name
      createText(arrowName, prices[i].arrow_char, (i * SectionHorizontalSpacing) + 35, Y_Position + (ShowSpread ? SymbolFontSize + 2 + AskFontSize + 2 + SpreadFontSize + 14 : SymbolFontSize + 2 + AskFontSize + 14) + SectionFontSize + 2, prices[i].arrow_color, SectionFontSize, "Wingdings"); //--- Create arrow text label

      // Section: Bid Price (next to arrow, horizontal)
      string bidName = dashboardName + "_Bid_" + IntegerToString(i); //--- Define bid price object name
      createText(bidName, StringFormat("%.5f", prices[i].bid), (i * SectionHorizontalSpacing) + 50, Y_Position + (ShowSpread ? SymbolFontSize + 2 + AskFontSize + 2 + SpreadFontSize + 14 : SymbolFontSize + 2 + AskFontSize + 14) + SectionFontSize + 2, prices[i].bid_color, SectionFontSize, SectionFont); //--- Create bid price text label
   }
}
这里,我们实现"CreateDashboard"函数,用于搭建行情显示的可视化元素,包括每个交易品种的文本标签与图片。我们首先遍历"totalSymbols",通过if-else条件判断,根据"symbolArray[i]"确定"imageFile",为"EURUSDm"等交易品种指定专属的位图(BMP)文件,其他品种则使用默认图片。我们调用"createText"创建交易品种行的文本,对象名称为"dashboardName + "Symbol" + IntegerToString(i)",坐标位置:X 轴("i * SymbolHorizontalSpacing")和Y轴("Y_Position")。
对于卖价行,我们再次调用"createText"创建文本标签,对象名称为 dashboardName + "Ask" + IntegerToString(i),坐标位置:X 轴("i * AskHorizontalSpacing")和Y轴("Y_Position + SymbolFontSize + 2")。如果"ShowSpread"为true,我们会通过"createText"额外添加点差行文本,对象名称为 "dashboardName + "Spread" + IntegerToString(i)",并且按对应的规则设置位置。
对于分区模块,如果对象不存在,我们先通过ObjectCreate函数创建一个OBJ_BITMAP_LABEL类型的图片对象,将其添加到"objManager"中统一管理,再通过"ObjectSetInteger"设置位置,并使用 "ObjectSetString"函数为对象指定"imageFile"。请注意,您需要准备BMP格式的图片文件。我们使用的默认路径如下,您也可以使用自定义路径。

接下来,我们使用"createText"函数创建货币相关文本,对象名称为"dashboardName + "Currency" + IntegerToString(i)",并通过StringFormat函数对文本进行格式化处理。对于涨跌幅,我们基于"prices[i].percent_change"格式化生成"percentText",再通过"createText"函数创建文本。我们使用"prices[i].arrow_char",并指定"Wingdings"字体,通过"createText"函数添加箭头标签。最后,我们通过"createText"函数,结合"StringFormat"格式化"prices[i].bid",创建买价文本。该函数将搭建出多行滚动行情面板布局,包含图片与动态文本,用于展示实时滚动数据。现在只需在初始化时调用该函数,即可得到如下的输出效果:

到目前为止我们创建的只是一个静态仪表盘。现在,我们需要做的是让这个仪表盘实现数据更新。为了实现实时更新,我们不想依赖逐笔价格(tick)驱动的更新方式,因为此方式完全取决于程序所挂载交易品种的报价频率。我们希望采用基于定时器的更新机制,从而确保更新能够高频稳定地执行。首先,让我们定义相关函数,以便在需要时更新仪表盘和背景。
//+------------------------------------------------------------------+
//| Update background function                                       |
//+------------------------------------------------------------------+
void UpdateBackground()
{
   int width = (int)ChartGetInteger(0, CHART_WIDTH_IN_PIXELS); //--- Get current chart width
   int height = (ShowSpread ? 4 : 3) * (MathMax(MathMax(MathMax(SymbolFontSize, AskFontSize), SpreadFontSize), SectionFontSize) + 2) + 40; //--- Recalculate panel height
   ObjectSetInteger(0, backgroundName, OBJPROP_XSIZE, width);  //--- Update panel width
   ObjectSetInteger(0, backgroundName, OBJPROP_YSIZE, height); //--- Update panel height
}

//+------------------------------------------------------------------+
//| Update dashboard function                                        |
//+------------------------------------------------------------------+
void UpdateDashboard()
{
   static double symbolOffset = 0;                //--- Track symbol line offset
   static double askOffset = 0;                   //--- Track ask line offset
   static double spreadOffset = 0;                //--- Track spread line offset
   static double sectionOffset = 0;               //--- Track section offset
   int totalWidthSymbol = totalSymbols * SymbolHorizontalSpacing;   //--- Calculate total symbol line width
   int totalWidthAsk = totalSymbols * AskHorizontalSpacing;         //--- Calculate total ask line width
   int totalWidthSpread = totalSymbols * SpreadHorizontalSpacing;   //--- Calculate total spread line width
   int totalWidthSection = totalSymbols * SectionHorizontalSpacing; //--- Calculate total section width
   int rightEdge = (int)ChartGetInteger(0, CHART_WIDTH_IN_PIXELS);  //--- Get chart right boundary

   //--- Update text and image objects
   for(int i = 0; i < totalSymbols; i++)         //--- Iterate through all symbols
   {
      // Symbol line (first line)
      string symbolName = dashboardName + "_Symbol_" + IntegerToString(i); //--- Define symbol object name
      double symbolXPos = (i * SymbolHorizontalSpacing) - symbolOffset; //--- Calculate symbol x-position
      if(symbolXPos < -SymbolHorizontalSpacing) symbolXPos += totalWidthSymbol; //--- Wrap around if off-screen
      createText(symbolName, StringFormat("%-10s", symbolArray[i]), (int)symbolXPos, Y_Position, FontColor, SymbolFontSize, SymbolFont); //--- Update symbol text
      ObjectSetInteger(0, symbolName, OBJPROP_HIDDEN, symbolXPos > rightEdge || symbolXPos < 0); //--- Hide if off-screen

      // Ask line (second line)
      string askName = dashboardName + "_Ask_" + IntegerToString(i); //--- Define ask object name
      double askXPos = (i * AskHorizontalSpacing) - askOffset;       //--- Calculate ask x-position
      if(askXPos < -AskHorizontalSpacing) askXPos += totalWidthAsk;  //--- Wrap around if off-screen
      createText(askName, StringFormat("%.5f", prices[i].ask), (int)askXPos, Y_Position + SymbolFontSize + 2, clrMagenta, AskFontSize, AskFont); //--- Update ask text
      ObjectSetInteger(0, askName, OBJPROP_HIDDEN, askXPos > rightEdge || askXPos < 0); //--- Hide if off-screen

      // Spread line (third line)
      if(ShowSpread)                             //--- Check if spread display is enabled
      {
         string spreadName = dashboardName + "_Spread_" + IntegerToString(i);      //--- Define spread object name
         double spreadXPos = (i * SpreadHorizontalSpacing) - spreadOffset;         //--- Calculate spread x-position
         if(spreadXPos < -SpreadHorizontalSpacing) spreadXPos += totalWidthSpread; //--- Wrap around if off-screen
         createText(spreadName, StringFormat("%.1f", prices[i].spread), (int)spreadXPos, Y_Position + SymbolFontSize + 2 + AskFontSize + 2, clrAqua, SpreadFontSize, SpreadFont); //--- Update spread text
         ObjectSetInteger(0, spreadName, OBJPROP_HIDDEN, spreadXPos > rightEdge || spreadXPos < 0); //--- Hide if off-screen
      }

      // Section (Image, Currency, Percent Change, Arrow, Bid Price)
      double sectionXPos = (i * SectionHorizontalSpacing) - sectionOffset;          //--- Calculate section x-position
      if(sectionXPos < -SectionHorizontalSpacing) sectionXPos += totalWidthSection; //--- Wrap around if off-screen

      // Image (left)
      string imageName = dashboardName + "_Image_" + IntegerToString(i); //--- Define image object name
      ObjectSetInteger(0, imageName, OBJPROP_XDISTANCE, (int)sectionXPos); //--- Update image x-coordinate
      ObjectSetInteger(0, imageName, OBJPROP_YDISTANCE, Y_Position + (ShowSpread ? SymbolFontSize + 2 + AskFontSize + 2 + SpreadFontSize + 14 : SymbolFontSize + 2 + AskFontSize + 14)); //--- Update image y-coordinate
      ObjectSetInteger(0, imageName, OBJPROP_HIDDEN, sectionXPos > rightEdge || sectionXPos < 0); //--- Hide if off-screen

      // Currency (top, right of image)
      string currencyName = dashboardName + "_Currency_" + IntegerToString(i); //--- Define currency object name
      createText(currencyName, StringFormat("%-10s", symbolArray[i]), (int)sectionXPos + 35, Y_Position + (ShowSpread ? SymbolFontSize + 2 + AskFontSize + 2 + SpreadFontSize + 14 : SymbolFontSize + 2 + AskFontSize + 14), FontColor, SectionFontSize, "Arial Bold"); //--- Update currency text

      // Percent Change (next to currency, horizontal)
      string percentChangeName = dashboardName + "_PercentChange_" + IntegerToString(i); //--- Define percent change object name
      string percentText = prices[i].percent_change >= 0 ? StringFormat("+%.2f%%", prices[i].percent_change) : StringFormat("%.2f%%", prices[i].percent_change); //--- Format percent change
      createText(percentChangeName, percentText, (int)sectionXPos + 105, Y_Position + (ShowSpread ? SymbolFontSize + 2 + AskFontSize + 2 + SpreadFontSize + 14 : SymbolFontSize + 2 + AskFontSize + 14), prices[i].percent_color, SectionFontSize, SectionFont); //--- Update percent change text

      // Arrow (below currency, right of image, Wingdings)
      string arrowName = dashboardName + "_Arrow_" + IntegerToString(i); //--- Define arrow object name
      createText(arrowName, prices[i].arrow_char, (int)sectionXPos + 35, Y_Position + (ShowSpread ? SymbolFontSize + 2 + AskFontSize + 2 + SpreadFontSize + 14 : SymbolFontSize + 2 + AskFontSize + 14) + SectionFontSize + 2, prices[i].arrow_color, SectionFontSize, "Wingdings"); //--- Update arrow text

      // Bid Price (next to arrow, horizontal)
      string bidName = dashboardName + "_Bid_" + IntegerToString(i); //--- Define bid object name
      createText(bidName, StringFormat("%.5f", prices[i].bid), (int)sectionXPos + 50, Y_Position + (ShowSpread ? SymbolFontSize + 2 + AskFontSize + 2 + SpreadFontSize + 14 : SymbolFontSize + 2 + AskFontSize + 14) + SectionFontSize + 2, prices[i].bid_color, SectionFontSize, SectionFont); //--- Update bid price text
   }

   //--- Increment offsets for scrolling effect
   symbolOffset = fmod(symbolOffset + SymbolScrollSpeed, totalWidthSymbol);     //--- Update symbol line offset
   askOffset = fmod(askOffset + AskScrollSpeed, totalWidthAsk);                 //--- Update ask line offset
   spreadOffset = fmod(spreadOffset + SpreadScrollSpeed, totalWidthSpread);     //--- Update spread line offset
   sectionOffset = fmod(sectionOffset + SectionScrollSpeed, totalWidthSection); //--- Update section offset

   //--- Redraw chart
   ChartRedraw();                                //--- Refresh chart display
}
这里,我们实现"UpdateBackground"函数,用于在图表尺寸改变时自动调整背景面板。我们使用ChartGetInteger函数,以CHART_WIDTH_IN_PIXELS为参数获取当前图表宽度,并将其转换为整数后存入变量"width"中。我们通过三元运算符来判断"ShowSpread"的状态,重新计算面板行数为4行或3行,将行数乘以这四种字体"SymbolFontSize"、"AskFontSize"、"SpreadFontSize"和"SectionFontSize"中的最大值(加上2作为内边距),再额外加上40像素的间距,以此得出面板高度,并存入变量"height"中。最后,我们通过ObjectSetInteger函数,为"backgroundName"更新"OBJPROP_XSIZE"和OBJPROP_YSIZE属性。
接下来,我们实现"UpdateDashboard"函数,用于处理文本与图片对象的滚动和数据更新。我们定义静态偏移量"symbolOffset"、"askOffset"、"spreadOffset"和"sectionOffset" ,用于跟踪各行的滚动位置。我们将"totalSymbols"与各自的水平间距参数相乘,计算出总宽度"totalWidthSymbol"、"totalWidthAsk"、"totalWidthSpread"和"totalWidthSection" 。我们通过"ChartGetInteger"函数,以"CHART_WIDTH_IN_PIXELS"为参数获取图表右边界坐标。我们遍历所有交易品种,根据"symbolOffset"调整"symbolXPos"来更新每个品种的位置,如果超出屏幕下边界,则通过取模运算实现循环滚动效果,并调用"createText"函数更新文本;如果超出右边界"rightEdge",则通过"ObjectSetInteger"函数设置"OBJPROP_HIDDEN"属性将对象隐藏。
我们对卖价、点差(如果开启"ShowSpread")以及分区模块执行类似的更新操作,包括:通过"ObjectSetInteger"设置图片的 OBJPROP_XDISTANCE和"OBJPROP_YDISTANCE",更新货币名称、涨跌幅(通过 StringFormat格式化)、方向箭头(使用"prices[i].arrow_char")以及买价文本。我们利用"fmod"(取模函数)结合滚动速度来递增偏移量,并调用ChartRedraw刷新图表显示。这些函数能确保行情滚动器自适应各类变化,并实现流畅滚动,满足实时监控的需求。接下来,我们可以在OnTimer事件处理器中调用这些功能,但首先需要设置定时器的时间间隔。这一步是不可或缺的。
//--- Set timer
EventSetMillisecondTimer(UpdateInterval);     //--- Set timer for updates

//--- Initialize last day
lastDay = TimeCurrent() / 86400;              //--- Set current day for daily open tracking
这里,我们只需调用EventSetMillisecondTimer函数来设置定时器的时间间隔,并传入已定义的更新间隔参数,最后,初始化用于追踪新交易日的lastDay变量。现在,我们可以定义定时器的执行逻辑了。
//+------------------------------------------------------------------+
//| Expert timer function                                            |
//+------------------------------------------------------------------+
void OnTimer()
{
   //--- Check for new day to update daily open
   datetime currentDay = TimeCurrent() / 86400;  //--- Calculate current day
   if(currentDay > lastDay)                      //--- Check if new day
   {
      for(int i = 0; i < totalSymbols; i++)      //--- Iterate through symbols
      {
         prices[i].daily_open = iOpen(symbolArray[i], PERIOD_D1, 0); //--- Update daily open price
      }
      lastDay = currentDay;                      //--- Update last day
   }

   //--- Update background size in case chart is resized
   UpdateBackground();                           //--- Update background dimensions

   //--- Update dashboard display
   UpdateDashboard();                            //--- Update dashboard visuals
}
这里,我们实现 OnTimer事件处理器,用于管理实时交易品种监控滚动行情条的周期性更新;该函数会按照"UpdateInterval"设置的时间间隔自动触发。首先,我们通过将TimeCurrent除以86400来计算"currentDay",将其转换为天数(1 天 = 24 小时 × 60 分钟 × 60 秒)。如果"currentDay"大于"lastDay",说明进入新的交易日,我们遍历所有的交易品种,通过iOpen函数获取"PERIOD_D1"位移0的最新开盘价,更新每个品种的"prices[i].daily_open",之后,将"lastDay"赋值为"currentDay",完成新日期的追踪。这一步可以确保在进入新交易日后,日内涨跌幅基于新的开盘价重新计算。
接下来,我们调用"UpdateBackground",在图表尺寸改变时自动调整背景面板。最后,我们调用"UpdateDashboard",根据最新数据与滚动位置刷新所有文本和图片对象,让行情条保持动态响应并随时间实时更新。运行效果如下:

从可视化效果中可以看出,我们已经实现了一个能够正常滚动的行情条。现在我们只需要更新价格数据,整个功能就全部完成了。我们也把这段更新逻辑封装到一个函数里来实现。
//+------------------------------------------------------------------+
//| Update prices function                                           |
//+------------------------------------------------------------------+
void UpdatePrices()
{
   for(int i = 0; i < totalSymbols; i++)         //--- Iterate through all symbols
   {
      double bid = SymbolInfoDouble(symbolArray[i], SYMBOL_BID); //--- Retrieve current bid price
      double ask = SymbolInfoDouble(symbolArray[i], SYMBOL_ASK); //--- Retrieve current ask price

      //--- Validate prices
      if(bid == 0 || ask == 0)                   //--- Check for invalid prices
      {
         LogError("UpdatePrices: Failed to retrieve prices for " + symbolArray[i]); //--- Log price retrieval failure
         continue;                               //--- Skip to next symbol
      }

      //--- Update color and arrow based on price change (tick-to-tick for bid and arrow)
      if(bid > prices[i].prev_bid && prices[i].prev_bid != 0) //--- Check if bid increased
      {
         prices[i].bid_color = UpColor;            //--- Set bid color to up color
         prices[i].arrow_char = CharToString(236); //--- Set up arrow character
         prices[i].arrow_color = ArrowUpColor;     //--- Set arrow to up color
      }
      else if(bid < prices[i].prev_bid && prices[i].prev_bid != 0) //--- Check if bid decreased
      {
         prices[i].bid_color = DownColor;          //--- Set bid color to down color
         prices[i].arrow_char = CharToString(238); //--- Set down arrow character
         prices[i].arrow_color = ArrowDownColor;   //--- Set arrow to down color
      }
      else                                         //--- Handle no change or first tick
      {
         prices[i].bid_color = FontColor;          //--- Set bid color to default
         prices[i].arrow_char = CharToString(236); //--- Set default up arrow
         prices[i].arrow_color = FontColor;        //--- Set arrow to default color
      }

      //--- Calculate daily percentage change
      prices[i].percent_change = prices[i].daily_open != 0 ? ((bid - prices[i].daily_open) / prices[i].daily_open) * 100 : 0; //--- Compute percentage change
      prices[i].percent_color = prices[i].percent_change >= 0 ? UpColor : DownColor; //--- Set percent color based on change

      //--- Update data
      prices[i].bid = bid;                       //--- Store current bid
      prices[i].ask = ask;                       //--- Store current ask
      prices[i].spread = (ask - bid) * MathPow(10, SymbolInfoInteger(symbolArray[i], SYMBOL_DIGITS)); //--- Calculate spread
      prices[i].prev_bid = bid;                  //--- Update previous bid
   }
}
我们实现"UpdatePrices"函数,用于刷新交易品种数据。我们遍历所有交易品种"totalSymbols",并通过"SymbolInfoDouble"函数,以SYMBOL_BID和 "SYMBOL_ASK"为参数,获取每个交易品种"symbolArray[i]"的买价和卖价。如果"bid"或"ask"为 0,我们通过"LogError"记录错误,并跳过当前品种,处理下一个。我们根据当前"bid"与上一笔"prev_bid"的大小关系(忽略初始值0),更新"bid_color"、"arrow_char"(通过CharToString函数生成向上或向下箭头)和"arrow_color"。这些箭头使用的是MQL5默认的Wingdings符号字体,具体定义如下:

您也可以使用您喜欢的箭头字符代码。接下来,我们使用当日开盘价"daily_open"计算涨跌幅"percent_change",并通过三元运算符根据涨跌设置百分比颜色"percent_color"。最后,我们更新以下数据:"prices[i].bid"、"prices[i].ask"、"spread"(使用MathPow和SymbolInfoInteger函数获取报价小数位数"SYMBOL_DIGITS"后计算得出)和"prev_bid",确保用于显示和判断变化的数据都是最新的,让行情显示的价格和指标在每一次报价变动时都保持实时更新。现在,可以在每一次报价变动时调用该函数来处理价格变化,也可以选择在OnTimer定时器函数中调用。由您决定。
//+------------------------------------------------------------------+
//| Expert tick function                                             |
//+------------------------------------------------------------------+
void OnTick()
{
   //--- Update prices on every tick for live changes
   UpdatePrices();                               //--- Update symbol prices
}

//+------------------------------------------------------------------+
//| Expert deinitialization function                                 |
//+------------------------------------------------------------------+
void OnDeinit(const int reason)
{
   //--- Clean up objects
   for(int i = objManager.Total() - 1; i >= 0; i--) //--- Iterate through all managed objects
   {
      string name = objManager.At(i);               //--- Get object name
      if(ObjectFind(0, name) >= 0)                  //--- Check if object exists
      {
         if(!ObjectDelete(0, name))                 //--- Delete object
            LogError("OnDeinit: Failed to delete object: " + name + ", Error: " + IntegerToString(GetLastError())); //--- Log deletion failure
      }
      objManager.Delete(i);                        //--- Remove object from manager
   }
   EventKillTimer();                               //--- Stop timer
}
在OnTick事件处理器中,我们调用"UpdatePrices"来刷新所有交易品种的买价、卖价、点差和变动数据,确保行情显示能及时反映市场的实时波动。接下来,我们实现OnDeinit函数,用于在卸载程序时执行清理工作。我们通过"Total"对"objManager"进行倒序遍历,并使用"At"获取每个对象的名称。根据ObjectFind判断对象是否存在,如果存在则使用ObjectDelete函数将其删除;如果删除失败,则通过"LogError"记录错误信息。我们使用Delete操作符将对象名称从"objManager"中移除。最后,通过 EventKillTimer停止定时器,终止周期性更新。这一步是不可或缺的。这样可以确保所有对象都被正确清理,避免在图表上残留无用的元素。运行程序后,效果如下:

由运行效果可见,所有功能均按预期正常运行,我们也实现了最初的目标。当前仅需完成项目可操作性的测试工作,该部分内容已在前文章节中详细阐述。
回测
我们已完成测试,以下是整合后的可视化结果,以单一的GIF动图形式呈现。

结论
总体而言,我们已基于MQL5开发了一款滚动行情条,用于实时监控交易品种。它具备买价、点差、日内涨跌幅的滚动显示功能,并支持自定义字体、颜色和滚动速度,可高效地突显市场的波动。我们讲解了程序的架构与实现方式,从"SymbolData"等数据结构,到"UpdateDashboard" 、 "UpdatePrices"等功能函数,确保了界面流畅滚动与数据精准更新,为交易分析提供有效的支持。您可以根据自身需求自定义这款行情工具,大幅提升同时监控多个品种、实时响应价格趋势的能力。
本文由MetaQuotes Ltd译自英文
原文地址: https://www.mql5.com/en/articles/18844
注意: MetaQuotes Ltd.将保留所有关于这些材料的权利。全部或部分复制或者转载这些材料将被禁止。
本文由网站的一位用户撰写,反映了他们的个人观点。MetaQuotes Ltd 不对所提供信息的准确性负责,也不对因使用所述解决方案、策略或建议而产生的任何后果负责。

不工作
你读过这篇文章吗?