MW Pattern Pro MT5
- Indicators
- Version: 1.0
- Activations: 10

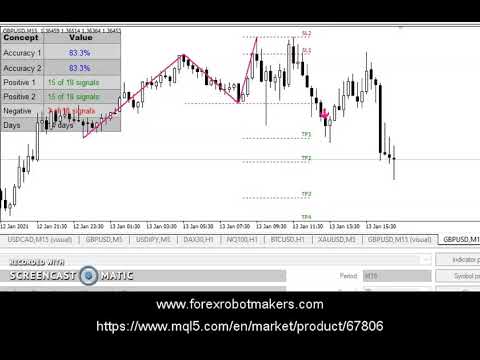
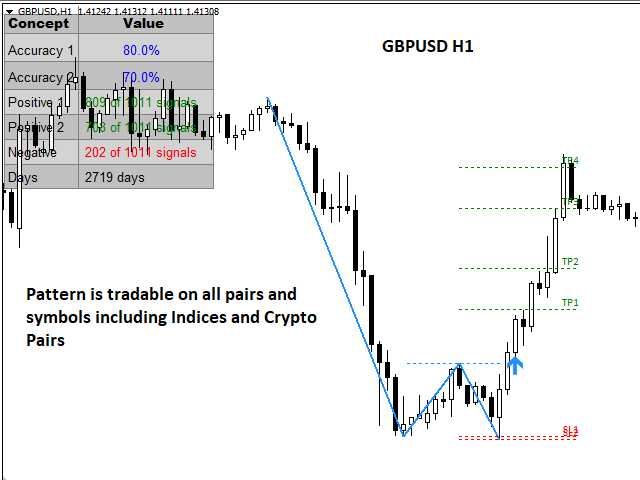
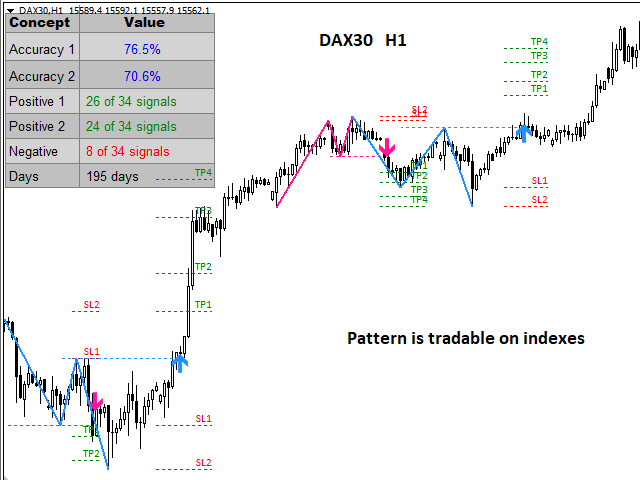
M & W Pattern Pro is an advanced scanner for M and W patters , it uses extra filters to ensure scanned patterns are profitable.
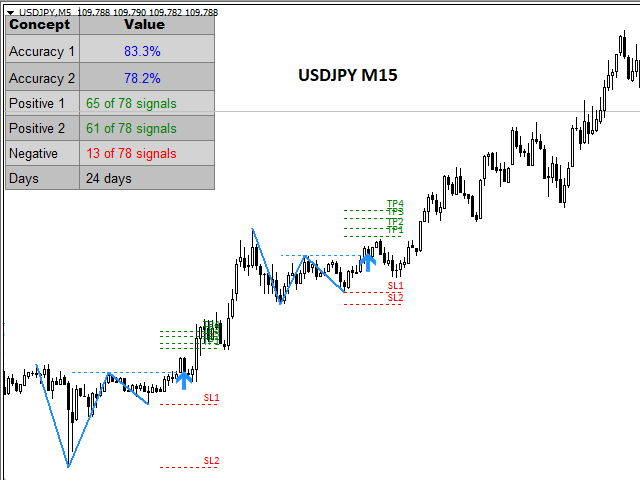
The indicator can be used with all symbols and time frames.
The indicator is a non repaint indicator with accurate statistics calculations.
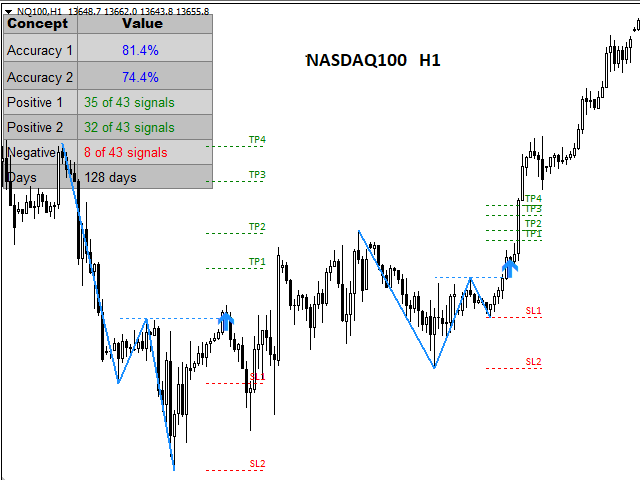
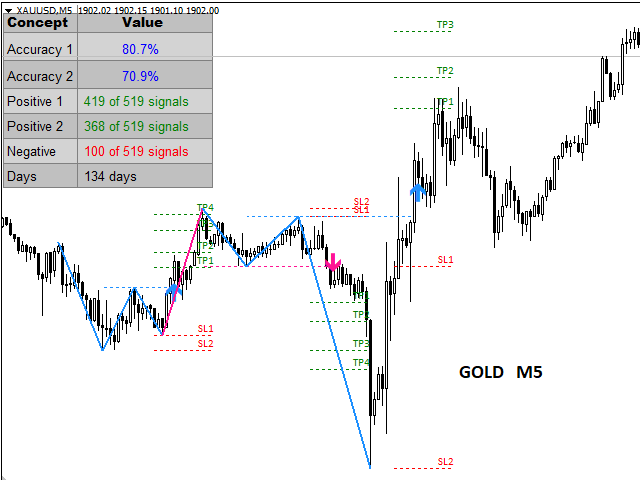
To use , simply scan the most profitable pair using the statistics dashboard accuracy , then enter trades on signal arrow and exit at the TP and SL levels.
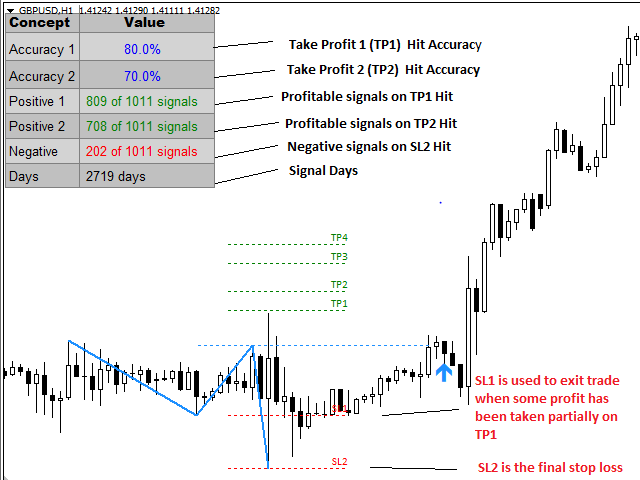
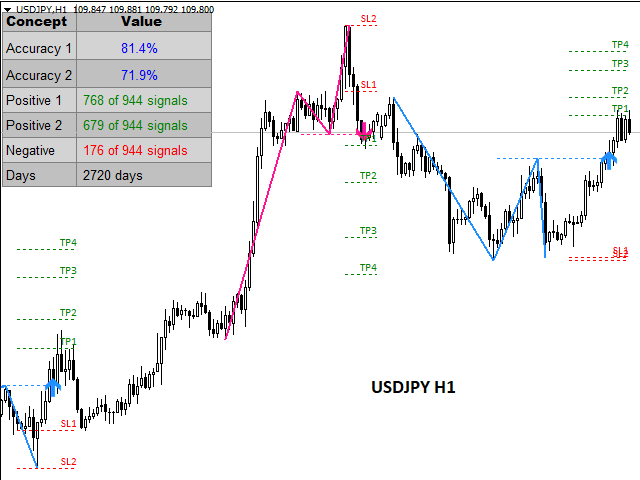
STATISTICS :
Accuracy 1 : This is the percentage of the times price hits TP1 before it hits stop loss.
Accuracy 1= (Total TP1 Hit /Total signals )*100
Accuracy 2 : This is the percentage of the times price hits TP2 before it hits stop loss.
Accuracy 2= (Total TP2 Hit /Total signals )*100
Positive 1 : This is the percentage of the times price hits TP1.
Positive 2 : This is the percentage of the times price hits TP2.
Negative : This is the percentage of the times price hits stop loss (SL 2) .
Days : The number of days scanned in the historical data.
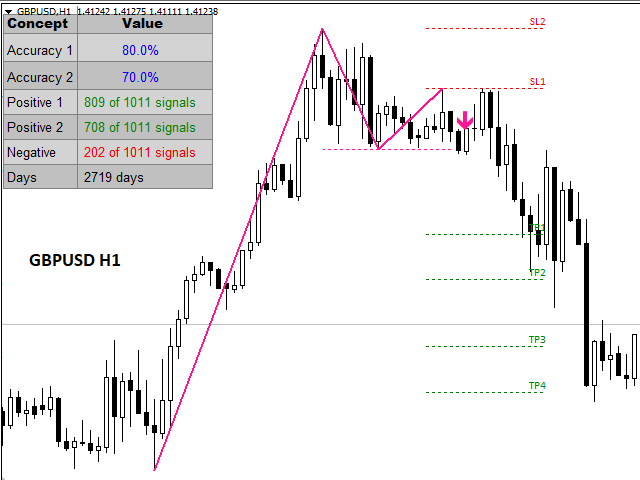
SL 1 vs. SL 2
SL 1 : Sl1 1 is the first stop loss and it is meant for exiting trades after a partial profit has been taken. When you close a trade partially at TP1 or TP2 , then place stop loss at SL 1 to reduce risk.
SL2 : SL2 is the final stop loss for all trades and should serve as the risk factor in every trade.
INPUT MENU SETTINGS
- Pattern History : This is the range of historical bars scanned. This number affects how fast the indicator loads , the larger the number , the slower the indicator loads.
- Pattern Amplitude : This is basically the most important setting for this indicator. It affects both the accuracy and number of daily signals . For a more filtered signal with less noise, this number should be increased . But if you want to see more signals, then the number should be reduced but the more the signals , the more the noise.
YOU CAN NOW DOWNLOAD FREE VERSIONS OF OUR PAID INDICATORS . IT'S OUR WAY OF GIVING BACK TO THE COMMUNITY !