Rigorous Market Sessions SubWindow

1. What is this.

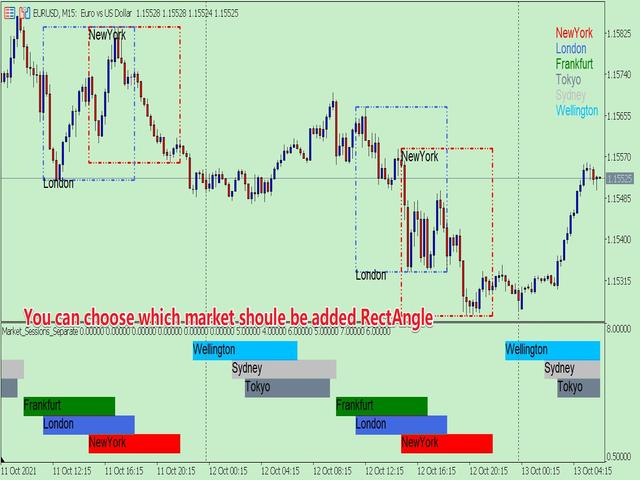
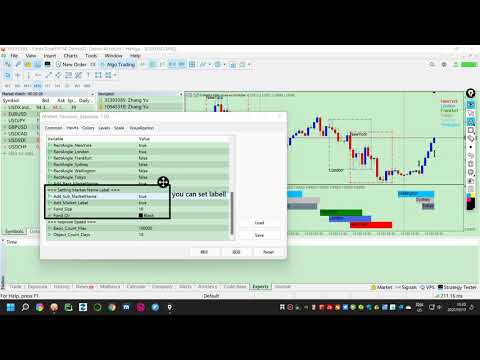
         This is a very rigorous indicator to show different market trading sessions. It shows the main markets: NewYork, London, Frankfurt, Sydney, Wellington, Tokyo.

         Very important:

Different markets have different start and end dates for daylight saving time, and the trading session of a market can vary depending on daylight saving time and winter time.

Also, the daylight saving time system is different for countries in the northern hemisphere and southern hemisphere, as well as the system of daylight saving time changes in a market in different years

For example: New York daylight saving time system:

  • 1987-2006:     02:00 on the first Sunday in April       -->    02:00 on the last Sunday in October
  • 2007-present: 02:00 on the second Sunday in March -->    02:00 on the first Sunday in November

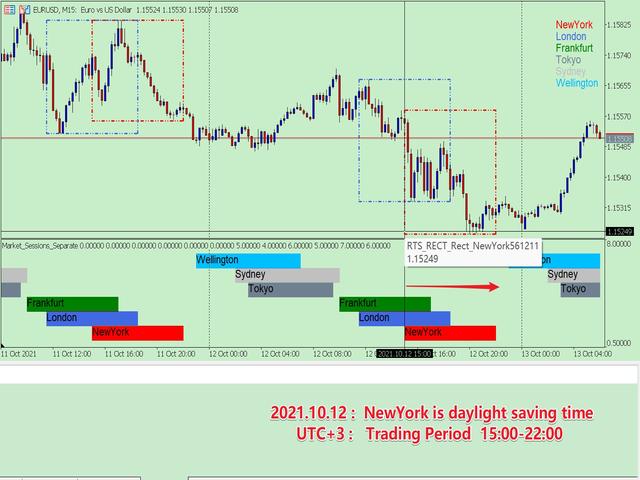
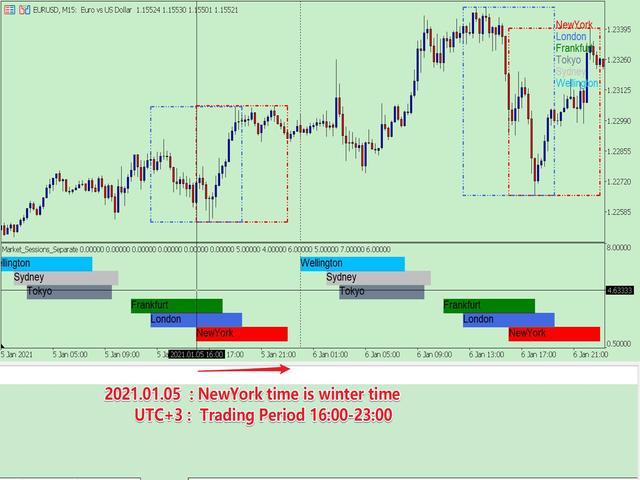
New York forex market trading session (UTC+3): 15:00-22:00 (daylight saving time); 16:00-23:00 (winter time).

            Therefore, the trading session must consider the city, the daylight saving time of the year, and the corresponding trading period, otherwise the trading period is wrong. But if these are all set manually, which is very cumbersome, this program can be set automatically.

    You can refer to my blog to learn about the daylight saving time system and trading hours of major countries:

    DAYLIGHT SAVING TIME RECORDS OF MAJOR COUNTRIES

    OPENING AND CLOSING TIME OF MAJOR INTERNATIONAL FOREIGN EXCHANGE MARKETS


    2. Program Features

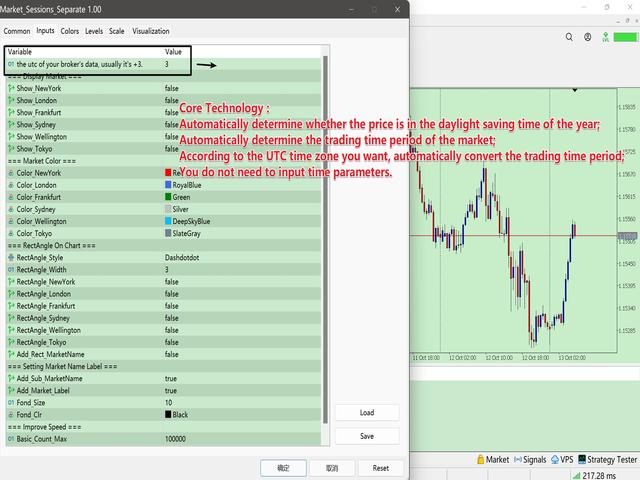
    • Automatically determine whether the price is in the daylight saving time of the year;
    • According to whether the market is in daylight saving time, automatically determine the trading time period of the market;
    • According to the UTC time zone you want, automatically convert the trading time period;
    • The historical data is all rigorously matched, so you can get accurate historical market trading sessions, which is convenient for your research.
    • With multiple display modes, you can always find a solution that suits you.

    3. How to use (sub window mode)

    The parameters are expressed in groups, which are very easy to understand. The following describes each parameter group:

    • is broker auto adjust utc
    • if the above is true, summer utc; if false summer or winter utc.
    • group "=== Show Market On Chart ===" :   The parameter in the group is to choose whether to display the corresponding market, which is the general control key for a single market.
      • Show_NewYork = true;
      • Show_London = true;
      • Show_Frankfurt = true;
      • Show_Sydney = true;
      • Show_Wellington = true;
      • Show_Tokyo = true;
    • group "=== Market Color ===" :  The parameters in the group are to set the color of each market
      • Color_NewYork = clrRed;
      • Color_London = clrRoyalBlue;
      • Color_Frankfurt = clrGreen;
      • Color_Sydney = clrSilver;
      • Color_Wellington = clrDeepSkyBlue;
      • Color_Tokyo = clrSlateGray;
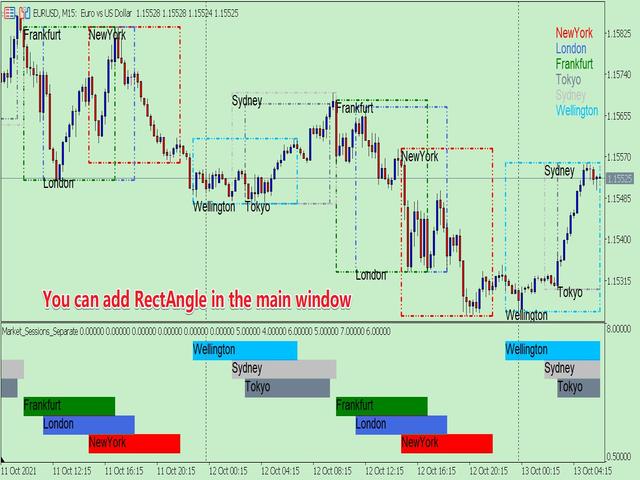
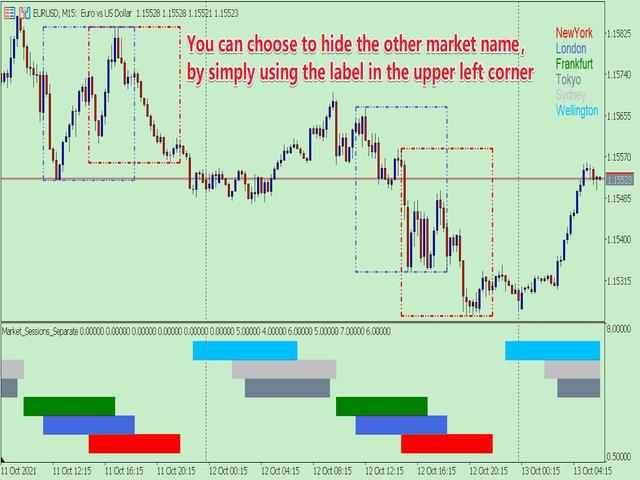
    • group "=== RectAngle On Chart ===" :   Whether to add RectAngle in the main window for the parameter setting in the group
      • RectAngle_Style = STYLE_DASHDOTDOT;        //  Type of RectAngle 
      • RectAngle_Width = 3;        
        • //  The width of the RectAngle , according to the limitations of MT5, only STYLE_SOLID, STYLE_DASHDOTDOT types can be greater than 1.
      • RectAngle_NewYork = true;
      • RectAngle_London = true;
      • RectAngle_Frankfurt = true;
      • RectAngle_Sydney = true;
      • RectAngle_Wellington = true;
      • RectAngle_Tokyo = true;
      • Add_Rect_MarketName = true;        //  Whether to add the market name in the box
    • group "=== Setting Market Name Label ===" :  The parameter setting in the group displays the market name
      • Add_Sub_MarketName = true;     //  Whether to add the market name in the sub-window
      • Add_Market_Label = true;        //  Whether to display the market name in the upper right corner of the main window
      • Fond_Size = 10;        //  Text size
      • Fond_Clr = clrBlack;        //  Text color
    • group "=== Improve Speed ===" :  The parameters in the group are used to set the number of calculations. When studying historical data, you can set a larger one; for real-time trading, you can set a smaller one.
      • Basic_Count_Max = 100000;     //   The basic number of data, this can be set very large.
      • Object_Count_Days = 5;        //  The number of boxes and name tags in units of days.

    4. Others

            Due to the limitations of MT5, I had to write the program in two forms.

    One is the sub-window mode;  the other is the chart window mode. The two modes are different, there is always one that suits you. The current page is the sub-window mode.


    Recommended products
    1. What is this.          This is a very rigorous indicator to show different market trading sessions. It shows the main markets: NewYork, London, Frankfurt, Sydney, Wellington, Tokyo.           Very important: Different markets have different start and end dates for daylight saving time, and the trading session of a market can vary depending on daylight saving time and winter time. Also, the daylight saving time system is different for countries in the northern hemisphere and southern hemisphe
    Clock Et Mt5
    Andrew Tsujiguchi
    Simple Eastern Time (ET) clock displayed on your chart, auto-synced with US market hours. Updates every second. Full description: ClockET — Lightweight indicator that displays the current date and time in US Eastern Time (ET) directly on your chart, so you always know exactly where the US session stands — no manual timezone math needed. What You See • Live Clock — Day, month, date and time in ET, updated every second (e.g. "Thu Jul 24  07:36:45 ET") • Centered Label — Displayed at the bottom
    FREE
    Exact Time — detailed time on the seconds chart. The utility shows the opening time of the selected candle. This is necessary when working with seconds charts. For example, it can be used on a seconds chart built using the Seconds Chart utility. Inputs Base corner — the chart corner to which an object Is attached. X distance — the horizontal distance from the chart corner. Y distance — the vertical distance from the chart corner. Text font — font name Font size — font size Color — text color
    FREE
    News History Expoter
    Donaldo Sande Angiela
    This program is designed to download economic calendar news events for a specified country over a selected date range, allowing traders to analyze and incorporate important economic data into their trading strategies. By specifying both a start and end date, as well as a country code, the program retrieves relevant news events within the defined period and exports them to a CSV file for easy review and analysis. This tool helps traders stay informed about scheduled economic events that may impac
    FREE
    Live Price With PNL
    Muhammad Jawad Shabir
    LIVE PRICE AND TOTAL PROFIT DISPLAY INDICATOR PERFECT FOR LIVE TRADING & SCREEN SHARING Designed specifically for day traders, scalpers, and live stream trading sessions This professional indicator provides real-time price display and comprehensive profit tracking directly on your chart - essential for high-frequency trading and live trading broadcasts. KEY FEATURES REAL-TIME PRICE DISPLAY Live bid price updates every second Professional formatting for all symbol types Special Gold/XAU formatti
    FREE
    HTF Candles Nika overlays full-size candles from any higher timeframe directly onto your current chart in MetaTrader 5. It gives you a clear multi-timeframe view without leaving your chart. Key Features - Draws higher timeframe candles as filled rectangles with wicks on the current chart - Supports standard candlestick and Heiken Ashi display modes - Live countdown timer showing time remaining until the current HTF candle closes - Customizable colors for bullish and bearish candles - Auto or m
    FREE
    Tick Chart Monitor
    Trade The Volume Waves Single Member P.C.
    DO NOT DOWNLOAD  UNLESS YOU OWN "Tick Chart - Constant Volume Generator EA" - This indicator acts as remote control of the specifc EA. The link for "Tick Chart - Constant Volume Generator EA" : https://www.mql5.com/en/market/product/171018 1. Tick Chart Monitor   1.1 What It Does The Monitor is an indicator that runs directly on the generated tick chart. It provides a graphical control panel that lets you change the EA’s style, volume, start date, or trigger a full rebuild — without touching the
    FREE
    Modern Dark Chart Theme for MT5 Upgrade your MetaTrader 5 chart into a clean, dark, professional trading workspace. Your chart is your trading office. It is where you analyze the market, test Expert Advisors, review setups, record videos, share screenshots, and make trading decisions. If your MT5 chart looks old, bright, noisy, or unprofessional, your trading environment can feel distracted before you even start your analysis. Modern Dark Chart Theme for MT5 helps you create a cleaner, darker,
    FREE
    Crystal Dashboard
    Muhammad Jawad Shabir
    Crystal Profit Dashboard – Real-Time MT5 Account Performance Utility Overview Crystal Profit Dashboard is a lightweight MetaTrader 5 utility that provides real-time profit and loss monitoring directly on the chart. It offers a clean, modern dashboard interface that updates account performance without clutter, allowing traders to focus on execution while keeping essential metrics visible. Designed for scalpers, intraday traders, and swing traders, this tool provides accurate floating profit/los
    FREE
    * This product was converted using  "BRiCK Convert4To5 MT4 "  based on the MQL4 source file of  "BRiCK Convert4To5 MT4 Free" . "Convert4To5" is a Script that converts MQL4 source files into MQL5 source files. Experts, Indicators, Scripts, and Libraries with extension ".mq4" will be available for MT5. Parameter None. Procedure 1. Open the following folder.     terminal_data_folder\MQL4\Files\ (in the terminal menu select to view "File" - "Open the data directory") 2. Confirm that the BRiCK_Conv
    FREE
    Market book tester
    Aliaksandr Hryshyn
    3 (2)
    Using data from the order book in the strategy tester Key features: Simultaneous use of several symbols, up to 7 pieces DOM visualization With the visualization of order books, real-time simulation is available, as well as acceleration or deceleration Working with the library: This product also requires a utility to save data:  https://www.mql5.com/en/market/product/71642 Speed control utility:  https://www.mql5.com/en/market/product/81409 Include file:   https://c.mql5.com/31/735/Market_book_s
    FREE
    CloseAllOrders at once
    Lamont Simone Reynecke
    Simple program i created, to help close all your orders instantly when you are busy scalping the market or if you want to avoid news days but still have a lot of orders and pending orders open and can't close them in time.. with this script all you're problems will be solved. Simple drag and drop and the script automatically does it's thing, quick and easy  also a very good tool to use when scalping
    FREE
    ABQ Visual Risk Sizer
    Cristian David Castillo Arrieta
    ABQ Visual Risk Sizer - Institutional Risk & Trade Execution Category: Utilities / Risk Management Manual lot calculation costs time and money. In modern trading, especially when operating with funded accounts (Prop Firms), a lot sizing error or a 5-second delay in entering an order can mean violating the Daily Drawdown rule or missing the perfect entry price. ABQ Visual Risk Sizer is an institutional-grade tool designed to solve this problem permanently. It transforms complex mathematical risk
    Global Market Sessions – Visual Analyzer for MT5 A lightweight MT5 indicator that visually maps Tokyo, London and New York sessions, auto-detects broker timezone & DST, and highlights the best liquidity windows for smarter trading. See the market’s rhythm at a glance. Trade with clarity, precision, and confidence. Overview Global Market Sessions is a powerful yet easy-to-use MT5 indicator that visually displays the world’s major trading sessions (Tokyo, London, New York) directly on your chart
    FREE
    Lightweight, real-time trading session visualizer with tick-level price tracking and zero chart lag. Session Overlays Mastery Core gives you a clean, institutional view of Asia, London, and New York trading sessions without cluttering your chart or slowing down your terminal. Unlike traditional session indicators that constantly delete, redraw, and flicker on every bar close, Session Overlays Mastery Core processes historical sessions once and tracks active sessions live on every tick. Price wil
    FREE
    Axilgo PipPiper CoPilot
    Theory Y Technologies Pty Ltd
    5 (2)
    Axilgo Pip Piper CoPilot Elevate your trading game with the Axilgo Pip Piper CoPilot, the first in our revolutionary Pip Piper Series. This all-inclusive toolset is meticulously crafted for serious traders, focusing on key areas such as Risk Management, Trade Management, Prop Firm Rule Compliance, and Advanced Account Management . With CoPilot, you’re not just investing in a tool—you’re gaining a strategic partner in the intricate world of trading. Important Notice: To ensure you receive the fu
    FREE
    EA Follower Version any Follow Copy Account  (Acc. Number)  need a open MT Terminal, download multiple times Step1:   Open Master MT5 Terminal    =  install master- Version   (on any Symbol just one Time) Step2:   Open Follower MT5 Terminal = install follower- Version  (on any Symbol just one Time) Step3:   all Trades from any Symbol or any Robot are copy now to follow- Terminal immediately for simple copy set on Chart and   Start   no optimization. This Robot is a Trade Copier for MT5 that auto
    FREE
    Statistic Candles. Утилита для получения статистики с графика "Японские свечи". Статистика собирается нижеописанными методами.  Выполняет следующие функции: Подсчёт свечей на 19-ти таймфреймах (внутридневные свечи):   Количества бычьих и медвежьих свечей в указанном промежутке дат. Количества бычьих и медвежьих свечей в указанном промежутке дат в обозначенное время. Подсчёт количества нестандартных свечей (прим.: Custom _ time = 14:56, Period _ time = 1 H ). Данные средних значений open - close
    GOM Trade Manager
    Wannapach Chinnaprapa
    GOM Trade Manager helps you execute trades the way you want it. Works on all instruments Forex, Commodities, & Crypto. It helps you with lot calculations, spread addition and balance calculations so you can just focus on actual trading. For full automatic planned management, stackable triggers and spread widening protection >> check out GOM Trade Manager Pro . ------------------------------------------NOTABLE FEATURES------------------------------------------ You set everything based on bid
    FREE
    MQL5 Blogs : https://www.mql5.com/en/blogs/post/761446 MT4 Version : https://www.mql5.com/en/market/product/136790 MT5 Version : https://www.mql5.com/en/market/product/136791 Time Wizard is a professional trading assistant built for traders who need speed, timing, and execution control in one clean dashboard. This Expert Advisor is designed for event-based trading, scheduled execution, and fast semi-automatic order management. It allows you to prepare your orders in advance, define the exact
    MA Color Candles Indicator MA Color Candles is an indicator for visually displaying market trends by coloring chart candles. It does not add objects or distort price data, instead coloring real candles based on the state of two moving averages. This enables quick trend assessment and use as a filter in trading strategies. How It Works Bullish trend: Fast MA above slow MA, slow MA rising (green candles). Bearish trend: Fast MA below slow MA, slow MA falling (red candles). Neutral state: Candles
    FREE
    This tool allows you to export Ticks for any financial instrument available in MetaTrader 5. You can download multiple symbols into the same CSV file. You can also schedule the download frequency (every 5 minutes, 60 minutes, etc.). There is no need to open multiple charts to get the latest data—the tool downloads the data directly. The CSV file will be stored in the following folder: \MQL5\Files . How it works Select the symbols to download: Click an item to select or deselect it. Enter the CSV
    FREE
    Chart Drawing Toolkit
    Allan Munene Mutiiria
    4.67 (3)
    Chart Drawing Toolkit is a complete drawing and chart-analysis workspace for MetaTrader 5 . It places more than 50 drawing and markup tools in one fast, clean panel that docks to the edge of your chart, so every manual analysis tool you need is a single click away. It runs as an indicator, so it works alongside your Expert Advisors and other indicators on the same chart. Overview The toolkit combines a docking sidebar, a quick tool flyout, a pinned tools bar, a live properties bar for the select
    FREE
    Trade2Telegram
    Strifor (Mauritius) Ltd
    5 (10)
    Trade2Telegram — a plugin for automatic trade notifications from MetaTrader to Telegram. This tool is designed for traders managing capital, running signal channels, or leading educational communities. The plugin copies all trading operations from the terminal and publishes them to a selected Telegram chat, group, or channel. Messages are sent automatically when positions are opened or closed, stop-loss or take-profit levels are changed, pending orders are triggered, or trades are partially clos
    FREE
    Hybrid Assisted Trading Engine Manual Trading. Machine Discipline. The Hybrid Assisted Trading Engine is an institutional-grade manual trade management system designed to protect traders from emotional mistakes — without taking control away from them. You decide when to enter . The engine decides how the trade is managed . What It Does This system continuously monitors your manual trades and enforces professional-level trade management rules in real time: Smart Breakeven logic R-based trai
    Imagine flying a real aircraft without ever stepping into a flight simulator. That's what trading is like. You have to simulate your strategy before you can take it to a live market. It is good if you can simulate things speedily before even stepping into any live market, or before coming up with an automated system.  People don't have all day to stare at a higher timeframe chart until the entry signal finally arrives. That's why I built this so that you can simulate your strategy with speed. Th
    FREE
    Stop guessing and start executing with precision. Learning complex trading methodologies takes years of screen time—until now. The Propfolio Strategy Mentor OS is an elite, on-chart analytical dashboard that acts as your live digital trading mentor. It doesn't just draw lines on your chart; it actively scans the market, identifies high-probability setups across 8 different institutional strategies, and tells you exactly what to look for in real-time via the Live Mentorship Terminal. Whether you
    LT Trade Panel Pro 2 - Ultimate Risk Manager & Fast Execution Tool LT Trade Panel Pro   is the definitive tool for traders seeking precision, speed, and impeccable risk management in MetaTrader 5. Designed for   Scalpers   and   Day Traders , this panel transforms execution complexity into a seamless one-click experience. In the new   Version 2  the system has been fully refactored to deliver maximum performance, eliminating latency and adding exclusive capital protection features. Why use LT
    The Ultimate Risk Calculator
    Elias Jose Vielma Molina
    Risk Calculator EA – Utility for Precise Trade Sizing If you find this tool useful consider to  Buy me a coffee!   The Ultimate Risk Calculator is a lightweight in-chart Expert Advisor (EA) designed to help you easily and quickly calculate position size and set stop-loss / take-profit levels with full control over risk management directly on the chart. What it does? It turns manual risk decisions into fast, visual, and accurate calculations. You draw or adjust the Entry, Stop-Loss and Take-P
    FREE
    SIMPLE AND QUICK CHART CLEANUP SCRIPT - FREE FOR ALL - EASY TO DRAG AND DROP ONTO THE CHART - A MUST HAVE IN MY EYES Everybody loves to draw on a chart! But cleaning is nobodies favor. Most of the time it will be faster to dump all and redraw the important part. Repetition makes you good! ALWAYS think about that! KEEP IT GROWING, ;-) I wish you a good day, Traders! If you need something, send me a message. Best wishes to you from Vienna!
    FREE
    Buyers of this product also purchase
    Trade Assistant MT5
    Evgeniy Kravchenko
    4.41 (216)
    It helps to calculate the risk per trade, the easy installation of a new order, order management with partial closing functions, trailing stop of 7 types and other useful functions. Additional materials and instructions Installation instructions - Application instructions - Trial version of the application for a demo account Line function -   shows on the chart the Opening line, Stop Loss, Take Profit. With this function it is easy to set a new order and see its additional characteristics bef
    Forex Trade Manager MT5
    InvestSoft
    4.98 (673)
    Trade Manager MT5 is an advanced position size calculator and trade management tool for MetaTrader 5, designed to help traders plan trades faster, control risk more precisely, and manage open positions directly from the chart. It combines order placement, risk based lot calculation, Stop Loss and Take Profit management, Break Even, Trailing Stop, Partial Close, Equity Protection, and external trade management in one panel. Whether you trade forex, indices, metals, commodities, crypto, or future
    Local Trade Copier EA MT5
    Juvenille Emperor Limited
    4.97 (147)
    Experience exceptionally fast trade copying with the   Local Trade Copier EA MT5 . With its easy 1-minute setup, this trade copier allows you to copy trades between multiple MetaTrader terminals on the same Windows computer or Windows VPS with lightning-fast copying speeds of under 0.5 seconds. Whether you're a beginner or a professional trader, the   Local Trade Copier EA MT5   offers a wide range of options to customize it to your specific needs. It's the ultimate solution for anyone looking t
    Astro Trade MT5
    Indra Maulana
    5 (2)
    25% discount on the release of the tool: only for the next 3 buyers Download the trial version: https://www.mql5.com/en/market/product/192656 AstroTrade Trading Assistant AstroTrade is a comprehensive multi-functional trading utility developed for the MetaTrader 5 platform. It integrates essential tools for trade execution, risk management, and technical monitoring into a single unified interface. The application is designed to assist traders in managing their daily operations through a visual
    ================================================================================ POC BREAKOUT - V20.72. Full Professional Grade Toolkit ================================================================================ POC Breakout is a full MetaTrader 5 trading dashboard for discretionary traders who want breakout signals, Point of Control (POC) context, volume profiles, order flow, market structure, news, alerts, and advanced trade planning in one professional workspace. Attached directly to you
    Beta Release The Telegram to MT5 Signal Trader is nearly at the official alpha release. Some features are still under development and you may encounter minor bugs. If you experience issues, please report them, your feedback helps improve the software for everyone. Telegram to MT5 Signal Trader is a powerful tool that automatically copies trading signals from Telegram channels or groups directly to your MetaTrader 5 account. It supports both public and private Telegram channels, and you can conn
    TradePanel MT5
    Alfiya Fazylova
    4.88 (167)
    Trade Panel is a multi-functional trading assistant. The app contains over 50 trading functions for manual trading and allows you to automate most trading tasks. Application instructions + video instructions: https://www.mql5.com/en/blogs/post/756482 Trial version of the application for a demo account: https://www.mql5.com/en/blogs/post/750865 How to install the application: https://www.mql5.com/en/blogs/post/756239 How to test the application in visual mode: https://www.mql5.com/en/blogs/post/7
    Telegram to MT5 Multi-Channel Copier automatically copies trading signals from your Telegram channels directly into MetaTrader 5. No bots, no browser extensions, no manual copying. You receive a signal on Telegram and the EA opens the trade on your terminal in a few seconds. The product includes two components: a Windows application that listens to your Telegram channels, and this Expert Advisor that executes the signals on your MT5 terminal. An MT4 version is also available. Setup guide and app
    Telegram To MT5 Ultra
    Mirel Daniel Gheonu
    5 (4)
    Telegram To MT5 — Signal Copier Turn the trading calls from your Telegram channels into real MT5 orders — automatically, on as many accounts as you like, with risk and rules fully under your control. Telegram To MT5 connects the VIP / signal channels you already follow on Telegram to your MetaTrader 5 terminal. A free companion desktop app reads the messages (even from channels that block bots), and this Expert Advisor executes them on your account — applying your own risk settings, symbol mappi
    HINN MagicEntry Extra
    ALGOFLOW OÜ
    4.71 (17)
    HINN MAGIC ENTRY – the ultimate tool for entry and position management! SIMPLE. FASTEST. INTUITIVE. MAX AUTOMATED. Place orders by selecting a level directly on the chart! full description   ::  demo-version  :: 60-sec-video-description Key features: - Market, limit, and pending orders - Automatic lot size calculation - Automatic spread and commission accounting - Unlimited partitial take-profits  - Breakeven and trailing stop-loss and take-profit  functions - Invalidation leves - Intuitive, a
    Signal Trading View to MT5 Pro
    Mirel Daniel Gheonu
    4.5 (2)
    Signal TradingView to MT5 Pro  Instant professional execution between TradingView and MetaTrader 5 Automate your trading strategy with the most robust communication bridge between TradingView alerts and real execution in MT5. Designed for traders who demand speed, flexibility, and impeccable risk management, this Expert Advisor transforms any alert message into a precise market or limit order.   Install and TEST the TRIAL version HERE STRENGTHS AND ADVANTAGES Universal Parsing Engine (Propriet
    Exp COPYLOT CLIENT for MT5
    Vladislav Andruschenko
    3.97 (35)
    Professional Trade Copier for MetaTrader 5 Fast, professional, and reliable trade copier for MetaTrader . COPYLOT allows you to copy Forex trades between MT4 and MT5 terminals with support for Hedge and Netting accounts. COPYLOT MT5 version supports: - MT5 Hedge to MT5 Hedge - MT5 Hedge to MT5 Netting - MT5 Netting to MT5 Hedge - MT5 Netting to MT5 Netting - MT4 to MT5 Hedge - MT4 to MT5 Netting MT4 version Full Description +DEMO +PDF How To Buy How To Install How to get Log Files H
    The product will copy all telegram signal to MT5 ( which you are member) , also it can work as remote copier.  Easy to set up, copy order instant, can work with almost signal formats, image signal,  s upport to translate other language to English Work with all type of channel or group, even channel have "Restrict Saving Content", work with  multi channel, multi MT5 Work as remote copier: with signal have ticket number, it will copy exactly via ticket number. Support to backtest signal. How to s
    Trade copier MT5
    Alfiya Fazylova
    4.58 (52)
    Trade Copier is a professional utility designed to copy and synchronize trades between trading accounts. Copying occurs from the account / terminal of the supplier to the account / terminal of the recipient, which are installed on the same computer or VPS . PROMOTION - If you have already purchased the "Trade Copier MT5," you can receive the "Trade Copier MT4" for free (for copying MT4 > MT5 and MT4 < MT5). For more detailed information about the conditions, please contact us via private message
    Anchor Trade Manager
    Kalinskie Gilliam
    5 (7)
    Anchor: The EA Manager Your EAs manage their own trades. Anchor manages the account around them. Anchor gives you one place to control your EAs, manage risk and decide when trading is allowed. Any EA, any vendor, any broker or symbol. No source-code changes required. The Problem Most EAs only know what they are doing. They cannot see when another EA is already trading, when several EAs open and are stacking risk or when the account has reached your loss limit. Even using just one EA, it may not
    Trade Copier Ultimate
    Janitha Sandaruwan Amaradasa Wickramasingha Arachchilage
    5 (4)
    Trade Copier Ultimate - Telegram to MT5 Signal Copier Trade Copier Ultimate automatically copies Telegram trading signals into MetaTrader 5. The EA can read signal messages, detect the symbol, order type, entry price, Stop Loss, Take Profit levels and selected update commands, then execute or manage the trade in MT5 using your lot and risk settings. It is more than a basic Telegram to MT5 copier. TCU also supports Bot API and user-account Bridge workflows, Discord signal routing, local MT5 to MT
    Global Investing FX Terminal
    Santiago Nicolas Pla Casuriaga
    The Global Investing FX Terminal is an all-in-one FX dashboard for MetaTrader 5 — CB policy rates, CFTC COT positioning, carry rankings, economic surprises, options skew, retail sentiment, and correlations, thirteen panels in total — rendered on a single zero-flicker canvas overlay and refreshing every 10 seconds from one attached EA. No external software required. Professional FX analysis requires simultaneous access to data that normally lives in separate platforms: rate derivatives, governmen
    Power Candles Strategy Scanner - Self-Optimizing Multi-Symbol Setup Finder Power Candles Strategy Scanner runs the same self-optimizing engine that powers the Power Candles indicator - on every symbol in your Market Watch, side by side. One panel tells you which symbols are statistically tradable right now, which strategy wins on each, the optimal Stop Loss / Take Profit pair, and pings you the moment a fresh signal fires. This tool is part of the Stein Investments ecosystem - 18+ tools plus Max
    Premium Trade Manager - The Trade Panel With a Coach Built In Premium Trade Manager puts a trading coach inside your chart, with a full execution engine underneath it. Set the trade up the way you always do, then let Max, your AI trading coach, read that exact setup against your live account and give you a straight verdict before you commit: is the stop disciplined, is the risk sane, is a high-impact release minutes away, are you near a prop-firm limit. Below sits the engine that runs everything
    Trading Chaos Expert
    Gennadiy Stanilevych
    5 (11)
    This software has no equals in the world and represents a universal trade "console" covering trading signals, automated market entry, setting of Stop Loss and Take Profit, as well as Trailing Profit for multiple trades at the same time in a single open window. Intuitive control of the Expert Advisor in "three clicks" ensures a comprehensive use of all its functions on different computers, including tablets PCs. Interacting with additional signal indicators that mark the chart to give a real mark
    Trade Assistant 38 in 1
    Makarii Gubaydullin
    4.91 (23)
    Multifunctional tool: Lot Calculator, Grid Orders, R/R ratio, Trade Manager, Supply and Demand zones, Price Action and much more Demo version   |   User manual Trade Assistant   doesn't work in the strategy tester : you can download the   Demo Version HERE  to test the utility . Contact me   for any questions  / ideas for improvement / in case of a bug found If you need a MT4 version, it is available here Simplify, speed up and automate your trading   process . Expand the standard terminal capa
    Timeless Charts
    Samuel Manoel De Souza
    5 (8)
    Timeless Charts is an all-in-one trading utility for professional traders. It combines custom chart types such as Seconds Charts and Renko with advanced order flow analysis using Footprints , Clusters , Volume Profiles , VWAP studies, and anchored analysis tools for deeper market insight. Trading and position management are handled directly from the chart through an integrated trade management panel , while Market Replay and Virtual Accounts provide environments for practicing trading skills and
    Footprint Chart Pro — Professional OrderFlow EA for MetaTrader 5 Version 6.34 | Professional tool for real traders | Institutional-Grade Visualization DEMO USERS - PLEASE SELECT EVERY TICK / REAL TICK WHEN TESTING AND YOU HAVE DOWNLOADED HISTORICAL DATA. IF YOU SEE A WAITING SCREEN AND IT IS NOT DOWNLOADING, IT MEANS YOU HAVE LOW HISTORICAL DATA. TRY 1 MIN AND 5 MIN FIRST ON 1 DAY DATA. ONE DAY DATA SHOULD BE THE NEWEST AND MOST CURRENT DATE. PLEASE WAIT UNTIL THE MARKET HAS ROLLED OVER PERIOD.
    Seconds Chart MT5
    Boris Sedov
    4.61 (18)
    Seconds Chart is a unique tool for creating second-based charts in MetaTrader 5 . With Seconds Chart , you can construct charts with timeframes set in seconds, providing unparalleled flexibility and precision in analysis that is unavailable with standard minute or hourly charts. For example, the S15 timeframe indicates a chart with candles lasting 15 seconds. You can use any indicators and Expert Advisors that support custom symbols. Working with them is just as convenient as on standard charts.
    FarmedHedge Pair Trading Dashboard
    Tanapisit Tepawarapruek
    5 (3)
    Farmed Hedge Yield Farming | All Markets (Manual - Hybrid - Semi/Automated EA) VERIFIED TRADING RESULTS - Farmed Hedge Yield Axi Copy:  https://www.mql5.com/en/signals/2356376 - Farmed Hedge Yield Exn Copy:   https://www.mql5.com/en/signals/2356404 - Farmed Hedge Yield V Copy:  https://www.mql5.com/en/signals/2357156 * Before purchasing, please feel free to send me a message if you have any questions about the product or setup. ** After purchase,  Contact me via private message to receive t
    MT5 to Telegram Signal Provider turns your trading account into a signal provider. Every trade action, whether manual, by EA or from your phone, is instantly sent as a message to Telegram. You can fully customize the format or use a ready-made template for quick setup. [ Demo ] [ Manual ] [ MT4 Version ] [ Discord Version ]     New: [ Telegram To MT5 ] Setup A step by step user guide is available. Key Features Ability to customize order details sent to subscribers You can create a tiered subs
    Risk Manager Pro MT5
    Roman Zhitnik
    5 (8)
    Risk Manager Pro MT5 is an account protection Expert Advisor for traders who want strict risk control inside MetaTrader 5. The utility monitors your account equity, daily and weekly results, drawdown, open positions, trade count, consecutive losses, and trading hours. When a configured limit is reached, it can automatically close positions, cancel pending orders, stop other EAs, send notifications, or close the terminal. Instead of relying on discipline during a stressful trading session, you de
    Trade Dashboard MT5
    Fatemeh Ameri
    4.95 (132)
    Trade Dashboard simplifies how you open, manage, and control your trades, with built-in lot size calculation. It allows you to execute trades, manage risk, and control positions directly on the chart, with tools such as partial close, breakeven, and trailing stop. Designed to reduce manual work and help you stay focused on your trading decisions. A demo version is available for testing. Detailed explanations of features are provided within the MQL5 platform. Installation instructions are include
    EA Portfolio Analyzer
    Jimmy Peter Eriksson
    4 (1)
    Installation Guide:  Click Here! Analyze Multiple Expert Advisors Together Compare EA Results By Magic Number Track Profitability And Drawdowns Filter Results By Date Range Visual Equity Curve And Detailed Metrics Ready To Use In Under One Minute EA Portfolio Analyzer EA Portfolio Analyzer is a professional analytics tool designed to monitor the live performance of multiple Expert Advisors in a clear and structured way. When running several EAs on the same account, it can be difficult to unders
    Welcome to ENTRY IN THE ZONE WITH SMC MULTI TIMEFRAME Entry In The Zone and SMC Multi Timeframe is a real-time market analysis tool based on Smart Money Concepts (SMC), designed to analyze market structure, price direction, and key trading zones. It supports both Single-Timeframe Analysis and Multi-Timeframe Analysis, providing a clearer view of the overall market structure across multiple timeframes, with real-time BUY / SELL signals that do not repaint. It is designed to help filter trading op
    More from author
    This product can be used to synchronize multiple Charts, and each Chart can be set to a different sync mode. With this product you can better view and manipulate charts: different time frames for a single Symbol, the same time frame for multiple Symbols... and more. PS: The link below is the FreeDemo product, you can use it on EURUSD/XUAUSD/USDCNH symbol: https://www.mql5.com/en/market/product/38557 Feature: Chart settings  can be synchronized, including : background, indentation, size, etc. M
    Do you think it's a bit cumbersome when you need to switch symbols or timeframes with mouse click? 1. What is this? This is a program that can switch symbols and timeframes with direction keys. Fast switching, very convenient, no mouse click required. For traders, one symbol with multi-timeframe charts are usually added,  you can change symbol on those charts easily. For multi-currency traders, different symbol charts are usually added, you can also change those timeframes easily. I wrote this p
    1. What is this         Rising volatility and falling volatility are not the same, whether it is academic research or actual testing has shown this point.         The original ATR indicator is calculated by putting up and down fluctuations together. This indicator is to calculate separately the upward volatility and the downward volatility, which can better help you study the market. 2. Indicator description          There are two modes for the calculation of this indicator, as shown in the fo
    Have you ever take a long time to watch a Symbol when the network link is not good ? Have you ever wait for a long time when you switch chart between different Symbols or different TimeFrames ? If you do long-term backtesting , Have you ever to be downloaded datas for a long time ? Yes, If there is no data in the system, those will happen.  1. What is this: Download all the Symbol data in Market Watch to the system. PS: This is not outputting data to Files. This Link go to Demo version: https:/
    This product can be used to synchronize multiple Charts, and each Chart can be set to a different sync mode. With this product you can better view and manipulate charts: different time frames for a single Symbol, the same time frame for multiple Symbols, system indicators for single/multiple Symbols... and more. Feature: Chart settings can be synchronized, including : background, indentation, size, etc. Multiple Chart window start times  or end times can be synchronized. Multiple Chart time fr
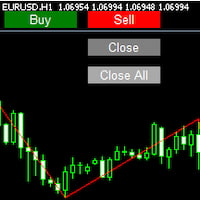
    I see that many tools in the market deal with Position and Order in the form of operation panels. Which is loaded into a Chart in the form of an EA. However, once the operator panel EA is loaded, no other EAs can be loaded. So, I wrote the one-click operation of Position and Order as a script, so you can load other EAs and easily complete one-click operation of Trade. 1. What is this: This is a one-click script to close position order. Now you can close position tickets at high speed, for examp
    I see that many tools in the market deal with Position and Order in the form of operation panels. Which is loaded into a Chart in the form of an EA. However, once the operator panel EA is loaded, no other EAs can be loaded. So, I wrote the one-click operation of Position and Order as a script, so you can load other EAs and easily complete one-click operation of Trade. 1. What is this: This is a one-click script to delete the pending order . Now you can delete pending tickets at high speed, for

    Do you think it's a bit cumbersome when you need to switch symbols or timeframes with mouse click? 1. What is this? This is a program that can switch symbols and timeframes with direction keys. Fast switching, very convenient, no mouse click required. For traders, one symbol with multi-timeframe charts are usually added,  you can change symbol on those charts  easily . For multi-currency traders, different symbol charts are usually added, you can also change those timeframes easily. I wrote thi
    According to trading experience: Some symbols are easy to reverse on certain days, such as Monday, or afternoon, and so on. So comparing the current price with the corresponding historical moment price is valuable. If the price coordinate system uses a logarithmic price, you will get a lot of valuable information. 1. What is this? This program can convert the symbol price and add it to your Chart. You can compare it with your major chart. The DEMO version Link: https://www.mql5.com/en/market/pr

    What is this: Violent trading: means sending a large number of orders to your brokerage server,  it can conduct a stress test of the trading. In this program you can run a variety of trading tests.  Now you can trade at high speed, For example 1000 orders in an instant. The Demo version's link:  https://www.mql5.com/en/market/product/38431/ Why to use: Whether manual trading or EA trading,  the status of the broker server is very important. So it is beneficial to conduct a trading stress test on
    1. Why did I develop this series of indicators I found that most traders need to use multiple time frame indicators. They usually switch time frame to see indicators. However, once the timeframe is switched, you cannot see the  corresponding relationship  between  the price in the smaller timeframe  and  the indicator in the larger timeframe . For example: if your price chart is in H1 timeframe, you can see H4, D1 and W1 indicators in H1 timeframe Chart. This is more helpful for you to find th
    1. Why did I develop this series of indicators I found that most traders need to use multiple time frame indicators. They usually switch time frame to see indicators. However, once the timeframe is switched, you cannot see the  corresponding relationship  between  the price in the smaller timeframe  and  the indicator in the larger timeframe . For example: if your price chart is in H1 timeframe, you can see H4, D1 and W1 indicators in H1 timeframe Chart. This is more helpful for you to find th
    1. Why did I develop this series of indicators I found that most traders need to use multiple time frame indicators. They usually switch time frame to see indicators. However, once the timeframe is switched, you cannot see the  corresponding relationship  between  the price in the smaller timeframe  and  the indicator in the larger timeframe . For example: if your price chart is in H1 timeframe, you can see H4, D1 and W1 indicators in H1 timeframe Chart. This is more helpful for you to find th
    1. Why did I develop this series of indicators I found that most traders need to use multiple time frame indicators. They usually switch time frame to see indicators. However, once the timeframe is switched, you cannot see the  corresponding relationship  between  the price in the smaller timeframe  and  the indicator in the larger timeframe . For example: if your price chart is in H1 timeframe, you can see H4, D1 and W1 indicators in H1 timeframe Chart. This is more helpful for you to find th
    1. Why did I develop this series of indicators I found that most traders need to use multiple time frame indicators. They usually switch time frame to see indicators. However, once the timeframe is switched, you cannot see the  corresponding relationship  between  the price in the smaller timeframe  and  the indicator in the larger timeframe . For example: if your price chart is in H1 timeframe, you can see H4, D1 and W1 indicators in H1 timeframe Chart. This is more helpful for you to find th
    1. Why did I develop this series of indicators I found that most traders need to use multiple time frame indicators. They usually switch time frame to see indicators. However, once the timeframe is switched, you cannot see the  corresponding relationship  between  the price in the smaller timeframe  and  the indicator in the larger timeframe . For example: if your price chart is in H1 timeframe, you can see H4, D1 and W1 indicators in H1 timeframe Chart. This is more helpful for you to find th
    1. Why did I develop this series of indicators I found that most traders need to use multiple time frame indicators. They usually switch time frame to see indicators. However, once the timeframe is switched, you cannot see the  corresponding relationship  between  the price in the smaller timeframe  and  the indicator in the larger timeframe . For example: if your price chart is in H1 timeframe, you can see H4, D1 and W1 indicators in H1 timeframe Chart. This is more helpful for you to find th
    1. Why did I develop this series of indicators I found that most traders need to use multiple time frame indicators. They usually switch time frame to see indicators. However, once the timeframe is switched, you cannot see the  corresponding relationship  between  the price in the smaller timeframe  and  the indicator in the larger timeframe . For example: if your price chart is in H1 timeframe, you can see H4, D1 and W1 indicators in H1 timeframe Chart. This is more helpful for you to find th
    1. Why did I develop this series of indicators I found that most traders need to use multiple time frame indicators. They usually switch time frame to see indicators. However, once the timeframe is switched, you cannot see the  corresponding relationship  between  the price in the smaller timeframe  and  the indicator in the larger timeframe . For example: if your price chart is in H1 timeframe, you can see H4, D1 and W1 indicators in H1 timeframe Chart. This is more helpful for you to find th
    1. Why did I develop this series of indicators I found that most traders need to use multiple time frame indicators. They usually switch time frame to see indicators. However, once the timeframe is switched, you cannot see the  corresponding relationship  between  the price in the smaller timeframe  and  the indicator in the larger timeframe . For example: if your price chart is in H1 timeframe, you can see H4, D1 and W1 indicators in H1 timeframe Chart. This is more helpful for you to find th
    1. Why did I develop this series of indicators I found that most traders need to use multiple time frame indicators. They usually switch time frame to see indicators. However, once the timeframe is switched, you cannot see the  corresponding relationship  between  the price in the smaller timeframe  and  the indicator in the larger timeframe . For example: if your price chart is in H1 timeframe, you can see H4, D1 and W1 indicators in H1 timeframe Chart. This is more helpful for you to find th
    1. Why did I develop this series of indicators I found that most traders need to use multiple time frame indicators. They usually switch time frame to see indicators. However, once the timeframe is switched, you cannot see the  corresponding relationship  between  the price in the smaller timeframe  and  the indicator in the larger timeframe . For example: if your price chart is in H1 timeframe, you can see H4, D1 and W1 indicators in H1 timeframe Chart. This is more helpful for you to find th
    1. Why did I develop this series of indicators I found that most traders need to use multiple time frame indicators. They usually switch time frame to see indicators. However, once the timeframe is switched, you cannot see the  corresponding relationship  between  the price in the smaller timeframe  and  the indicator in the larger timeframe . For example: if your price chart is in H1 timeframe, you can see H4, D1 and W1 indicators in H1 timeframe Chart. This is more helpful for you to find th
    1. Why did I develop this series of indicators I found that most traders need to use multiple time frame indicators. They usually switch time frame to see indicators. However, once the timeframe is switched, you cannot see the  corresponding relationship  between  the price in the smaller timeframe  and  the indicator in the larger timeframe . For example: if your price chart is in H1 timeframe, you can see H4, D1 and W1 indicators in H1 timeframe Chart. This is more helpful for you to find th
    1. Why did I develop this series of indicators I found that most traders need to use multiple time frame indicators. They usually switch time frame to see indicators. However, once the timeframe is switched, you cannot see the  corresponding relationship  between  the price in the smaller timeframe  and  the indicator in the larger timeframe . For example: if your price chart is in H1 timeframe, you can see H4, D1 and W1 indicators in H1 timeframe Chart. This is more helpful for you to find th
    1. Why did I develop this series of indicators I found that most traders need to use multiple time frame indicators. They usually switch time frame to see indicators. However, once the timeframe is switched, you cannot see the  corresponding relationship  between  the price in the smaller timeframe  and  the indicator in the larger timeframe . For example: if your price chart is in H1 timeframe, you can see H4, D1 and W1 indicators in H1 timeframe Chart. This is more helpful for you to find th
    1. Why did I develop this series of indicators I found that most traders need to use multiple time frame indicators. They usually switch time frame to see indicators. However, once the timeframe is switched, you cannot see the  corresponding relationship  between  the price in the smaller timeframe  and  the indicator in the larger timeframe . For example: if your price chart is in H1 timeframe, you can see H4, D1 and W1 indicators in H1 timeframe Chart. This is more helpful for you to find th
    1. Why did I develop this series of indicators I found that most traders need to use multiple time frame indicators. They usually switch time frame to see indicators. However, once the timeframe is switched, you cannot see the  corresponding relationship  between  the price in the smaller timeframe  and  the indicator in the larger timeframe . For example: if your price chart is in H1 timeframe, you can see H4, D1 and W1 indicators in H1 timeframe Chart. This is more helpful for you to find th
    1. Why did I develop this series of indicators I found that most traders need to use multiple time frame indicators. They usually switch time frame to see indicators. However, once the timeframe is switched, you cannot see the  corresponding relationship  between  the price in the smaller timeframe  and  the indicator in the larger timeframe . For example: if your price chart is in H1 timeframe, you can see H4, D1 and W1 indicators in H1 timeframe Chart. This is more helpful for you to find th
    1. Why did I develop this series of indicators I found that most traders need to use multiple time frame indicators. They usually switch time frame to see indicators. However, once the timeframe is switched, you cannot see the  corresponding relationship  between  the price in the smaller timeframe  and  the indicator in the larger timeframe . For example: if your price chart is in H1 timeframe, you can see H4, D1 and W1 indicators in H1 timeframe Chart. This is more helpful for you to find th
    Filter:
    Аврора
    96
    Аврора 2021.10.15 03:47 
     

    User didn't leave any comment to the rating

    Reply to review