• 概述
  • 评论 (1)
  • 评论
  • 新特性

Rigorous Market Sessions SubWindow

1. 这是什么.

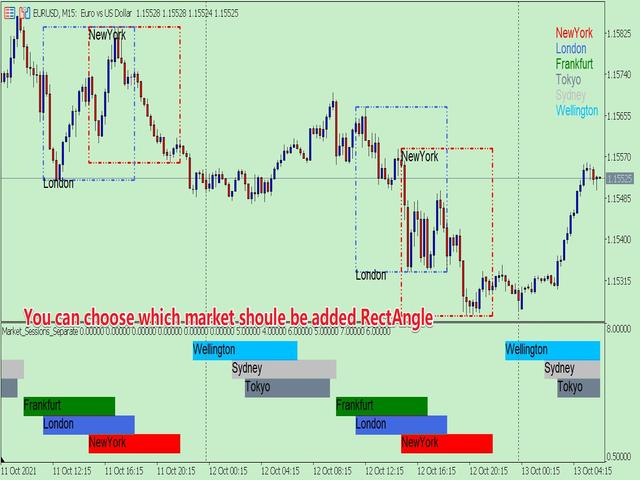
        这是一个非常严谨的以展示不同市场交易时段的指标。它展示了主要市场:NewYork, London, Frankfurt, Sydney, Wellington, Tokyo.

        非常重要:

不同的市场夏令时起止日期不同,而一个市场的交易时段又会因夏令时冬令时而不同。

同时,北半球国家、南半球国家夏令时制度也是不同的,以及一个市场在不同的年份,夏令时的制度也是变化的。 

比如:纽约夏令时制度:

  • 1987年-2006年:4月第一个星期日02:00      -->   10月最后一个星期日02:00
  • 2007年-至今:    3月的第二个星期日02:00   -->   11月的第一个星期日02:00
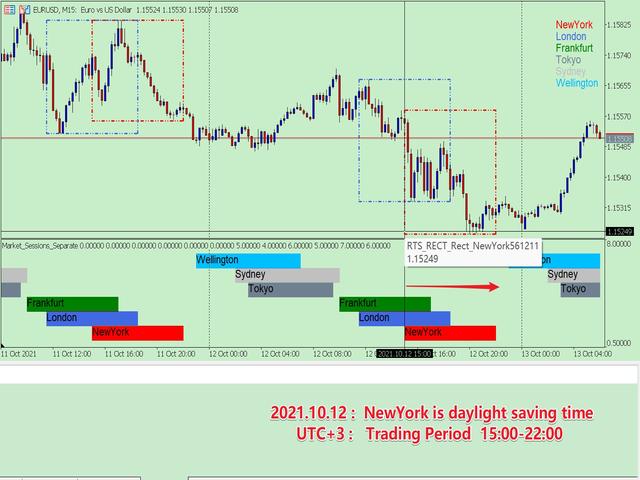
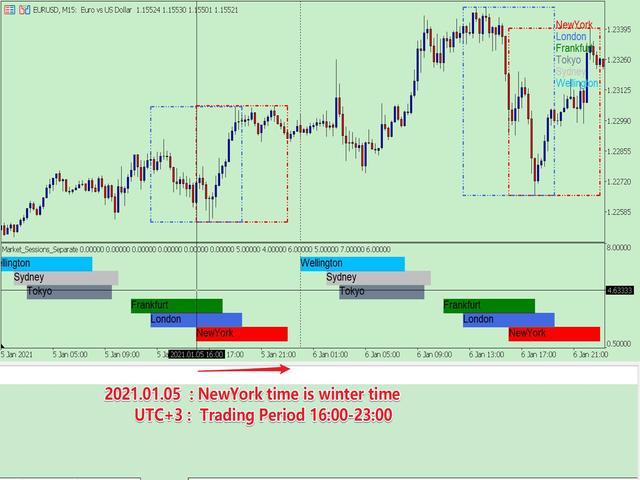
纽约外汇市场交易时段(UTC+3):  15:00-22:00(夏令时);   16:00-23:00(冬令时)。

            所以交易时段,必须要考虑历史上所在城市、所处年份的夏令时日期、以及对应的交易时段,否则交易时段是错误的。但是如果这些都是手工设置,非常的繁琐,本程序就可以自动设置。

    你可以参阅我的博客了解主要国家的夏令时制度以及交易时段:

    DAYLIGHT SAVING TIME RECORDS OF MAJOR COUNTRIES

    OPENING AND CLOSING TIME OF MAJOR INTERNATIONAL FOREIGN EXCHANGE MARKETS


    2. 程序特色

    • 自动判断价格的时间是否处在当年的夏令时中;
    • 根据市场是否处于夏令时,自动判断市场的交易时间段;
    • 根据你希望的UTC时区,自动转换交易时间段;
    • 历史数据全部进行了严谨的匹配,所以你可以得到准确的历史上的市场交易时段,这便于你进行研究。
    • 多种展示模式,你总能够找到适合你自己的方案。

    3. 如何使用(子窗口模式)

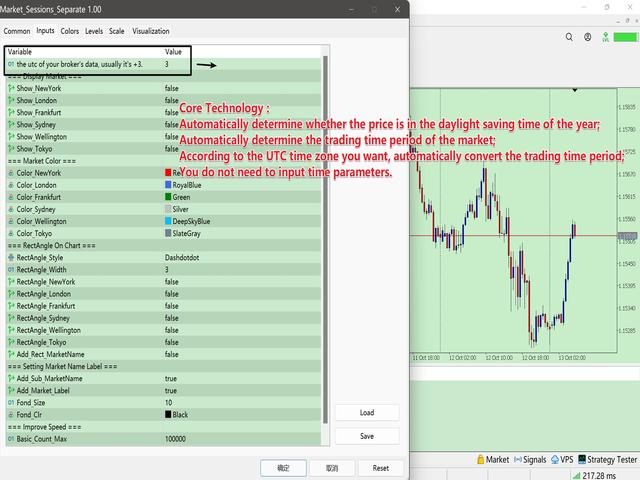
    参数以分组的形式表示,它非常容易理解,下面介绍下各个参数组:

    • the utc of your broker's data, usually it's +3.
    • group "=== Display Market ===" :   组内的参数为选择是否显示对应的市场,这是单个市场的总控制键。
      • Show_NewYork = true;
      • Show_London = true;
      • Show_Frankfurt = true;
      • Show_Sydney = true;
      • Show_Wellington = true;
      • Show_Tokyo = true;
    • group "=== Market Color ===" :  组内的参数为设置各个市场的颜色
      • Color_NewYork = clrRed;
      • Color_London = clrRoyalBlue;
      • Color_Frankfurt = clrGreen;
      • Color_Sydney = clrSilver;
      • Color_Wellington = clrDeepSkyBlue;
      • Color_Tokyo = clrSlateGray;
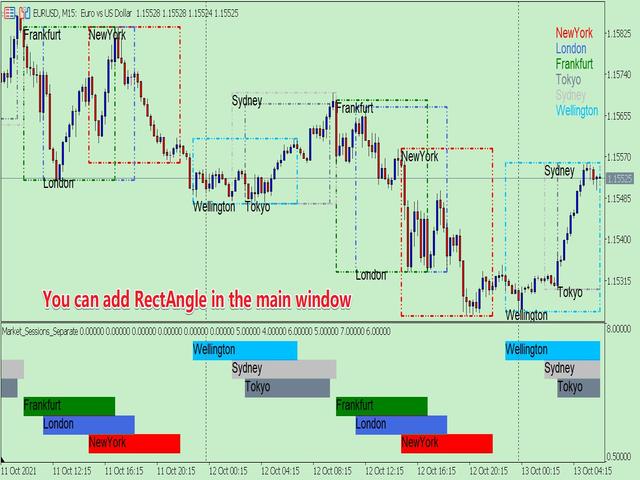
    • group "=== RectAngle On Chart ===" :   组内的参数设定是否在主窗口添加 方框
      • RectAngle_Style = STYLE_DASHDOTDOT;        //  方框的类型
      • RectAngle_Width = 3;        //  方框的宽度,根据MT5的限制,只有 STYLE_SOLID、STYLE_DASHDOTDOT 类型才可以大于1.
      • RectAngle_NewYork = true;
      • RectAngle_London = true;
      • RectAngle_Frankfurt = true;
      • RectAngle_Sydney = true;
      • RectAngle_Wellington = true;
      • RectAngle_Tokyo = true;
      • Add_Rect_MarketName = true;        //  是否在方框添加市场名称
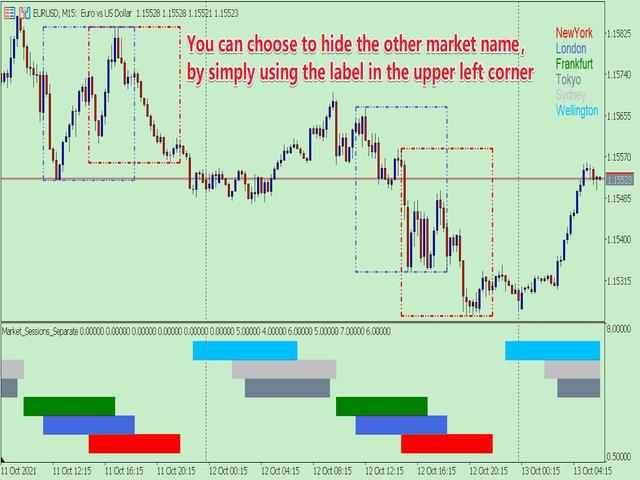
    • group "=== Setting Market Name Label ===" :  组内的参数设定是否显示市场名称
      • Add_Sub_MarketName = true;     //  是否在子窗口添加市场名称
      • Add_Market_Label = true;        //  是否在主窗口右上角显示市场名称
      • Fond_Size = 10;        //  文字的大小
      • Fond_Clr = clrBlack;        //  文字的颜色
    • group "=== Improve Speed ===" :  组内的参数用于设定计算的数量。在研究历史数据时,可以设置大一点;在实时交易时,可以设置小一点。
      • Basic_Count_Max = 100000;     //   基本的数据数量,这个可以设置的很大。
      • Object_Count_Days = 5;        //  以日为单位,方框、名称标签的数量。


    4. 其他

            由于MT5的限制,我不得不把程序写成两种形式。 

    一个是子窗口模式;另一个是主窗口模式两种模式有所不同,总有一个适合你。当前页面为子窗口模式。


    推荐产品
    1. 这是什么.         这是一个 非常严谨 的以展示不同市场交易时段的指标。它展示了主要市场:NewYork, London, Frankfurt, Sydney, Wellington, Tokyo.         非常重要: 不同的市场夏令时起止日期不同,而一个市场的交易时段又会因夏令时冬令时而不同。 同时,北半球国家、南半球国家夏令时制度也是不同的,以及一个市场在不同的年份,夏令时的制度也是变化的。   比如: 纽约夏令时制度: 1987年-2006年:4月第一个星期日02:00      -->   10月最后一个星期日02:00 2007年-至今:    3月的第二个星期日02:00   -->   11月的第一个星期日02:00 纽约外汇市场交易时段(UTC+3):  15:00-22:00(夏令时);   16:00-23:00(冬令时)。         所以交易时段,必须要考虑历史上所在城市、所处年份的夏令时日期、以及对应的交易时段,否则交易时段是错误的。但是如果这些都是手工设置,非常的繁琐,本程序就可以自动设置。 你可以参阅我的博客了解主要国家的夏令时
    Exact Time — detailed time on the seconds chart. The utility shows the opening time of the selected candle. This is necessary when working with seconds charts. For example, it can be used on a seconds chart built using the " Seconds Chart " utility, which helps to build seconds chart in the MT5 terminal. Use the CTRL key to turn on/off the time display on the chart.
    FREE
    * This product was converted using  "BRiCK Convert4To5 MT4 "  based on the MQL4 source file of  "BRiCK Convert4To5 MT4 Free" . "Convert4To5" is a Script that converts MQL4 source files into MQL5 source files. Experts, Indicators, Scripts, and Libraries with extension ".mq4" will be available for MT5. Parameter None. Procedure 1. Open the following folder.     terminal_data_folder\MQL4\Files\ (in the terminal menu select to view "File" - "Open the data directory") 2. Confirm that the BRiC
    FREE
    Market book tester
    Aliaksandr Hryshyn
    1 (1)
    Using data from the order book in the strategy tester Key features: Simultaneous use of several symbols, up to 7 pieces DOM visualization With the visualization of order books, real-time simulation is available, as well as acceleration or deceleration Working with the library: This product also requires a utility to save data:  https://www.mql5.com/en/market/product/71642 Speed control utility:  https://www.mql5.com/en/market/product/81409 Include file:   https://c.mql5.com/31/735/Market_book_s
    FREE
    具体用途: 导出市场报价中的交易品种至表格文件,方便用户使用 EXCEL 分析交易品种,更快更方便的查找和选择适合的交易品种。 想要全部交易品种,可以在 市场报价 -> 交易品种 -> 单击右键 -> 全部显示,这样就能下载全部交易品种。 参数说明: 周期,可以选择 M1、D1、W1、MN 等等,默认为 D1 ,分析每天从开盘至最高、开盘至最低、开盘至收盘、最高至最低的相差点数。 周期数量,用于统计的数量,默认为 22 天,统计出 22 天中平均每天的相差点数。 文件说明: MQL5 要求读取或保存的文件必须在指定的数据文件夹里,所以请手动打开文件夹。 文件存在数据文件夹里,“数据文件夹/MQL5/Files/SymbolsData.csv”。
    FREE
    Close by percentage MT5
    Konstantin Kulikov
    4.86 (7)
    Hello friends. I wrote this utility specifically for use in my profile with a large number of Expert Advisors and sets ("Joint_profiles_from_grid_sets"   https://www.mql5.com/en/blogs/post/747929 ). Now, in order to limit losses on the account, there is no need to change the "Close_positions_at_percentage_of_loss" parameter on each chart. Just open   one   additional chart, attach this utility and set the desired percentage for closing all trades on the account. The utility has the following fu
    FREE
    SIMPLE AND QUICK CHART CLEANUP SCRIPT - FREE FOR ALL - EASY TO DRAG AND DROP ONTO THE CHART - A MUST HAVE IN MY EYES Everybody loves to draw on a chart! But cleaning is nobodies favor. Most of the time it will be faster to dump all and redraw the important part. Repetition makes you good! ALWAYS think about that! KEEP IT GROWING, ;-) I wish you a good day, Traders! If you need something, send me a message. Best wishes to you from Vienna!
    FREE
    Ordem Facil
    Clesio Hector Dufau Da Conceicao
    EA Ordem Fácil helps you open pending buy and sell orders (buy or sell stop) using the SHIFT, CTRL keys and mouse left button click. To create a buy stop order, press the SHIFT key (only once) and click on mouse left button on the chart above the price. To create a sell stop order, press the CTRL key (only once) and click on mouse left button on the chart below the price. While the order is not opened, when you moving the mouse cursor on the chart, on the left and above corner of the ch
    This tool will allow you to export the Historical data (Open, High, Low, Close, Volume) for any financial instrument present in your MetaTrader 5. You can download multiple Symbols and TimeFrames in the same csv file. Also, you can schedule the frequency of download (every 5 minutes, 60 minutes, etc.). No need to open a lot of charts in order to get the last data, the tool will download the data directly. The CSV File will be stored in the folder: \MQL5\Files . How it works Select the Symbols
    FREE
    PROMOTION!! $499 until 1 Mar. After that, EA will be $1,050 Developed and tested for over 3 years, this is one of the safest EAs on the planet for trading the New York Open. Trading could never be easier.  Trade On NASDAQ US30 (Dow Jones Industrial Average) S&P 500  What Does The EA do? The EA will open a Buy Stop Order and a Sell Stop Order(With SL and TP) on either side of the market just a few seconds before the NY Open.  As soon as 1 of the 2 trades is triggered, the EA automatically delete
    Symbol Manager for MT5
    Taras Slobodyanik
    5 (1)
    Symbol Manager or Grid Manager, designed to group orders into one position (by symbol and by direction). This utility will be useful to multi-currency traders, who can have multiple orders on several pairs. You will be able to see the total number of lots, the total profit, and set virtual stop loss and virtual take profit. To set a real TP (or SL), you must first set the virtual value, and then enter the command in this cell: "set". If you want to set real TP/SL for all orders at once, then en
    使用说明: https://www.mql5.com/zh/blogs/post/754946 MT4版本: https://www.mql5.com/zh/market/product/88205 MT5 版本: https://www.mql5.com/zh/market/product/88204 ---------------------------------------------- 1.复制订单,从12个主帐号到100个从帐号.从帐号数量可以自定,从12个到100个。 2.支持MT4到MT4, MT4到MT5, MT5到MT4,MT5 到MT5. 3.识别不同平台的交易品种后缀,如EURUSD,EURUSDm,EURUSDk. 4.自定义货币匹配,如XAUUSD=GOLD. 5.可复制所有交易,或只复制BUY,SELL,CLOSE指令 6.可选择是否复制止盈止损 7.可反向复制,如主帐号是BUY,从帐户就是SELL,反之也是。当主帐号平仓时,从帐户不管是同向复制还是反向复制,都会同时平仓 8.发生意外如从帐号关闭时,主帐号有平仓信号而从帐号没有及时复制,当从帐号再次
    Hi you, I need your help! Be my Patron, let's make it possible! https://www.patreon.com/joaopeuko https://github.com/Joaopeuko/Mql5-Python-Integration Channel: English version - Versão Inglês: https://www.mql5.com/en/channels/Mql5_Python_Integration_EN Portuguese version - Versão Português: https://www.mql5.com/en/channels/Mql5_Python_Integration_PT Free version with 5 indicators: https://www.mql5.com/en/market/product/57574 This version has 38 indicators, 5 from the free vers
    FREE
    The best time to trade Using this Indicator is when the time reach exactly hour,half,45 minutes,15 minutes and sometimes 5 minutes.. This indicators is helpful to those who trade boom and crash indecies.How to read this indicator first you'll see Blue allow and Red allow all these allows used to indicate or to detect the spike which will happen so the allow happens soon before the spike happen.This indicator works properly only in boom and crash trading thing which you have to consider when
    MACD Colored ZeroLag
    Farzin Sadeghi Bonjar
    4.14 (7)
    It is the MQL5 version of zero lag MACD that was available for MT4 here: https://www.mql5.com/en/code/9993 Also there was a colored version of it here but it had some problems: https://www.mql5.com/en/code/8703 I fixed the MT4 version which has 95 lines of code. It took me 5 days to write the MT5 version.(reading the logs and testing multiple times and finding out the difference of MT5 and MT4!) My first MQL5 version of this indicator had 400 lines of code but I optimized my own code again and n
    FREE
    Value Chart Candlesticks
    Flavio Javier Jarabeck
    4.67 (9)
    The idea of a Value Chart indicator was presented in the very good book I read back in 2020 , " Dynamic Trading Indicators: Winning with Value Charts and Price Action Profile ", from the authors Mark Helweg and David Stendahl. The idea is simple and the result is pure genius: Present candlestick Price analysis in a detrended way! HOW TO READ THIS INDICATOR Look for Overbought and Oversold levels. Of course, you will need to test the settings a lot to find the "correct" one for your approach.
    FREE
    MarketPro toolkit
    Johannes Hermanus Cilliers
    Start earning profits by copying All trades are sent by our successful Forex trader & are extremely profitable. You can earn profits by copying trades daily Trial Period included You'll also get access to extremely powerful trading education which is designed in a simple way for you to become a profitable trader, even if you have no trading experience. https://ec137gsj1wp5tp7dbjkdkxfr4x.hop.clickbank.net/?cbpage=vip
    FREE
    White Weis Volume Ticks
    Ricardo Almeida Branco
    5 (3)
    White Weis Volume This indicator shows the sum of the volume in each wave, bulish or bearish, as idealized by David Weis , but it brings an important addition , which is the marking of the bar with the highest volume of the wave (White Bar)! In coding the indicator, it was sought to optimize the code to require minimal processing during use and not to overload mt5. The indicator can be used for pre-trading analysis and study, where the trader analyzes possible points of support and resi
    LT Ajuste Diario
    Thiago Duarte
    3.67 (3)
    This is a tool in script type. It shows in chart the actual and/or past day ajust price in a horizontal line. The symbol name and it expiration must be set up according to the actual parameters. The lines appearance are fully customizable. You need to authorize the B3 url on MT5 configurations:  www2.bmf.com.br. You need this to the tool can work. This is a tool for brazilian B3 market only!
    FREE
    Volume Weighted Average Price or VWAP is an indicator wich shows different average prices on chart. This is very useful to find strong negotiation price areas and as trend following. Configurations: Day, Week and Month - Show different VWAPs according to the period. You can change each line style on "colors" tab. Any doubt or suggestion please contact us. Enjoy! This is a free indicator, but it took hours to develop. If you want to pay me a coffee, I appreciate a lot   <3 PayPal, Skrill, Ne
    FREE
    Weis Waves
    Flavio Javier Jarabeck
    3.15 (26)
    The original author is David Weis, an expert in the Wyckoff Method. The Weis Wave is a modern adaptation of the 1930's Wyckoff Method, another expert in Tape Reading techniques and Chart Analysis. Weis Waves takes market volume and stacks it into waves according to price conditions giving the trader valuable insights about the market conditions. If you want to learn more about this subject you can find tons of videos in YouTube. Just look for "The Wickoff Method", "Weis Wave" and "Volume Spread
    FREE
    News Loader Pro is a tool that automatically updates every economic news in real time with detailed information from several online data sources. It uses the unique technology to load data with full details from popular Forex websites. An alert will be sent to your mobile/email before an upcoming news release. Moreover, it also marks the news release points on the chart for further review and research. In Forex trading, news is one of the important factors that move the market. Sticking with ne
    Presentation The URL html and xml to csv is designed to get contents from URLs with html or xml content, and to download it to an output format as a txt or as a csv file. It enables to get the whole web sites page, starting with the http protocol, in a document for a further use and in additional with downloading directly on the MetaTrader applications and on the desktop. It is a good advantage for taking the most data from events and economic calendars, and also publications related to the inst
    FREE
    CloseAll MT5
    Mr Sorachai Pitakjarukul
    5 (2)
    ขอบคุณ แรงบันดาลใจ จากโค้ชแพม ที่ทำให้เริ่มทำ    Close all ตัวนี้  และขอขอบคุณทุกคนที่ให้ความรู็มาโดยตลอด ไม่ว่าจะทางตรงทางอ้อม ขอบคุณทุกคนที่ให้ความรู้เพื่อนร่วมเทรด ทั้งนี้เพื่อให้นักเทรดทุกคนได้มีเครื่องมือในการควบคุมการปิดการซื้อขาย จึงขอพัฒนาโปรแกรม close all version 5 ได้ใช้ทุกคน  Close all and update profit Version 1.00 (MT5) Full version Give you free  For MT4 Click  https://www.mql5.com/en/market/product/79252 Fix TPSL calculate  Program function Tab 1 Close order function and sh
    FREE
    Get news5
    Aleksander Gladkov
    Utility for reading news from investing.com To access the site, you need to add WebRequest in the Options terminal menu on the Expert Advisors tab: https://sslecal2.investing.com If reading is successful, a message about writing the file is displayed. The INV_week_this.txt file is written to the MQL5\Files folder of the terminal and is kept up to date, updating data according to its own timer You can attach the utility to any chart with any time frame; just one is enough to support indicat
    this is DEMO VERISON (for demo acc.) of  TRADING OVERLAY with PARTIAL take profit    ("virtual TP")   and % risk lot size   --- full version available   on my 'seller page' as well as version for MT4 Take better control of your trades with ease ! Easy lot size calculation with easy SL/TP setting. Your trading will be much more comfortable with this tool!   Main goal with this tool is very SIMPLE and FAST operation!    Works like any EA, add it to selected chart and trade ! Features: start
    FREE
    Donchian Pro
    Paulo Henrique Faquineli Garcia
    5 (2)
    The Donchian Channel Channels are among the most popular tools of technical analysis, as they visually convey to the analyst the limits within which most price movement tends to occur. Channel users know that valuable information can be obtained at any time, whether prices are in the central region of a band or close to one of the border lines. One of the best known techniques to explore these concepts is Bollinger Bands. However, John Bollinger was not the only one to research the applicatio
    FREE
    MetaCOT 2 is a set of indicators and specialized utilities for the analysis of the U.S. Commodity Futures Trading Commission reports. Thanks to the reports issued by the Commission, it is possible to analyze the size and direction of the positions of the major market participants, which brings the long-term price prediction accuracy to a new higher-quality level, inaccessible to most traders. These indicators, related to the fundamental analysis, can also be used as an effective long-term filter
    FREE
    Sigma Revert Hand
    Italo Martins Coutinho
    Apenas Abre posições em lado inverso para cada posição aberta e fecha as posições antigas Exceução de Inversão de mão de modo rápido, funciona em Conta Hedge e Netting Para mais detalhes de configurações e input de variáveis entre em nossa comunidade no guilded ( https://www.guilded.gg/i/E9m8bYLE ) Inclui Rompimentos, Canais Estreitos, Canais Amplos e Lateralidades, ou seja para todos os ciclos
    FREE
    Easy Copier Limited  is utility tool to copy trade / trade copier form one account (master) to other account (slave) .  It works only with a single forex ( EURUSD ) . You can use this tool as local copier ( Terminals have to be in same PC / VPS ) as well as Remote Copier ( Terminals can be in different PC / VPS ). For remote copy you can use my server or it can be configured to your server . Trades are possible to copy from    MT4 => MT4     MT4 => MT5         MT5 => MT5       MT5 => M
    该产品的买家也购买
    Trade Assistant MT5
    Evgeniy Kravchenko
    4.4 (171)
    它有助于计算每笔交易的风险,容易安装新的订单,具有部分关闭功能的订单管理, 7 种类型的追踪止损和其他有用的功能。   注意,该应用程序在策略测试器中不起作用。 您可以在描述页面下载演示版  Manual, Description, Download demo 线条功能  - 在图表上显示开仓线、止损线、止盈线。 有了这个功能,就可以很容易地设置一个新的订单,并在开仓前看到它的附加特性。   风险管理  - 风险计算功能在考虑到设定的风险和止损单的大小的情况下,计算新订单的成交量。它允许你设置任何大小的止损,同时观察设定的风险。 批量计算按钮 - 启用 / 禁用风险计算。 在 " 风险 " 一栏中设置必要的风险值,从 0 到 100 的百分比或存款的货币。 在 " 设置 " 选项卡上选择风险计算的变量: $ 货币, % 余额, % 资产, % 自由保证金, % 自定义, %AB 前一天, %AB 前一周, %AB 前一个月。   R/TP 和 R/SL - 设置止盈和止损的关系。 这允许你设置相对于损失的利润大小。 例如, 1 : 1 - 这决定了 TP = SL 的大小。 2 :
    您认为在价格可以瞬间变化的市场中,下单应该尽可能简单吗? 在 Metatrader 中,每次您要开单时,您都必须打开一个窗口,您可以在其中输入开盘价、止损和止盈以及交易规模。 在金融市场交易中,资本管理对于维持您的初始存款并使其倍增至关重要。 因此,当您想下订单时,您可能想知道应该开多大的交易? 在这单笔交易中,您应该承担多少百分比的存款? 您可以从这笔交易中获利多少,利润风险比是多少? 在您设置交易规模之前,您需要进行必要的计算,以获得交易规模应该是多少的问题的答案。 想象一下,您有一个工具可以自动完成所有这些工作。 您打开图表,进行市场分析并用水平线标记入场点、防御点(止损)和目标(止盈),最后您定义风险水平,例如 作为可用资本的百分比,您可以在此交易中承担,此时程序提供: 定义风险和止损规模的可接受交易规模 以点数、点数和账户货币计的止损和获利值 风险回报率 现在剩下的就是点击面板上的相应按钮来打开交易。 如果您是黄牛,需要在不设置防御或目标的情况下快速打开和关闭交易,那么您可以在交易管理器面板中轻松掌握一切,您可以在其中定义固定订单参数并通过单击“购买”或 “卖出”按钮。 关闭
    TradePanel MT5
    Alfiya Fazylova
    4.86 (113)
    交易面板是一个多功能的交易助手。 该应用程序包含 50 多个专为手动交易而设计的功能。 允许您自动执行大多数交易操作。 在购买之前,您可以在演示帐户上测试演示版本。 演示 这里 。 完整说明 这里 。 应用程序的主要功能: 适用于任何交易工具(外汇、差价合约、期货及其他)。 通过一个终端窗口即可使用所有交易工具。 允许您创建最多四个交易工具工作列表。 允许您选择您最喜欢的交易工具。 允许您在所有(或选定的)终端图表上快速切换交易品种。 允许您使用多种方法来计算交易量。 自动计算每笔交易的风险。 根据止损的大小计算风险。 风险经理。 让您可以在图表上直观地看到新订单的交易水平。 允许您设置虚拟止损和获利。 允许您设置指定的止损和获利比率。 允许您在共同价格水平上为所有头寸设置止损或止盈。 允许您下 OCO 订单(一个订单取消另一个订单)。 允许您根据指定参数关闭订单和平仓。 允许您在达到指定的总利润或损失时平仓。 允许您在图表上设置任务线。 允许您反转“卖出转买入”和“买入转卖出”仓位。 允许您锁定仓位。 允许您设置追踪止损功能。 允许您设置盈亏平衡函数。 允许您设置部分平仓功能。 允许
    Local Trade Copier EA MT5
    Juvenille Emperor Limited
    5 (63)
    通过 Local Trade Copier EA MT5 获得非常快速的交易复制体验。它的简单1分钟设置,使您可以在同一台Windows计算机或Windows VPS上在多个MetaTrader终端之间复制交易,具有闪电般快速的复制速度,低于0.5秒。 无论您是初学者还是专业交易者, Local Trade Copier EA MT5 都提供了广泛的选项,可根据您的特定需求进行自定义。对于任何希望增加利润潜力的人来说,这都是终极解决方案。 今天就尝试一下,看看为什么它是市场上最快、最简单的贸易复印机! 提示: 您可以在您的模拟账户中下载并试用 Local Trade Copier EA MT5 模拟版: 这里 将下载的免费演示文件粘贴到您的 MT5 >> 文件 >> 打开数据文件夹 >> MQL5 >> 专家文件夹并重新启动您的终端。  免费演示版本每次可在 4 小时内发挥全部功能,仅限演示帐户。 要重置试用期,请转至 MT5 >> 工具 >> 全局变量 >> Control + A >> 删除。 请仅在非关键模拟账户上执行此操作,不要在挑战道具公司账户中执行此操作。 Loc
    Trade Manager DaneTrades
    DaneTrades Ltd
    4.73 (22)
    交易管理器可帮助您快速进入和退出交易,同时自动计算风险。 包括帮助您防止过度交易、报复性交易和情绪化交易的功能。 交易可以自动管理,账户绩效指标可以在图表中可视化。 这些功能使该面板成为所有手动交易者的理想选择,并有助于增强 MetaTrader 5 平台。多语言支持。 MT4版本  |  用户指南+演示 交易经理在策略测试器中不起作用。 如需演示,请参阅用户指南 风险管理 根据%或$自动调整风险 可选择使用固定手数或根据交易量和点自动计算手数 使用 RR、点数或价格设置盈亏平衡止损 追踪止损设置 最大每日损失百分比,在达到目标时自动平仓所有交易。 保护账户免遭过多提款并阻止您过度交易 最大每日损失(以美元为单位)在达到目标时自动关闭所有交易。 保护账户免遭过多提款并阻止您过度交易 一键实现所有交易的盈亏平衡 自动计算从手机/电话发送的交易的风险 OCO 在设置中可用 交易和头寸管理 通过设置每月、每周、每天、每小时或每分钟的最大交易次数,停止过度交易和报复性交易。 高级挂单管理。 调整何时关闭挂单的规则 追踪挂单 支持市价订单和挂单 每日最大利润目标(以美元为单位)以确保头寸并停
    The product will copy all telegram signal to MT5 ( which you are member) , also it can work as remote copier.  Easy to set up, copy order instant, can work with almost signal formats, image signal,  s upport to translate other language to English Work with all type of channel or group, even channel have "Restrict Saving Content", work with  multi channel, multi MT5 Work as remote copier: with signal have ticket number, it will copy exactly via ticket number. Support to backtest signal. How to s
    MT5 to Telegram Signal Provider 是一个易于使用且完全可自定义的工具,它允许向 Telegram 的聊天室、频道或群组发送 指定 的信号,将您的账户变为一个 信号提供商 。 与大多数竞争产品不同,它不使用 DLL 导入。 [ 演示 ] [ 手册 ] [ MT4 版本 ] [ Discord 版本 ] [ Telegram 频道 ] 设置 提供了逐步的 用户指南 。 不需要了解 Telegram API;开发者提供了您所需的一切。 关键特性 能够自定义发送给订阅者的订单详情 您可以创建分层的订阅模型,例如铜、银、金。其中金订阅获得所有信号等。 通过 id、符号或评论过滤订单 包括执行订单的图表截图 在发送的截图上绘制已关闭的订单,以便额外核实 延迟发送新订单消息的可能性,以便在发送前对位置进行调整 订单详情完全透明: 新的市场订单*带截图 订单修改(止损、获利) 已关闭的订单*带截图 部分关闭的订单** 新的挂单 修改的挂单(进场价格) 挂单激活(作为新的市场订单附加) 已删除的挂单 历史订单报告*** 可自定义的评论 注意: *
    Bots Builder Pro MT5
    Andrey Barinov
    4.75 (4)
    This is exactly what the name says. Visual strategy builder . One of a kind. Turn your trading strategies and ideas into Expert Advisors without writing single line of code. Generate mql source code files with a few clicks and get your fully functional Expert Advisors, which are ready for live execution, strategy tester and cloud optimization. There are very few options for those who have no programming skills and can not create their trading solutions in the MQL language. Now, with Bots Build
    Mentfx Mmanage mt5
    Anton Jere Calmes
    4.43 (7)
    The added video will showcase all functionality, effectiveness, and uses of the trade manager. Drag and Drop Trade Manager. Draw your entry and have the tool calculate the rest. Advanced targeting and close portions of a trade directly available in tool (manage trades while you sleep). Market order or limit order on either side with factored spread. Just draw the entry, the tool does the rest. Hotkey setup to make it simple. Draw where you want to enter, and the stop loss, the tool calculates al
    Trade copier MT5
    Alfiya Fazylova
    4.35 (26)
    Trade Copier 是一种专业实用程序,旨在复制和同步交易账户之间的交易。 复制发生从供应商的帐户/终端到收件人的帐户/终端,安装在同一台计算机或 vps 上。 在购买之前,您可以在演示帐户上测试演示版本。 演示 这里 。 完整说明 这里 。 主要功能和优点: 支持复制MT5>MT5、MT4>MT5、MT5>MT4,包括МТ5 netting账户。 供应商和收件人模式在同一产品中实现。 简单直观的界面,允许您直接从图表中实时控制复制。 连接中断或终端重新启动时不会丢失设置和位置。 允许您选择要复制的符号,也可以替换接收者的符号,例如 EURUSD> USDJPY。 支持回拷贝。 能够仅复制某些订单。 允许您设置开仓交易价格的最大差异和最大时间延迟。 正确复制部分订单关闭的执行。 计算复制手数的几种方法。 同步止盈和止损。有几种方法可以计算它们的位置。 支持通过执行在“Market account”上工作,其中 SL / TP 仅在开仓后设置。 如何使用简单的设置复制交易 将供应商终端和接收终端安装在同一台计算机或 VPS 上。 在供应商终端上以“Master”模式安装复印机,然后
    The top-selling EAs on the market cost a lot and one day they are suddenly gone. This is because one strategy will not work in the forex market all the time. Our product is unique from all others in the MQL Marketplace because our EA comes with 34+ built-in indicators that allow develop strategies every time.  You build your strategy and keep updating it. If one strategy does not work, simply build another all using only one EA. This is All-In-One EA   in this market place. You can use as trade
    OrderManager MT5
    Lukas Roth
    4.88 (16)
    介绍 OrderManager :MT5的革命性工具 使用全新的Order Manager实用程序,像专业人士一样管理您在MetaTrader 5上的交易。Order Manager设计简单,易于使用,可让您轻松定义和可视化每笔交易的风险,从而做出明智的决策并优化您的交易策略。有关OrderManager的更多信息,请参阅手册。 [ 手册 ] [ MT4版本 ] [ Telegram 频道 ] 主要功能: 风险管理:快速轻松地定义您交易的风险,让您做出更好的决策并提高交易性能。 视觉表示:图形化地查看您的交易和相关风险,以清晰简洁地了解您的开放头寸。 订单修改:只需几次点击即可轻松修改或关闭您的订单,简化您的交易过程,为您节省宝贵的时间。 掌握新闻:一键获取最新市场新闻。 不要错过这个MT5交易员的必备工具。用Order Manager提升您的交易体验,将您的交易游戏提升到新的水平。 OrderManager在startegyTester中 不 工作! OrderManager 仅与 Windows 兼容。 请考虑给这个产品一个5星级评价。您的优秀反馈将激励作者加快更新
    Trade Dashboard MT5
    Fatemeh Ameri
    5 (25)
    Tired of complex order placement and manual calculations? Trade Dashboard is your solution. With its user-friendly interface, placing orders becomes effortless, by a single click, you can open trades, set stop loss and take profit levels, manage trade lot size, and calculate risk to reward ratios, allowing you to only focus on your strategy. Say goodbye to manual calculations and streamline your trading experience with Trade Dashboard. Download   demo version   right now. You can find   deta
    Grid Manual MT5
    Alfiya Fazylova
    4.83 (12)
    Grid Manual是一个交易面板,用于处理订单网格。 该实用程序是通用的,具有灵活的设置和直观的界面。 它不仅可以在亏损方向上设置订单网格,还可以在盈利方向上设置订单网格。 交易者不需要创建和维护订单网格,实用程序会这样做。 打开一个订单就足够了,Grid manual会自动为它创建一个订单网格,并伴随它直到非常关闭。 该实用程序的主要特性和功能: 伴隨以任何方式打開的訂單,包括從移動終端打開的訂單。 適用於兩種類型的網格:“限制”和“停止”。 使用兩種方法計算網格間距:固定和動態(基於 ATR 指標)。 允許您更改未結訂單網格的設置。 顯示圖表上每個網格的盈虧平衡水平。 顯示每個網格的利潤率。 允許您一鍵關閉網格中的盈利訂單。 讓您一鍵關閉每個訂單網格。 允許您對訂單網格應用追踪止損功能。 允許您在訂單網格上應用將訂單網格的止損轉移到盈虧平衡水平的功能。 相對於訂單網格的盈虧平衡水平自動重新排列止盈(僅在限價網格模式下,距離取決於所選的計算類型:“保守”或“激進”)。 最多可管理 20 個訂單網格,每個網格最多可包含 100 個訂單。 計算初始手數時,要考慮入金的大小,不要讓大手
    将信号从任何您是会员的渠道(无需机器人令牌或管理员权限)直接复制到您的 MT5。 它的设计以用户为中心,同时提供您需要的许多功能 该产品采用易于使用且具有视觉吸引力的图形界面。 自定义您的设置并在几分钟内开始使用该产品! 用户指南 + 演示  | MT4版本 | 电报版本 如果您想尝试演示,请参阅用户指南。 Discord To MT5 在策略测试器中不起作用。 Discord MT5 功能 从您是会员的任何频道复制。 无需机器人令牌或聊天 ID 使用风险百分比或固定手数进行交易 排除特定符号 选择复制所有信号或自定义要复制的信号 配置单词和短语以识别所有信号(默认值应适用于 99% 的信号提供商) 配置时间和日期设置以仅在需要时复制信号 设置一次打开的最大交易量 交易和头寸管理 使用信号或自动设置的管理 通过设置每月、每周、每天、每小时或每分钟的最大交易次数,停止过度交易和报复性交易。 支持市价订单和挂单 每日最大利润目标(以美元为单位)以确保头寸并停止过度交易 确保仓位的每日最大利润目标(%) 最大开放交易以限制风险和敞口。 使用 RR、点数或价格自动获取部分内容 使用固
    Adam FTMO MT5
    Vyacheslav Izvarin
    5 (1)
    ADAM EA Special Version for FTMO Please use ShowInfo= false for backtesting ! Our 1st EA created using ChatGPT technology Trade only GOOD and checked PROP FIRMS  Default parameters for Challenge $100,000 Tested on EURUSD and GBPUSD only  Use 15MIN Time Frame Close all deals and Auto-trading  before Weekend at 12:00 GMT+3  Friday For Prop Firms MUST use special Protector  https://www.mql5.com/en/market/product/94362 Signal using ADAM  https://www.mql5.com/en/signals/2190554 --------------------
    -25% discount ($199 -> $149) Advanced trading tool: One click smart orders that execute under your conditions Developed by trader for trading community:  position size calculator (lot size), open position after price action, strategy builder, set and forget trading, mobile notifications... Risk Management -  Risk percentage position size calculator, gain percentage, target risk reward ratio, spread and commissions are included in calculations 7 Advanced order types  - Set and forget trading w
    DrawDown Limiter
    Haidar, Lionel Haj Ali
    5 (17)
    Drawdown Limiter EA You are in the right place if you were searching for Drawdown control, Drawdown limiter, Balance protection, Equity Protection or Daily Drawdown Limit related to Prop Firm, FTMO, or Funded account trading, or if you want to protect your trading account. Have you suffered from controlling your drawdown when trading funded accounts? This EA is meant for you. Prop firms usually set a rule called “Trader Daily Drawdown”, and if it is not respected, you are disqualified.  I am an
    将信号从您所属的任何渠道(包括私人和受限渠道)直接复制到您的 MT5。 该工具在设计时充分考虑了用户的需求,同时提供了管理和监控交易所需的许多功能。 该产品采用易于使用且具有视觉吸引力的图形界面。 自定义您的设置并在几分钟内开始使用该产品! 用户指南 + 演示  |   MT4版本  |   不和谐版本 如果您想尝试演示,请参阅用户指南。 Telegram To MT5 接收器在策略测试器中不起作用! Telegram 至 MT5 功能 一次复制多个通道的信号 从私人和受限频道复制信号 不需要机器人令牌或聊天 ID(如果出于某种原因需要,您仍然可以使用这些) 使用风险百分比或固定手数进行交易 排除特定符号 选择复制所有信号或自定义要复制的信号 配置单词和短语以识别所有信号(默认值应适用于 99% 的信号提供商) 配置时间和日期设置以仅在需要时复制信号 设置一次打开的最大交易量 交易和头寸管理 使用信号或自动设置的管理 通过设置每月、每周、每天、每小时或每分钟的最大交易次数,停止过度交易和报复性交易。 支持市价订单和挂单 每日最大利润目标(以美元为单位)以确保头寸并停止过度交易
    UTM Manager 是一款直观且易于使用的工具,可提供快速高效的交易执行。其中一项突出的功能是“忽略价差”模式,该模式使您能够以蜡烛的价格进行交易,完全忽略价差(例如,允许在 LTF 上交易更高价差的货币对,避免因价差而退出交易)。 UTM Manager 的另一个关键方面是其独特的本地交易复印机,允许在每个经纪商中灵活地运行不同的交易策略和设置,例如不同的 TP、BE 和风险规则。 交易执行: 快速高效的交易执行:通过点击图表上的入场价格和止损价格或使用一键固定止损尺寸功能轻松进入交易。 自动手数计算:根据预定义的风险设置计算手数,当通过拖动修改仓位时会重新计算手数。 能够同时处理一个或多个职位。 止盈和盈亏平衡: 灵活的止盈设置:通过特定的风险回报 (RR) 比率设置灵活的部分止盈水平。 可配置的自动盈亏平衡功能:当达到一定的利润水平时,将止损移至盈亏平衡点。 用户友好的界面: 用户友好的图形界面 (GUI),可轻松保存和加载设置。 内置帮助工具提示来解释其他功能。 职位定制: 仓位定制和调整:经理将所有仓位绘制在图表上,通过拖动线条即可轻松定制和调整。 图表上的按钮: 图
    Trade Assistant 38 in 1
    Makarii Gubaydullin
    4.87 (15)
    多功能工具:超过65个功能,其中包括:手数计算,价格行为,盈亏比,交易管理,供需区域。 演示版   |   用户手册   |  MT5版 任何问题 / 改进意见 / 如果发生了故障或错误    都可以联系我 该实用程序在策略测试器中不起作用:您可以在此处下载 演示版来测 试产品。 Trading functions require permitted auto trading (including on the broker's side) 简化,加快并且自动化你的交易过程。利用这款工具的控制功能就能增强普通交易端的执行力。 建立一笔新的交易:手数 / 风险 / 盈亏计算 1. 手数计算工具 (基于风险规模的交易量计算) 2. 风险计算工具 (基于手数大小的风险额计算) 3. 盈亏比 4. 订单的激活和触发,买入或卖出限价/买入或卖出止损 5. 虚拟的止损/止盈 (隐藏的止损,止盈:交易商不可见) 6.  智能的止损/入场点:当价格柱在收盘时已超越了才入场 (避免无效触发) 7. 隐藏掉挂单 (虚拟的订单) 8. 预订挂单:在市场关闭的时候你也可以下挂单 (适合周末
    Active Lines
    Yury Kulikov
    5 (4)
    Attention: Demo version for review and testing can be downloaded here . It does not allow trading and can only be run on one chart. Active Lines - a powerful professional tool for operations with lines on charts. Active Lines provides a wide range of actions for events when the price crosses lines. For example: notify, open/modify/close a position, place/remove pending orders. With Active Lines you can assign several tasks to one line, for each of which you can set individual trigger conditions
    Hedge Ninja
    Robert Mathias Bernt Larsson
    請務必在 www.Robertsfx.com 加入我們的 Discord 社區,您也可以在 robertsfx.com 購買 EA 無論價格向哪個方向移動,都能贏得勝利 無論價格向哪個方向移動,該機器人都會根據價格的移動方向改變方向,從而獲勝。這是迄今為止最自由的交易方式。 因此,無論它向哪個方向移動,您都會贏(當價格移動到屏幕截圖中的任何一條紅線時,它會以您設置的利潤目標獲勝)。 您面臨的唯一風險是價格是否正在整合(停留在一個地方)。 對沖忍者是一種半自動交易工具,您可以使用下面的對沖設置進行設置。當您告訴它進行交易時,購買或出售它,然後為您處理一切。 每次機器人改變方向時,它都會彌補你之前的損失,所以當你到達任何一條紅線時,你的利潤將是你決定的。 一個好的經驗法則是使用相當高的風險來獲得回報,但是你在這個鏈接上知道如何交易這個機器人的交易秘密。你想要的是價格移動,一旦它開始移動,你就直接走向你的利潤資金:) 設置 ADR / 平均點差 ADR 是平均每日範圍,顯示該工具在一天內通常平均移動多少點。很高興知道這一點,因為您不希望該機器人在點差變得更高
    Profit or Loss Pad
    Vladislav Andruschenko
    4.55 (11)
    在 MetaTrader 5 中使用利润跟踪功能在达到总利润/亏损时平仓。 带尾随的 CloseIfProfitorLoss 您可以启用 虚拟停止(单独订单)   , 分别计算和关闭 买入和卖出头寸 (Separate BUY SELL)   , 关闭和计算 所有交易品种或仅当前交易品种(所有交易品种)   , 启用追踪获利( 追踪 利润) 头寸是根据存款货币、点数、% 和回撤 的价值平仓的。 该应用程序旨在与任何其他 EA 一起用于任何账户或与手动交易结合使用。 MT4版本 详细描述   +DEMO +PDF 如何购买 如何安装     如何获取日志文件     如何测试和优化     Expforex 的所有产品 一旦某些货币对或所有货币对的交易总余额大于或等于设置中指定的值,所有头寸将被关闭并删除订单。 此版本不仅能够在指定的利润水平平仓,而且还可以追踪利润以获得更好的结果。 我们实用程序的主要功能 按所有交易品种的总利润平仓; 按单独交易的总利润结算。 (虚拟模式); 按总利润结算并追踪利润; 按总利润以点数、百分比或货币结算; 所有交易或单独交易均以总亏损结束
    -25% discount ($149 -> $111) Everything for chart Technical Analysis indicator mt5 in one tool Draw your supply demand zone with rectangle and support resistance with trendline and get alerts to mobile phone or email alert -  Risk reward indicator mt5 Video tutorials, manuals, DEMO download   here .   Find contacts on my   profile . 1.   Extended rectangles and trendlines Object will be extended to the right edge of the chart when price will draw new candles on chart. This is rectangle extend
    YuClusters
    Yury Kulikov
    4.93 (43)
    Attention: You can view the program operation in the free version  YuClusters DEMO .  YuClusters is a professional market analysis system. The trader has unique opportunities to analyze the flow of orders, trade volumes, price movements using various charts, profiles, indicators, and graphical objects. YuClusters operates on data based on Time&Sales or ticks information, depending on what is available in the quotes of a financial instrument. YuClusters allows you to build graphs by combining da
    交易面板一键交易。 处理仓位和订单! 通过 图表 或 键盘 进行交易 。 使用我们的交易面板,您只需单击一下即可直接从图表中执行交易,执行交易操作的速度比使用标准 MetaTrader 控件快 30 倍。 参数和函数的自动计算使交易者的交易更加快捷、方便。 图形提示、信息标签和有关贸易交易的完整信息均位于图表 MetaTrader 上。 MT4版本 详细描述   +DEMO +PDF 如何购买 如何安装     如何获取日志文件     如何测试和优化     Expforex 的所有产品 打开和关闭、反转和锁定、部分关闭/Autolot。虚拟/真实止损/止盈/追踪止损/盈亏平衡,订单网格... МetaТrader 5 中主要订单的交易控制面板 :买入、卖出、buystop、buylimit、sellstop、selllimit、平仓、删除、修改、追踪止损、止损、获利。 有 5 个选项卡 可用:头寸、挂单、账户信息、信号和总利润。 Description on English VirtualTradePad在“  MQL5语言最佳图形面板  ”竞赛中 获得二等奖 。 注意
    ManHedger MT5
    Peter Mueller
    5 (2)
    If you'd like to test the product before purchasing please watch the video below. The program doesn't work in the strategy tester! Contact me for user support & advices! If you've bought this EA, you are entitled to a gift!! MT4 Version  With this Expert Advisor, you can: Implement your own Zone Recovery strategy to capitalize on trending markets. Create Grid trading strategies, to profit from ranging markets. Place orders easily and clearly. Display your trades/strategies on the chart. Display
    Ultimate Trailing Stop EA MT5
    BLAKE STEVEN RODGER
    4.57 (7)
    This EA Utility allows you to manage (with advanced filtering) unlimited open orders (manual or EA) with 16 trailing stop methods: fixed, percent, ATR Exit, Chandelier Exit, Moving Average, Candle High Low Exit, Bollinger Bands, Parabolic, Envelope, Fractal, Ichimoku Kijun-Sen, Alligator, Exit After X Minutes or Bars, RSI and Stochastic. The trailing stop can be either real or virtual, and you can exit fully or with a partial close percent on touch or bar close.  Moreover, you can add (overri
    控制您的外匯投資組合。立即查看您的站立位置、工作原理以及導致您疼痛的原因! 此處提供 MT4 版本: https://www.mql5.com/en/market/product/58375 交易經理儀表板旨在讓您一目了然地顯示您當前在外匯市場中的每個頭寸,並使風險管理和貨幣敞口更易於理解。 對於通過多個頭寸或交易網格和籃子策略逐漸進入市場的交易者,這是需要查看的關鍵信息。監控終端中的多個位置通常很難管理。 過度槓桿化和使用低風險:回報是新交易者和一些經驗豐富的交易者面臨的主要問題,交易經理向您展示您對每種貨幣的風險敞口,確保您不會同時進行雙向交易。 特徵: 未平倉交易 - 查看您當前按貨幣對排序的所有未平倉交易。您不僅可以在該貨幣對上看到您的方向偏差,還可以在該貨幣對上運行的每筆交易或頭寸上看到您的方向偏差。 回撤和利潤信息 - 立即查看您交易活躍的貨幣對的回撤或盈利情況。輕鬆識別需要管理的交易。 手數大小 - 查看您在每個貨幣對上的手數以及您進行的交易數量。 風險敞口 - 查看您對每種貨幣的方向偏差,以確保您不會在另一個入場時以相反的方向交易。另請查看您在該貨幣中使用
    作者的更多信息
    1. Why did I develop this series of indicators I found that most traders need to use multiple time frame indicators. They usually switch time frame to see indicators. However, once the timeframe is switched, you cannot see the  corresponding relationship  between  the price in the smaller timeframe  and  the indicator in the larger timeframe . For example: if your price chart is in H1 timeframe, you can see H4, D1 and W1 indicators in H1 timeframe Chart. This is more helpful for you to find t
    Do you think it's a bit cumbersome when you need to switch symbols or timeframes with mouse click? 1. What is this? This is a program that can switch symbols and timeframes with direction keys. Fast switching, very convenient, no mouse click required. For traders, one symbol with multi-timeframe charts are usually added,  you can change symbol on those charts easily. For multi-currency traders, different symbol charts are usually added, you can also change those timeframes easily. I wrote this p
    This product can be used to synchronize multiple Charts, and each Chart can be set to a different sync mode. With this product you can better view and manipulate charts: different time frames for a single Symbol, the same time frame for multiple Symbols... and more. PS: The link below is the FreeDemo product, you can use it on EURUSD/XUAUSD/USDCNH symbol: https://www.mql5.com/en/market/product/38557 Feature: Chart settings  can be synchronized, including : background, indentation, size, etc.
    1.这是什么: 下载Market Watch中所有的Symbol数据到系统。PS:不是把数据输出到文档。 2.为什么要用这个: 如果系统中没有数据:网络链接不好的时候,用MT5看一个Symbol需要等待很长时间;在不同Symbol或不同TimeFrame切换,如果系统没有数据也需要等待很久;如果进行长时间回测,系统没有数据,需要下载很长时间。 所以提前把历史数据下载到系统中,能提高工作效率。 3.怎么使用: parameters: input bool bool_usualtimeframe=true; //true-系统默认TimeFrames; || false-所有的TimeFrames. input bool bool_allSymbol=true; //true-Market Watch中所有品种; || false-根据你的输入 input string input_Symbol=NULL; //上面参数为false时,输入你的Symbol名称 input datetime time_Start=D'2017.01.01'; //默认数据下载开始时间 input int s
    1.这是什么         上涨波动和下降波动是不一样的,无论是学术研究还是实际检验都说明了这一点。         原始的ATR指标是把上涨波动和下降波动放在一起进行计算。本指标则是把上涨波动和下降波动分开进行计算,这样能更好的帮助你研究市场。 2.指标说明         本指标的计算有两种模式,如下表所示: 0 1 2 3 4 5 波动方向 + - + + - + TR 15 20 17 5 16 8 原始ATR (15+20+17+5+16+8)/6=13.5 模式1 不以0填充位置,周期数改变 模式1上涨TR 15 17 5 8 模式1下跌TR 20 16 模式1上涨ATR (15+17+5+8)/4=11.25 模式1下跌ATR (20+16)/2=18 模式2 以0填充位置,周期数不变 模式2上涨TR 15 0 17 5 0 8 模式2下跌TR 0 20 0 0 16 0 模式2上涨ATR (15+0+17+5+0+8)/6=7.5 模式2下跌ATR (0+20+0+0+16+0)/6=6         如上表。比如周期为6的序列中,有4个上涨2个下跌。模式
    Do you think it's a bit cumbersome when you need to switch symbols or timeframes with mouse click? 1. What is this? This is a program that can switch symbols and timeframes with direction keys. Fast switching, very convenient, no mouse click required. For traders, one symbol with multi-timeframe charts are usually added,  you can change symbol on those charts  easily . For multi-currency traders, different symbol charts are usually added, you can also change those timeframes easily. I wrote thi
    According to trading experience: Some symbols are easy to reverse on certain days, such as Monday, or afternoon, and so on. So comparing the current price with the corresponding historical moment price is valuable. If the price coordinate system uses a logarithmic price, you will get a lot of valuable information. 1. What is this? This program can convert the symbol price and add it to your Chart. You can compare it with your major chart. The DEMO version Link: https://www.mql5.com/en/market/p
    What is this: Violent trading: means sending a large number of orders to your brokerage server,  it can conduct a stress test of the trading. In this program you can run a variety of trading tests.  Now you can trade at high speed, For example 1000 orders in an instant. The Demo version's link:  https://www.mql5.com/en/market/product/38431/ Why to use: Whether manual trading or EA trading,  the status of the broker server is very important. So it is beneficial to conduct a trading stress test on
    1. Why did I develop this series of indicators I found that most traders need to use multiple time frame indicators. They usually switch time frame to see indicators. However, once the timeframe is switched, you cannot see the  corresponding relationship  between  the price in the smaller timeframe  and  the indicator in the larger timeframe . For example: if your price chart is in H1 timeframe, you can see H4, D1 and W1 indicators in H1 timeframe Chart. This is more helpful for you to find t
    1. Why did I develop this series of indicators I found that most traders need to use multiple time frame indicators. They usually switch time frame to see indicators. However, once the timeframe is switched, you cannot see the  corresponding relationship  between  the price in the smaller timeframe  and  the indicator in the larger timeframe . For example: if your price chart is in H1 timeframe, you can see H4, D1 and W1 indicators in H1 timeframe Chart. This is more helpful for you to find t
    1. Why did I develop this series of indicators I found that most traders need to use multiple time frame indicators. They usually switch time frame to see indicators. However, once the timeframe is switched, you cannot see the  corresponding relationship  between  the price in the smaller timeframe  and  the indicator in the larger timeframe . For example: if your price chart is in H1 timeframe, you can see H4, D1 and W1 indicators in H1 timeframe Chart. This is more helpful for you to find t
    1. Why did I develop this series of indicators I found that most traders need to use multiple time frame indicators. They usually switch time frame to see indicators. However, once the timeframe is switched, you cannot see the  corresponding relationship  between  the price in the smaller timeframe  and  the indicator in the larger timeframe . For example: if your price chart is in H1 timeframe, you can see H4, D1 and W1 indicators in H1 timeframe Chart. This is more helpful for you to find t
    1. Why did I develop this series of indicators I found that most traders need to use multiple time frame indicators. They usually switch time frame to see indicators. However, once the timeframe is switched, you cannot see the  corresponding relationship  between  the price in the smaller timeframe  and  the indicator in the larger timeframe . For example: if your price chart is in H1 timeframe, you can see H4, D1 and W1 indicators in H1 timeframe Chart. This is more helpful for you to find t
    1. Why did I develop this series of indicators I found that most traders need to use multiple time frame indicators. They usually switch time frame to see indicators. However, once the timeframe is switched, you cannot see the  corresponding relationship  between  the price in the smaller timeframe  and  the indicator in the larger timeframe . For example: if your price chart is in H1 timeframe, you can see H4, D1 and W1 indicators in H1 timeframe Chart. This is more helpful for you to find t
    1. Why did I develop this series of indicators I found that most traders need to use multiple time frame indicators. They usually switch time frame to see indicators. However, once the timeframe is switched, you cannot see the  corresponding relationship  between  the price in the smaller timeframe  and  the indicator in the larger timeframe . For example: if your price chart is in H1 timeframe, you can see H4, D1 and W1 indicators in H1 timeframe Chart. This is more helpful for you to find t
    1. Why did I develop this series of indicators I found that most traders need to use multiple time frame indicators. They usually switch time frame to see indicators. However, once the timeframe is switched, you cannot see the  corresponding relationship  between  the price in the smaller timeframe  and  the indicator in the larger timeframe . For example: if your price chart is in H1 timeframe, you can see H4, D1 and W1 indicators in H1 timeframe Chart. This is more helpful for you to find t
    1. Why did I develop this series of indicators I found that most traders need to use multiple time frame indicators. They usually switch time frame to see indicators. However, once the timeframe is switched, you cannot see the  corresponding relationship  between  the price in the smaller timeframe  and  the indicator in the larger timeframe . For example: if your price chart is in H1 timeframe, you can see H4, D1 and W1 indicators in H1 timeframe Chart. This is more helpful for you to find t
    1. Why did I develop this series of indicators I found that most traders need to use multiple time frame indicators. They usually switch time frame to see indicators. However, once the timeframe is switched, you cannot see the  corresponding relationship  between  the price in the smaller timeframe  and  the indicator in the larger timeframe . For example: if your price chart is in H1 timeframe, you can see H4, D1 and W1 indicators in H1 timeframe Chart. This is more helpful for you to find t
    1. Why did I develop this series of indicators I found that most traders need to use multiple time frame indicators. They usually switch time frame to see indicators. However, once the timeframe is switched, you cannot see the  corresponding relationship  between  the price in the smaller timeframe  and  the indicator in the larger timeframe . For example: if your price chart is in H1 timeframe, you can see H4, D1 and W1 indicators in H1 timeframe Chart. This is more helpful for you to find t
    1. Why did I develop this series of indicators I found that most traders need to use multiple time frame indicators. They usually switch time frame to see indicators. However, once the timeframe is switched, you cannot see the  corresponding relationship  between  the price in the smaller timeframe  and  the indicator in the larger timeframe . For example: if your price chart is in H1 timeframe, you can see H4, D1 and W1 indicators in H1 timeframe Chart. This is more helpful for you to find t
    1. Why did I develop this series of indicators I found that most traders need to use multiple time frame indicators. They usually switch time frame to see indicators. However, once the timeframe is switched, you cannot see the  corresponding relationship  between  the price in the smaller timeframe  and  the indicator in the larger timeframe . For example: if your price chart is in H1 timeframe, you can see H4, D1 and W1 indicators in H1 timeframe Chart. This is more helpful for you to find t
    1. Why did I develop this series of indicators I found that most traders need to use multiple time frame indicators. They usually switch time frame to see indicators. However, once the timeframe is switched, you cannot see the  corresponding relationship  between  the price in the smaller timeframe  and  the indicator in the larger timeframe . For example: if your price chart is in H1 timeframe, you can see H4, D1 and W1 indicators in H1 timeframe Chart. This is more helpful for you to find t
    1. Why did I develop this series of indicators I found that most traders need to use multiple time frame indicators. They usually switch time frame to see indicators. However, once the timeframe is switched, you cannot see the  corresponding relationship  between  the price in the smaller timeframe  and  the indicator in the larger timeframe . For example: if your price chart is in H1 timeframe, you can see H4, D1 and W1 indicators in H1 timeframe Chart. This is more helpful for you to find t
    1. Why did I develop this series of indicators I found that most traders need to use multiple time frame indicators. They usually switch time frame to see indicators. However, once the timeframe is switched, you cannot see the  corresponding relationship  between  the price in the smaller timeframe  and  the indicator in the larger timeframe . For example: if your price chart is in H1 timeframe, you can see H4, D1 and W1 indicators in H1 timeframe Chart. This is more helpful for you to find t
    1. Why did I develop this series of indicators I found that most traders need to use multiple time frame indicators. They usually switch time frame to see indicators. However, once the timeframe is switched, you cannot see the  corresponding relationship  between  the price in the smaller timeframe  and  the indicator in the larger timeframe . For example: if your price chart is in H1 timeframe, you can see H4, D1 and W1 indicators in H1 timeframe Chart. This is more helpful for you to find t
    1. Why did I develop this series of indicators I found that most traders need to use multiple time frame indicators. They usually switch time frame to see indicators. However, once the timeframe is switched, you cannot see the  corresponding relationship  between  the price in the smaller timeframe  and  the indicator in the larger timeframe . For example: if your price chart is in H1 timeframe, you can see H4, D1 and W1 indicators in H1 timeframe Chart. This is more helpful for you to find t
    1. Why did I develop this series of indicators I found that most traders need to use multiple time frame indicators. They usually switch time frame to see indicators. However, once the timeframe is switched, you cannot see the  corresponding relationship  between  the price in the smaller timeframe  and  the indicator in the larger timeframe . For example: if your price chart is in H1 timeframe, you can see H4, D1 and W1 indicators in H1 timeframe Chart. This is more helpful for you to find t
    筛选:
    Аврора
    84
    Аврора 2021.10.15 03:47 
     

    用户没有留下任何评级信息

    回复评论
    版本 1.4 2022.06.26
    Increase computing speed.
    版本 1.3 2021.11.26
    fix some bug.
    版本 1.2 2021.11.26
    Added functionality for adaptive brokers to automatically adjust data time zones.
    add the parameters:
    bool bool_BrokerAuto = true; // Whether the broker automatically adjusts the time zone, usually True.
    int Inp_utc = 3; // if the above is true, summer utc; if false summer or winter utc.
    版本 1.1 2021.10.13
    reset default parameters