• Overview
  • Reviews (1)
  • Comments

Prof MACD

5

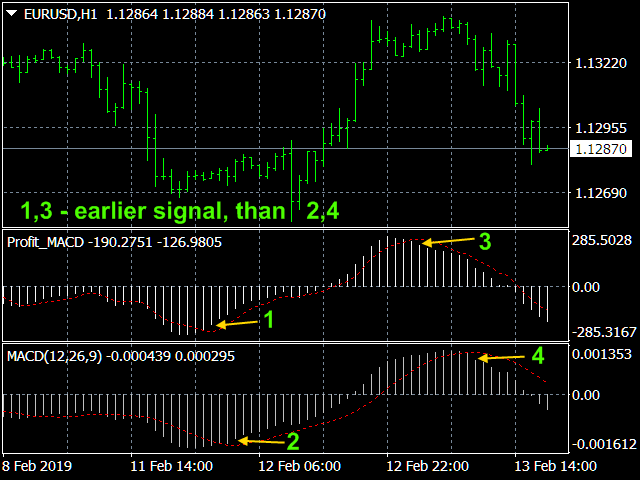
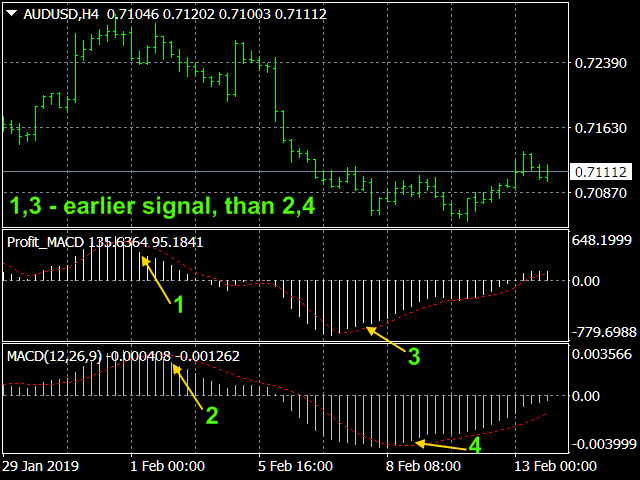
          I present an indicator for professionals. Prof MACD is very similar to classic MACD in appearance and its functions. However, Prof MACD is based on completely new algorithms (for example, it has only one averaging period) and is more robust, especially on small timeframes, since it filters random price walks. The classic MACD indicator (Moving Average Convergence / Divergence) is a very good indicator following the trend, based on the ratio between two moving averages, namely the EMA with periods of 12 and 26, i.e.

MACD = EMA(CLOSE, 12) - EMA(CLOSE, 26),
and the signal line - 9-period moving average from the indicator itself

SIGNAL = SMA(MACD, 9).

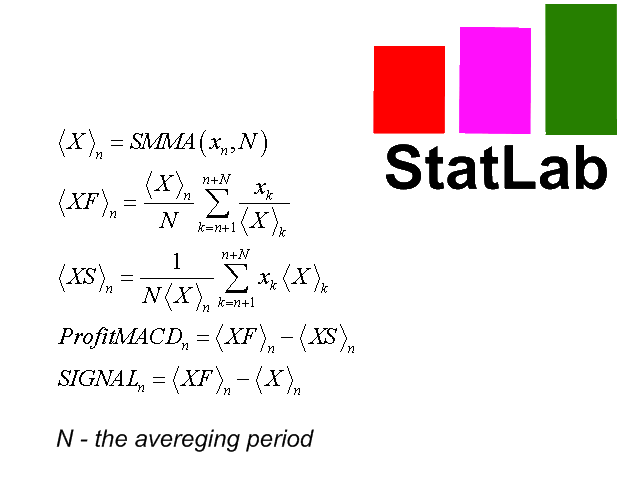
         The algorithm of the indicator Prof MACD is much more complicated and is shown in the last screenshot. Prof MACD, like the classic MACD, is most effective when the market fluctuates with a large amplitude in the trading corridor. 

       The indicator has all kinds of alerts.

Prof MACD  MT4  


Benefits of Prof MACD.

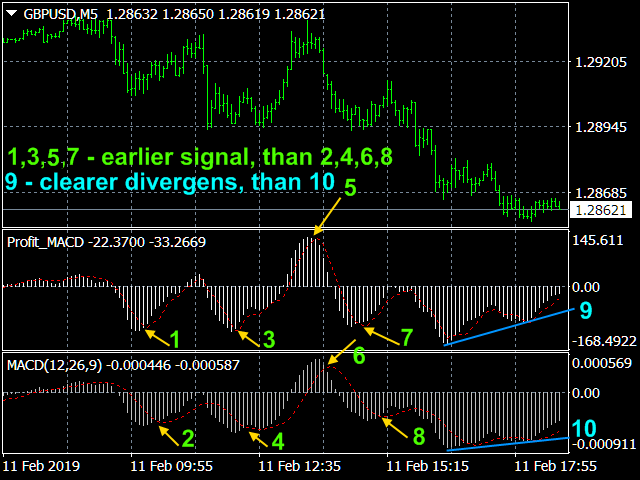
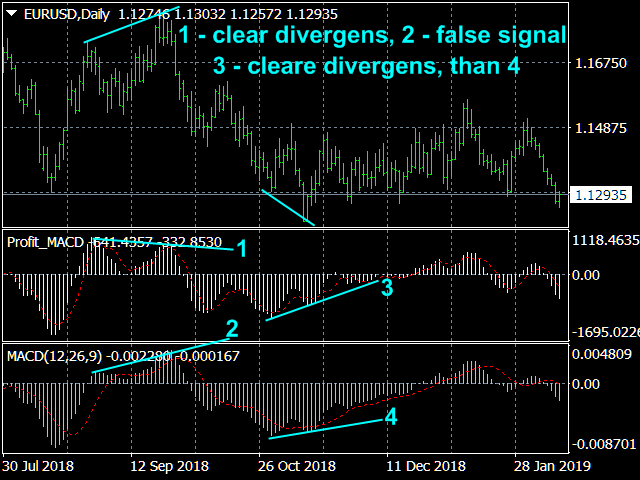
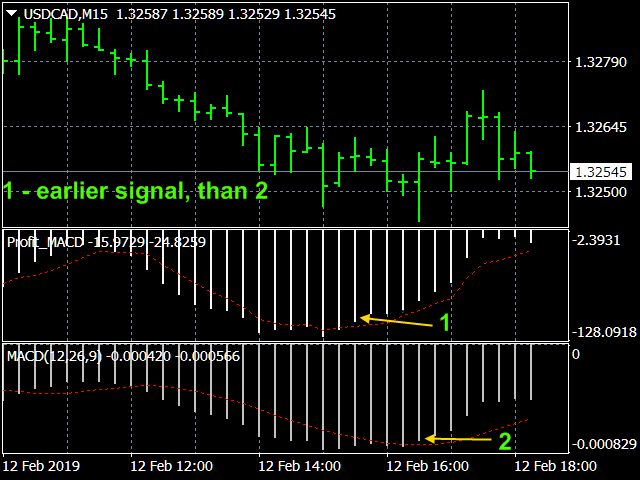
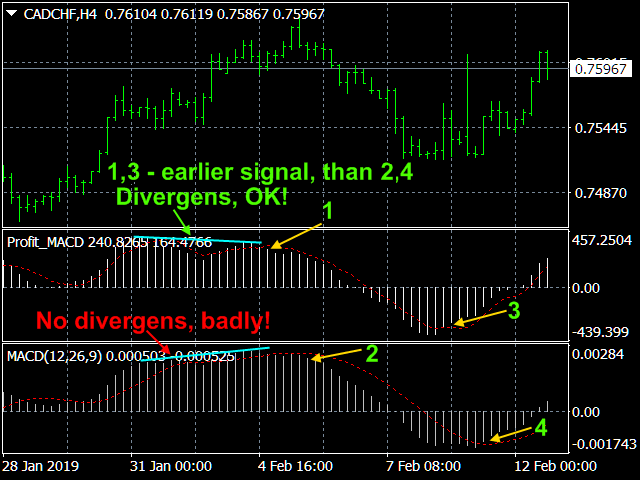
  1. Classic MACD gives a lot of false signals on small timeframes, providing good results on weekly and daily charts. Prof MACD works on hour timeframes and can be quite accurate even on M5, which allows it to be used for scalping.

  2.  In addition, the Prof MACD indicator has less lag.

  3. According to the value of the main line Prof MACD, presented in points, you can, if there is a signal, set the position of Take Profit when playing on the oscillations inside the channel. And when playing by the trend at this value, you can set the value of Stop Loss.


Prof MACD signals.

          The signals for these indicators are: (1) intersections, (2) overbought / oversold conditions, and (3) divergences.

    1. Intersections .

            If the main line of the indicator falls below the signal line, then you should sell; if it rises above the signal line, buy.  As signals to buy / sell, the intersection of the main line of the zero mark up / down is also used.

    2. Overbought / Oversold  conditions.

             If the indicator is very high, the price is too high and will soon return to a more realistic level.

    3. Divergences .

            If a higher price high is not confirmed by a higher high on the indicator (bearish divergence) or vice versa, a lower minimum is not confirmed by a minimum on the indicator (bullish divergence), this means the end of the trend and the possible reversal of the trend.  Discrepancies are most significant if they form in overbought / oversold areas. 


Indicator settings.

  • Price type  - applied price. Values: Close price (default), Open price, High price, Low price, Median price ((high + low)/2), Typical price ((high + low + close)/3),    Weighted  price  ((high + low + 2*close)/4). 
  • The averaging period    -  averaging period. Values: any integer   (9 default).
  • Main line thickness  -  Values: any integer   (1 default).
  • Signal line thickness Values: any integer   (1 default).
  • Data in points of possible profit? -  Show data in points of possible profit? Values:  true (default), false
  • The Signal method Type of trading signal alert. Values:  No, Send alert, Print (in expert), Comment (in chart), Sound + Print, Sound + Comment, Sound, Push + Comment, Push,  Mail + Comment, Mail.
  • Number of calculated bars - Values: any integer   (300 default).


Reviews 1
Malcolm David Parker
470
Malcolm David Parker 2021.04.22 10:42 
 

I find this indicator very useful for my manual trading

Recommended products
Fibonacci sequence is defined by integer sequence: 0, 1, 1, 2, 3, 5, 8, 13, 21, 34, 55, 89, 144, ... By definition, it starts from 0 and 1, the next number is calculated as a sum of two previous numbers. Instead of the standard moving average, the indicator uses the following calculation of average price: Bar0 + Bar1 + Bar2 + Bar3 + Bar5 + Bar8 + Bar13 + Bar21 + ... Input parameters: fiboNum - numbers in the following integer sequence for Fibo Moving Average 1. 5 on default. fiboNum2 - numbers i
Description The base of this indicator is an ZigZag algorithm based on ATR and Fibo retracement. The ZigZag can be drawn like a classic ZigZag or like Arrows or needn't be drawn at all. This indicator is not redrawing in sense that the ZigZag's last shoulder is formed right after the appropriate conditions occur on the market. The shoulder doesn't change its direction afterwards (can only continue). There are some other possibilities to show advanced information in this indicator: Auto Fibo on
Fibonacci sequence is defined by integer sequence: 0, 1, 1, 2, 3, 5, 8, 13, 21, 34, 55, 89, 144, ... By definition, it starts from 0 and 1, the next number is calculated as a sum of two previous numbers. Instead of the standard moving average, the indicator uses the following calculation of average price: Bar0 + Bar1 + Bar2 + Bar3 + Bar5 + Bar8 + Bar13 + Bar21 + ... This indicator shows 2 moving Fibonacci lines and arrows when 2 these lines crossing each other. If an Aqua line is crossing a Yell
This Automatic support/resistance indicator calculates various peaks and troughs of the price action, identifies relevant levels and draws support and resistance automatically. It uses the built-in "ZigZag" indicator in Metatrader as a data source hence, very much accurate indicator.  The support and resistance lines are contineusely updated as new levels and formed. The indicator has only 5 parameters to set, and mostly it can be used with the default values:  The description of the settings is
Free automatic Fibonacci is an indicator that automatically plots a Fibonacci retracement based on the number of bars you select on the BarsToScan setting in the indicator. The Fibonacci is automatically updated in real time as new highest and lowest values appears amongst the selected bars. You can select which level values to be displayed in the indicator settings. You can also select the color of the levels thus enabling the trader to be able to attach the indicator several times with differe
FREE
Renko System
Marco Montemari
This indicator can be considered as a trading system. It offers a different view to see the currency pair: full timeless indicator, can be used for manual trading or for automatized trading with some expert advisor. When the price reaches a threshold a new block is created according to the set mode. The indicator beside the Renko bars, shows also 3 moving averages. Features renko mode median renko custom median renko 3 moving averages wicks datetime indicator for each block custom notificatio
This is Gekko's Cutomized Cutomized Average Directional Index (ADX), a customized version of the famous ADX indicator. Use the regular ADX and take advantage two entry signals calculations and different ways of being alerted whenever there is potential entry or exit point. Inputs Period: Period for the ADX calculation; PlotSignalType: How will the indicator calculate entry (swing) signals: 1- ShowSwingsOnTrendLevel : Show Signals for Trend Confirmation Swings; 2- ShowSwingsOnTrendLevelDirectio
Donchian Channel DC is the indicator of Donchian Channels, that plots maximum and minimum values of a specific period, besides mean value line. It´s possible to configure simple period for analysis and the indicator will plot all three values. You can trade with this indicator as trend or reversal, according to each strategy. Do not let to test others indicators as soon as others expert advisors.
This is the spike indicator , determining the highest high and lowest lows of price in the given period ,  it is also a zigzag indicator , to it may recalculate the values  or repaint if a new higher high or lower low forms in that given period,so beware How ever the indicator can be very powerful when used with other technical indicators for entry confirmation  Be sure to check out some of my other premium products   
The Envelopes indicator determines the presence of a trend or flat. It has 3 types of signals, shows the probable retracement levels and levels of the possible targets. The Fibonacci coefficients are used in the indicator's calculations. Signals   (generated when touching the lines or rebounding from lines): Trend   - the middle line of the Envelopes has a distinct inclination; the lines below the channel's middle line are used for buy trades, the lines above the middle line and the middle line
Introduction to X3 Chart Pattern Scanner X3 Cherart Pattern Scanner is the non-repainting and non-lagging indicator detecting X3 chart patterns including Harmonic pattern, Elliott Wave pattern, X3 patterns, and Japanese Candlestick patterns. Historical patterns match with signal patterns. Hence, you can readily develop the solid trading strategy in your chart. More importantly, this superb pattern scanner can detect the optimal pattern of its kind. In addition, you can switch on and off individu
The indicator builds current quotes, which can be compared with historical ones and on this basis make a price movement forecast. The indicator has a text field for quick navigation to the desired date. Options: Symbol - selection of the symbol that the indicator will display; SymbolPeriod - selection of the period from which the indicator will take data; IndicatorColor - indicator color; Inverse - true reverses quotes, false - original view; Next are the settings of the te
This is a well-known ZigZag indicator. But it differs by the fact that its plot is based on values of the middle line which is set by a user. It can display Andrews’ Pitchfork and standard or Bobokus Fibo levels. NO REPAINTING. Parameters Period МА — middle line period. Default value is 34. Minimum value is 4. Maximum value is set at your discretion. Used to calculate price — type of price used for the midline calculations. The averaging method — type of smoothing for the middle line. Turning
Renko Plus
Eadvisors Software Inc.
With Renko Plus you can use the features in the Indicator functionality, just add it to the Metatrader5 chart.             The Renko chart is a type of chart, developed by the Japanese, that is constructed using price movement rather than standardized prices and time intervals like most charts. It is believed to be named after the Japanese word for bricks, "renga", as the graphic looks like a series of bricks.             A new brick is created when the price moves a specified p
The indicator is the advanced form of the MetaTrader 4 standard Fibonacci tool. It is unique and very reasonable for serious Fibonacci traders. Key Features Drawing of Fibonacci retracement and expansion levels in a few seconds by using hotkeys. Auto adjusting of retracement levels once the market makes new highs/lows. Ability to edit/remove any retracement & expansion levels on chart. Auto snap to exact high and low of bars while plotting on chart. Getting very clear charts even though many ret
VolumeDeltaWaves
Stanislav Korotky
5 (1)
This indicator is an extended implementation of Weis waves. It builds Weis waves on absolute volumes (which is the classical approach) or delta of volumes (unique feature) using different methods of wave formation and visualization. It works with real volumes, if available, or with tick volumes otherwise, but also provides an option to use so called "true volume surrogates", as an artificial substitution for missing real volumes (for example, for Forex symbols), which was introduced in correspo
Real Trend Zigzag PRO   shows the real trend of a market, u nlike the default Zigzag indicator. It calculates the trend in real time and shows green lines for upwards trends, red lines for downward trends and blue lines for no trends.  Regarding the old slogan "the trend is your friend" it helps you to decide if should open a buy or sell position. The PRO version is a multi timeframe zigzag (MTF). Means, it shows the trend of the current timeframe as well as the trend of a higher or lower time.
This indicator will show you the TP and SL Values (in that currency) that you already set  for every orders on the charts  ( closed to the transaction/order line)  that will help you a lot to estimated your profit and loss for every order.    And it also show you the PIPs values too.  the shown format  is      " Currency Values of our Profit or Loss /  PIPs values ".    The TP Value will be shown in Green Color and  the SL Value  will be shown in Red Color.  For any question or more information,
Magic EA MT5
Kyra Nickaline Watson-gordon
Magic EA is an Expert Advisor based on Scalping, Elliot Waves and with filters such as RSI, Stochastic and 3 other strategies managed and decided with the robot smartly. Large number of inputs and settings are tested and optimized and embedded in the program thus inputs are limited and very simple. Using EA doesn't need any professional information or Forex Trading Knowledge. EA can trade on all symbols and all time frames, using special and unique strategies developed by the author. The EA
Follow The Line MT5
Oliver Gideon Amofa Appiah
4.4 (30)
This indicator obeys the popular maxim that: "THE TREND IS YOUR FRIEND" It paints a GREEN line for BUY and also paints a RED line for SELL. (you can change the colors). It gives alarms and alerts of all kinds. IT DOES NOT REPAINT and can be used for all currency pairs and timeframes. Yes, as easy and simple as that. Even a newbie can use it to make great and reliable trades. NB: For best results, get my other premium indicators for more powerful and reliable signals. Get them here: https://www.m
FREE
Pivot MT5
Dmitrij Isaenko
The indicator draws daily support and resistance lines on the chart, as well as the Pivot level (reversal level). Adapted to work in MT5 The standard timeframe for calculating support and resistance levels is D1. You can choose other timeframes according to your strategy (for example, for M1-M15, the optimal timeframe for calculations is H1) The function for calculating support and resistance levels has been updated; in this calculation option, fibonacci levels are taken into account, res
Hunter trend
Yaroslav Varankin
Hunter Trend: Arrow Indicator for Binary Options Trading Hunter Trend is an arrow indicator designed for trading binary options (turbo options) on the M1 timeframe, allowing for short-term trading opportunities. How to Trade with this Tool: Signals may appear when a candlestick forms. Once such a signal appears, wait for the closure of that candlestick. Upon the opening of a new candlestick, open a trade for 1-2 candlesticks in the indicated direction. In this case, for 1-2 minutes. A blue dot
The Trend Complete indicator is a signal indicator and has interesting properties. It should be taken into account that this indicator reflects extremes and should be used as an additional one, and another instrument should be used for the entry point. Searches for and displays pivot points on the price chart. Trend indicators are one of the main tools for analyzing trends in the Forex market. The indicator is able to transmit all types of signals to the user: messages, E-mail and Push! The g
Order Book, known also as Market Book, market depth, Level 2, - is a dynamically updated table with current volumes of orders to buy and to sell specific financial instument at price levels near Bid and Ask. MetaTrader 5 provides the means for receiving market book from your broker, but in real time only, without access to its history. The indicator OrderBook Cumulative Indicator accumulates market book data online and visualizes them on the chart. In addition, the indicator can show the market
Intra Daily Range
Mahmoud Helmy Sedik Mohamed Mansour
The Intra Daily Range Projection indicator forecasts the current day’s price range on the basis of the previous day data. All calculations are based on the book “New Science of Technical Analysis” by Thomas R. DeMark. When you're analyzing investments, the trading range is a valuable analytical tool. The average trading range is the average distance between the high and the low over a specified period of time. You can calculate the average high-low range on a piece of paper, a spreadsheet, o
Double HMA MTF for MT5
Pavel Zamoshnikov
5 (2)
This is an advanced multi-timeframe version of the popular Hull Moving Average (HMA) Features Two lines of the Hull indicator of different timeframes on the same chart. The HMA line of the higher timeframe defines the trend, and the HMA line of the current timeframe defines the short-term price movements. A graphical panel with HMA indicator data from all timeframes at the same time . If the HMA switched its direction on any timeframe, the panel displays a question or exclamation mark with a tex
Green Power
Ignacio Agustin Mene Franco
Black Card Pack indicator 5/3 Green power It has the high and low breakout strategy giving the signal with the red or green dot the red dot for short and the green dot for long , perfect for forex markets and synthetic index markets, works for all seasons It is used for scalping and intraday! Ideal for Crash and boom markets!! Volatilitys y jumps !! Micro y macro en forex !
Time And Sales Delta
Evgeny Shevtsov
5 (2)
The indicator displays the delta and the cumulative delta based on the "Time & Sales" deals list data. In addition to the standard timeframes, the indicator displays data regarding the seconds timeframes (S5, S10, S15, S20, S30) to choose from. Using the rectangle, user can select an arbitrary area in the indicator subwindow to view the ratio of the volumes of deals of buyers and sellers within this area. Indicator features: The indicator works correctly only on those trading symbols for whi
Half ma
Artem Svistunov
The Half ma arrow indicator for the MetaTrader 5 trading terminal is a simple but effective tool that gives a signal about a change in the current trend. The Half ma indicator looks like a solid dynamic line that changes color at the points where the trend changes. At these points, the indicator draws arrows of the corresponding color and direction.The Half ma arrow indicator for the MT5 terminal is not an independent source of input signals. It will be most effective to use it as a trend filte
FibExtender
Syed Oarasul Islam
This Indicator draws Fibonacci Extension levels in two different ways. You can select whether to draw Fibonacci Extension levels based on your favourite ZigZag settings or you can let the indicator to draw Fibonacci Extension  level based on given number of Bars or Candles.  You can also set Mobile and Email notification for your favourite Extension  levels individually. With this indicator you will not have to feel lonely as the it can generate Voice alerts, which will keep you focused on your
Buyers of this product also purchase
Atomic Analyst MT5
Issam Kassas
4.22 (9)
First of all Its worth emphasizing here that this Trading Indicator is   Non-Repainting ,   Non-Redrawing   and   Non-Lagging   Indicator, Which makes it ideal from both manual and robot trading.  The Atomic Analyst  is a PA Price Action Indicator that uses Strength and Momentum of the price to find a better edge in the market. Equipped with an AI filter which help remove noises and false signals, and Increase Trading Potential. Using Multiple layers of complex Indicators, the Atomic Analyst
First of all Its worth emphasizing here that this Trading System is Non-Repainting , Non-Redrawing and Non-Lagging Indicator , Which makes it ideal from both manual and robot trading .  The Smart Trend Trading System MT5 is a comprehensive trading solution tailored for new and experienced traders . It combines over 10 premium indicators and features more than 7 robust trading strategies , making it a versatile choice for diverse market conditions . Trend Following Strategy : Provides precise ent
Quantum Trend Sniper
Bogdan Ion Puscasu
5 (36)
Introducing   Quantum Trend Sniper Indicator , the groundbreaking MQL5 Indicator that's transforming the way you identify and trade trend reversals! Developed by a team of experienced traders with trading experience of over 13 years,   Quantum Trend Sniper Indicator   is designed to propel your trading journey to new heights with its innovative way of identifying trend reversals with extremely high accuracy. ***Buy Quantum Trend Sniper Indicator and you could get Quantum Breakout Indicator fo
Trend Screener Pro MT5
STE S.S.COMPANY
4.89 (61)
Unlock the Power of  Trends trading with Trend Screener Indicator: Your Ultimate Trend Trading Solution powered by fuzzy logic and Multi-currencies System ! Elevate your trend trading with Trend Screener, the revolutionary trend indicator powered by   fuzzy logic.  It is a powerful trend-following indicator that combines over  13 premium tools and features and 3 trading strategies  , making it a versatile choice to   make your Metatrader a Trend Analyzer. LIMITED TIME OFFER : Trend Screener Indi
Advanced Supply Demand MT5
Bernhard Schweigert
4.53 (15)
Best Solution for any Newbie or Expert Trader! This indicator is a unique, high quality and affordable trading tool because we have incorporated a number of proprietary features and a new formula. With this update, you will be able to show double timeframe zones. You will not only be able to show a higher TF but to show both, the chart TF, PLUS the higher TF: SHOWING NESTED ZONES. All Supply Demand traders will love it. :) Important Information Revealed Maximize the potential of Advanced Suppl
RelicusRoad Pro MT5
Relicus LLC
4.81 (21)
How many times have you bought a trading indicator with great back-tests, live account performance proof with fantastic numbers and stats all over the place but after using it, you end up blowing your account? You shouldn't trust a signal by itself, you need to know why it appeared in the first place, and that's what RelicusRoad Pro does best! NOW $147 (increasing to $499 after a few updates) - UNLIMITED ACCOUNTS (PCs or MACs) **  User Manual + Strategies + Training Videos + Private Group with
First of all Its worth emphasizing here that this Trading Tool is Non Repainting , Non Redrawing and Non Lagging Indicator , Which makes it ideal for professional trading . The Smart Price Action Concepts Indicator is a very powerful tool for both new and experienced traders . It packs more than 20 useful indicators into one , combining advanced trading ideas like Inner Circle Trader Analysis and Smart Money Concepts Trading Strategies . This indicator focuses on Smart Money Concepts , prov
Introducing   Quantum Breakout PRO , the groundbreaking MQL5 Indicator that's transforming the way you trade Breakout Zones! Developed by a team of experienced traders with trading experience of over 13 years,   Quantum Breakout PRO   is designed to propel your trading journey to new heights with its innovative and dynamic breakout zone strategy. Quantum Breakout Indicator will give you signal arrows on breakout zones with 5 profit target zones and stop loss suggestion based on the breako
FX Power MT5 NG
Daniel Stein
5 (4)
Trading GOLD, and currencies, with the dog walk strategy  - super smart Trading GOLD, and currencies, with the breakout strategy  - super easy Visit our all-new   Stein Investments Welcome Page   to get the latest information, updates and trading strategies. FX Power MT5 NG  is the next generation of our long-time very popular currency strength meter, FX Power.  And what does this next-generation strength meter offer? Everything you have loved about the original FX Power  PLUS GOLD/XAU st
AW Trend Predictor MT5
AW Trading Software Limited
4.76 (54)
The combination of trend and breakdown levels in one system. An advanced indicator algorithm filters market noise, determines the trend, entry points, as well as possible exit levels. Indicator signals are recorded in a statistical module, which allows you to select the most suitable tools, showing the effectiveness of the signal history. The indicator calculates Take Profit and Stop Loss marks. Manual and instruction ->  HERE  / MT4 version ->  HERE How to trade with the indicator:  Trading wit
FX Volume MT5
Daniel Stein
4.94 (17)
Visit our all-new   Stein Investments Welcome Page   to get the latest information, updates and trading strategies. FX Volume is the FIRST and ONLY volume indicator that provides a REAL insight into the market sentiment from a broker's point of view. It provides awesome insights into how institutional market participants, like brokers, are positioned in the Forex market, much faster than COT reports. Seeing this information directly on your chart is the real game-changer and breakthrough solut
Top indicator for MT5   providing accurate signals to enter a trade without repainting! It can be applied to any financial assets:   forex, cryptocurrencies, metals, stocks, indices .  Watch  the video  (6:22) with an example of processing only one signal that paid off the indicator! MT4 version is here It will provide pretty accurate trading signals and tell you when it's best to open a trade and close it. Most traders improve their trading results during the first trading week with the help of
TPSproTREND PrO MT5
Roman Podpora
5 (5)
TPSpro TRENDPRO  - is a trend indicator that automatically analyzes the market and provides information about the trend and each of its changes, as well as giving signals for entering trades without redrawing! The indicator uses each candle, analyzing them separately. referring to different impulses - up or down impulse. Exact entry points into transactions for currencies, crypto, metals, stocks, indices!  -  Version MT4                  DETAILED DESCRIPTION        /       TRADING SETUPS       
Bill Williams Advanced
Siarhei Vashchylka
5 (3)
Bill Williams Advanced is designed for automatic chart analysis using Bill Williams' "Profitunity" system. The indicator analyzes four timeframes at once. Manual (Be sure to read before purchasing) Advantages 1. Automatically analyzes the chart using the "Profitunity" system of Bill Williams. The found signals are placed in a table in the corner of the screen. 2. Equipped with a trend filter based on the Alligator indicator. Most of the system signals are recommended to be used only accordi
ICT, SMC, SMART MONEY CONCEPTS, SMART MONEY, Smart Money Concept, Support and Resistance, Trend Analysis, Price Action, Market Structure, Order Blocks, BOS/CHoCH,   Breaker Blocks ,  Momentum Shift,   Supply&Demand Zone/Order Blocks , Strong Imbalance,   HH/LL/HL/LH,    Fair Value Gap, FVG, Inversion FVG, IFVG,  Premium  &   Discount   Zones, Fibonacci Retracement, OTE, Buy Side Liquidity, Sell Side Liquidity, BSL/SSL Taken, Equal Highs & Lows, MTF Dashboard, Multiple Time Frame, BigBar, HTF OB
TrendMaestro5
Stefano Frisetti
note: this indicator is for METATRADER4, if you want the version for METATRADER5 this is the link:  https://www.mql5.com/it/market/product/108106 TRENDMAESTRO recognizes a new TREND in the bud, he never makes mistakes. The certainty of identifying a new TREND is priceless. DESCRIPTION TRENDMAESTRO identifies a new TREND in the bud, this indicator examines the volatility, volumes and momentum to identify the moment in which there is an explosion of one or more of these data and therefore the mome
Auto Order Block with break of structure based on ICT and Smart Money Concepts Futures Break of Structure ( BoS )             Order block ( OB )            Higher time frame Order block / Point of Interest ( POI )    shown on current chart           Fair value Gap ( FVG ) / Imbalance   ,  MTF      ( Multi Time Frame )    Volume Imbalance     ,  MTF          vIMB Gap’s Equal High / Low’s     ,  MTF             EQH / EQL Liquidity               Current Day High / Low           HOD /
TrendDecoder Premium MT5
Christophe, Pa Trouillas
5 (1)
Identify ranges  | Get earliest signals of Trends  | Get clear exits before reversal  | Spot the Fibo levels the price will test   |  Non-repainting, non-delayed indicator - ideal for manual and automated trading - for all assets and all time units $69   for launch - then back to >>   $149 After purchase,   please contact me on this channel   for recommended and personalised settings MT4   version:  Click here Get our full method with  BladeSCALPER  and   PowerZONES What is it about? TrendDE
XQ Indicator MetaTrader 5
Marzena Maria Szmit
5 (1)
Step into the realm of Forex trading with confidence and precision using XQ, a cutting-edge Forex indicator designed to elevate your trading game to unprecedented heights. Whether you're a seasoned trader or just stepping into the world of currency exchange, XQ Forex Indicator empowers you with the insights and signals needed to make informed trading decisions. The signal conditions are a combination of three indicators, and XQ Forex Indicator only display  medium and long-term trends . The ind
IX Power MT5
Daniel Stein
5 (1)
IX Power   finally brings the unbeatable precision of FX Power to non-Forex symbols. It accurately determines the intensity of short, medium and long-term trends in your favourite indices, stocks, commodities, ETFs, and even cryptocurrencies. You can   analyse everything   your terminal has to offer. Try it out and experience how   your timing improves significantly   when trading. Read about our latest strategic development -  Easy scalping with IX Power Visit our all-new   Stein Investments
Volume by Price MT5
Brian Collard
5 (3)
The Volume by Price Indicator for MetaTrader 5 features Volume Profile and Market Profile TPO (Time Price Opportunity). Get valuable insights out of currencies, equities and commodities data. Gain an edge trading financial markets. Volume and TPO histogram bar and line charts. Volume Footprint charts. TPO letter and block marker charts including split structures. Versatile segmentation and compositing methods. Static, dynamic and flexible ranges with relative and/or absolute visualizations. Lay
Quantum Heiken Ashi PRO MT5
Bogdan Ion Puscasu
4.5 (8)
Introducing the Quantum Heiken Ashi PRO charts with integrated alerts Designed to provide clear insights into market trends, the Heiken Ashi candles are renowned for their ability to filter out noise and eliminate false signals. Say goodbye to confusing price fluctuations and hello to a smoother, more reliable chart representation. What makes the Quantum Heiken Ashi PRO truly unique is its innovative formula, which transforms traditional candlestick data into easy-to-read colored bars. Red and g
A key element in trading is zones or levels from which decisions to buy or sell a trading instrument are made. Despite attempts by major players to conceal their presence in the market, they inevitably leave traces. Our task was to learn how to identify these traces and interpret them correctly. Reversal First Impulse levels (RFI)   -  Version MT4                  INSTRUCTIONS                 RUS                 ENG                         R ecommended to use with an indicator   -  TREND PRO  
Was: $249  Now: $99   Market Profile defines a number of day types that can help the trader to determine market behaviour. A key feature is the Value Area, representing the range of price action where 70% of trading took place. Understanding the Value Area can give traders valuable insight into market direction and establish the higher odds trade. It is an excellent addition to any system you may be using. Inspired by Jim Dalton’s book “Mind Over Markets”, this indicator is designed to suit the
Golden Gate Algo MT5
James David Lane
4 (6)
Introducing GoldenGate Algo: A Cutting-Edge Trading Solution!  Discover a revolutionary approach to trading with GoldenGate Algo (GGA), an advanced indicator designed to elevate your trading experience. GGA provides a comprehensive set of features to empower users with precision and confidence in their trading decisions. No re-painting! Pairs:   Any TimeFrames:   15m up to H1 Key Features: Buy and Sell Arrow Indications:   Receive Buy and Sell arrow indications accompanied by pop-up alerts,
Gartley Hunter Multi
Siarhei Vashchylka
5 (5)
Gartley Hunter Multi - An indicator for searching for harmonic patterns simultaneously on dozens of trading instruments and on all classic timeframes: (m1, m5, m15, m30, H1, H4, D1, Wk, Mn). Manual (Be sure to read before purchasing) | Version for MT4 Advantages 1. Patterns: Gartley, Butterfly, Shark, Crab. Bat, Alternate Bat, Deep Crab, Cypher 2. Simultaneous search for patterns on dozens of trading instruments and on all classic timeframes 3. Search for patterns of all possible sizes. Fr
PZ Swing Trading MT5
PZ TRADING SLU
5 (4)
Swing Trading is the first indicator designed to detect swings in the direction of the trend and possible reversal swings. It uses the baseline swing trading approach, widely described in trading literature. The indicator studies several price and time vectors to track the aggregate trend direction and detects situations in which the market is oversold or overbought and ready to correct. [ Installation Guide | Update Guide | Troubleshooting | FAQ | All Products ] Profit for market swings with
First of all Its worth emphasizing here that this Trading System is Non-Repainting, Non-Redrawing and Non-Lagging Indicator, Which makes it ideal for professional trading. The "Smart Support and Resistance Trading System" is an advanced indicator tailored for  new  and  experienced  traders. It empowers traders with precision and confidence in the forex market. This comprehensive system combines 7+ strategies, 10 indicators, and various trading approaches, including day trading strategy, swing
Owl Smart Levels MT5
Sergey Ermolov
4.47 (36)
MT4 version  |   FAQ The Owl Smart Levels Indicator is a complete trading system within the one indicator that includes such popular market analysis tools as Bill Williams' advanced fractals , Valable ZigZag which builds the correct wave structure of the market, and Fibonacci levels which mark the exact levels of entry into the market and places to take profits. Detailed description of the strategy Instructions for working with the indicator Advisor-assistant in trading Owl Helper Private User
Blahtech Supply Demand MT5
Blahtech Limited
4.57 (14)
Was: $299  Now: $99   Supply Demand uses previous price action to identify potential imbalances between buyers and sellers. The key is to identify the better odds zones, not just the untouched ones. Blahtech Supply Demand indicator delivers functionality previously unavailable on any trading platform. This 4-in-1 indicator not only highlights the higher probability zones using a multi-criteria strength engine, but also combines it with multi-timeframe trend analysis, previously confirmed swings
More from author
Identify Trend
Aleksey Ivanov
4.25 (32)
The Identify Trend indicator, using fairly simple but robust filtering methods (based on the moving median – algorithm XM )  and more complex algorithms (XC, XF, XS, four types of non-lagging moving averages   SMAWL, EMAWL,  SSMAWL, LWMAWL ) developed by the author , allows determined (1) the beginning of a true trend movement very precisely and, most importantly, with a small delay, and (2) identifying the flat. Such an indicator can be used for trading scalper strategies as well
FREE
Identify Market State
Aleksey Ivanov
5 (1)
The Identify Market State   indicator allows you to set the beginning of a new trends and pullbacks on an existing trend. This indicator can be used both for trading on scalper strategies and for long-term trading strategies.               The indicator is based on the 14 periodic DeMarker   indicator and the 8 periodic simple moving average from this indicator. Statistical studies have shown that the sharp peaks of the DeMarker   indicator curve when they drop below its minimum li
Scientific trade
Aleksey Ivanov
5 (1)
An extremely convenient indicator that truly makes the process of making money on the exchange easy. It is based on the scientifically rigorous theory of the market developed by the author, the beginning of which is presented here .                The full algorithm of this indicator operation is presented in the article .               The indicator calculates the most probable price movement trajectory and displays it on the chart. Based on the predicted price movement trajectory
TrueChannel
Aleksey Ivanov
5 (7)
The TrueChannel   indicator shows us the true price movement channels. This indicator resembles Donchian Channel   in its appearance, but is built on the basis of completely different principles and gives (in comparison with Donchian Channel , which is better just to use to assess volatility) more adequate trading signals.              As shown in the article , the price actually moves in channels parallel to the time axis and jumps abruptly from the previous channels to the subsequ
FREE
Absolute Bands
Aleksey Ivanov
4.5 (4)
Principles of construction of the indicator.               The Absolute Bands (AB) indicator is reminiscent of the Bollinger Bands indicator with its appearance and functions, but only more effective for trading due to the significantly smaller number of false signals issued to them. This effectiveness of the Absolute Bands indicator is due to its robust nature.               In the Bollinger Bands indicator, on both sides of the moving average - Ma, there are lines spaced from Ma by the standa
FREE
Quality trend
Aleksey Ivanov
5 (1)
The Quality trend indicator expresses the ratio of the strength of a trend or the speed of its growth (fall) to the degree of its noisiness or a certain norm of amplitudes of chaotic fluctuations of a growing (falling) price. The position of the indicator line above zero shows an increasing trend, below zero - a falling trend, the fluctuation of the indicator line near zero shows a flat. If the indicator line begins to fluctuate rapidly around zero and approach it, then this indica
Casual Channel
Aleksey Ivanov
5 (1)
The trends that you see on the charts are not always trends or, more precisely, trends on which you can make money. The point is that there are two kinds of trends:  1)   true trends that are caused by fundamental economic reasons that are stable and, therefore, can provide a reliable profit for the trader;  2)  and there are false trend sections that only look like a trend and arise due to chains of random events - moving the price (mainly) in one direction. These false trend sec
The Signal Envelopes   indicator uses the robust filtering method based on: (1) the moving median Buff0 = <Median> = (Max {x} + Min {x}) / 2 and (2) the averaging algorithm developed by the author Buff1 = <(<Median> ) ^ (- 3)> * (<Median>) ^ 4  based on the moving median. The Signal Envelopes   indicator allows you to most accurately and with the minimum possible delay set the beginning of a new trend.  The Signal Envelopes indicator can be used both for trading according to scalpe
Iterative Moving Average – IMA.   IMA is obtained by correcting the usual   MA.   The correction consists in addition   to MA averaged difference between the time series (X) and its MA, i.e.   IMA(X)=MA(X) + MA ( Х -MA(X)). Correction is done in several iterations (and, exactly, 2 iterations in this indicator) and with a change in the averaging period.               As a result, the time-series points begin to cluster around (on all sides) of the getting   IMA and with a smaller de
Firstly , the script estimates how many Mx bars of the chart (on which this script is applied) the future trend will most likely continue and what is its quality. Secondly (and most importantly), the script is an auxiliary tool for the extremely mathematically advanced and extremely effective ScientificTrade indicator in trading. The script calculates the optimal averaging period, which is also equal to Mx, of the ScientificTrade indicator, which gives the maximum profit according to the strate
Profit Trade
Aleksey Ivanov
The principle of constructing indicator lines .               Profit Trade  indicator is very effective for trading. Profit Trade  is a deep development of the well-known Donchian channel  indicator. The upper (BlueViolet color) Dup and the lower (IndianRed) Ddn lines of the indicator are constructed in the same way as in the Donchian channel , based on the highest (high of High) and lowest (low of Low) prices for the previous n1 = 20 periods. The middle line (Gold) Dm is constructed in the sam
Profit MACD
Aleksey Ivanov
5 (2)
I present an indicator for professionals. ProfitMACD is very similar to classic MACD in appearance and its functions . However, ProfitMACD is based on completely new algorithms (for example, it has only one averaging period) and is more robust, especially on small timeframes, since it filters random price walks. The classic MACD indicator (Moving Average Convergence / Divergence) is a very good indicator following the trend, based on the ratio between two moving averages, namely the EM
Channel Builder
Aleksey Ivanov
4.67 (6)
The Channel Builder (CB) or Ivanov Bands indicator is a broad generalization of the Bollinger Bands indicator. First, in CB, the mean line <X> is calculated using various averaging algorithms. Secondly, the mean deviations calculated by Kolmogorov averaging are plotted on both sides of the middle line <X>.                The middle line <X>, besides the standard SMA, EMA, SMMA and LWMA averaging algorithms, can be Median = (Max + Min) / 2 sliding median (which is the default). In
FREE
Alligator Analysis
Aleksey Ivanov
4.75 (4)
Indicator description.            The “ Alligator Analysis ” ( AA ) indicator allows you to build various (by averaging types and by scales) “ Alligators ” and their combinations, i.e. allows you to analyze the state of the market based on the correlation of this state with a whole range of different " Alligators ".  The classic " Alligator " by Bill Williams is based on moving averages and Fibonacci numbers, which makes it one of the best indicators now. The classic " Alligator "   is based on
FREE
Asummetry
Aleksey Ivanov
The principle of the indicator.                             The Asummetry  indicator allows you to predict the beginning of a change in the direction of trends, long before their visual appearance on the price chart.               The author statistically revealed that before changing the direction of the trend, the probability distribution function of the price is made as asymmetric as possible. More precisely, the price movement in any direction always pulls sideways the function of its dis
PDP indicator is used for: defining price probability distributions. This allows for a detailed representation of the channel and its borders and forecast the probability of a price appearing at each segment of its fluctuations; defining the channel change moment. Operation principles and features PDP analyzes a quote history on lower timeframes and calculates a price probability distribution on higher ones. Forecast algorithms allow the indicator to calculate probability distributions and m
Signal Bands
Aleksey Ivanov
Signal Bands is a sensitive and convenient indicator, which performs deep statistical processing of information. It allows to see on one chart (1) the price trend, (2) the clear price channel and (3) latent signs of trend change. The indicator can be used on charts of any periods, but it is especially useful for scalping due to its high sensitivity to the current market state. The functions of the indicator : First, the Signal Bands indicator draws channels into which all price fluctuations ex
Structure of the indicator.               The Cunning crocodile indicator consists of three moving averages (applied to the price   Median price   = (high + low)/2 ) :   1) the usual MA ( SMA , EMA , SMMA ,   LWMA )  or the mean <X> of the process X and her two generalizations 2) <XF> = <X / <X >> * <X> and 3) <XS> = <X * <X >> / <X> with the same averaging period. All three curves intersect at common points that (such an intersection in which the cunning crocodile, unlike the usual one, "never
Sensitive Signal
Aleksey Ivanov
5 (2)
The Sensitive Signal ( SS ) indicator, using the filtering methods  (which includes cluster multicurrency analysis) developed by the author, allows, with a high degree of probability, to establish the beginning of the true (filtered from interference - random price walks) trend movement. It is clear that such an indicator is very effective for trading on the currency exchange , where signals are highly distorted by random noise. The filtration developed by the author is carried out
The principle of the indicator.               A simple moving average (SMA) with an averaging period (2n + 1) of bars is always obtained lagging by n bars. If SMA or other types of moving averages are the basis for making trading decisions, then their strong delay does not allow   to open positions in time and close positions, which leads to losses.                            The Estimation moving average without lag ( EMAWL ) indicator calculates the non-lagging moving average, which is calcula
The principle of the indicator.               The Strong Trend Flat Signal (STFS) indicator is the intersection of two, developed by the author, non-lagging moving averages with averaging periods 21 and 63.               A simple moving average (SMA) with an averaging period (2n + 1) of bars is always obtained lagging by n bars. If SMA or other types of moving averages are the basis for making trading decisions, then their strong delay does not allow  to open positions in time and close positi
StatChannel
Aleksey Ivanov
5 (1)
The principle of the indicator.               The StatChannel ( SC ) indicator is a development of the Bollinger Bands indicator ( ВВ ).  BB is a moving average, on both sides of which two lines are drawn, separated from it by standard deviations std multiplied by the corresponding coefficient. At the same time, a moving average with an averaging period (2n + 1) bars is always obtained lagging behind n bars.  Sliding std is also lagging behind on n bars, also calculated by (2n + 1) points. Such
StatPredict
Aleksey Ivanov
Introduction.             The indicator predicts the price in accordance with the prevailing trend  and its own small statistical price fluctuations around this trend. At the same time, in StatPredict , you need to set the time horizon of the forecasted events, which is set by the parameter settings of the “ Length of forecast in bars ” indicator and determined by the characteristic time scale of the current   trend, which is best measured by the ProfitMACD indicator or by the previous price co
Indicator is used for: defining price probability distributions. This allows for a detailed representation of the channel and its borders and forecast the probability of a price appearing at each segment of its fluctuations; defining the channel change moment.   Operation principles and features Indicator analyzes a quote history on lower timeframes and calculates a price probability distribution on higher ones. Forecast algorithms allow the indicator to calculate probability distributions and m
The principle of constructing indicator lines and their meaning .               The Signal Channel   indicator uses a robust filtering method based on two moving medians applicable to the High and Low prices, i.e. the lines <High> and <Low>, where <..> is the sign of linear averaging, which are shifted by certain values ​​in an uptrend and by opposite values ​​in a downtrend, which allows you to get a narrow channel, approximately outlining each bar. Sharp kinks of the lines of such a channel a
Robust Filter
Aleksey Ivanov
5 (1)
The Robust filter   indicator is based on the robust filtering algorithm developed by the author using the multi-period averaged moving median. The algorithm for this averaging is shown in the last screenshot.                The indicator calculates and shows: 1. The direction of the trend; 2. Entry and exit points of positions; 3. StopLoss   lines calculated from current price probability distributions and selected probability of closing an order by StopLoss before the trend revers
This   indicator is intended for professionals assessing fundamental market trends.  This indicator calculates the index of any instrument and analyzes it.              The index of the state currency shows the real purchasing power of this currency, and the dynamics of this index shows the dynamics of the economic state of the corresponding state. An analysis of the indices of both currencies included in a currency pair makes it much more reliable to identify the trend of this cur
The Multicurrency Trend Detector ( MTD ) indicator allows you to immediately and on one chart on a selected time interval (extending from a zero bar to a bar set in the settings by the value horizon) determine the presence, direction and strength of trends in all major currencies, as well as assess the reliability of these trends.               This is achieved by calculating indices (non-relative purchasing power) of eight major currencies, namely: AUD, CAD, CHF, EUR, GBP, JPY, NZ
StatZigZag
Aleksey Ivanov
The StatZigZag  indicator looks like a regular ZigZag , but is built on the basis of completely different algorithms. The StatZigZag  indicator is a broken line built from segments of regression lines of different lengths, the beginning of each of which comes from the end of the previous segment. Each regression segment is built until the variance or spread of price around it begins to exceed a certain critical value, after which the construction of this segment ends and the constr
The Velocity of price change   ( VP ) indicator shows the average rate of price change at those characteristic time intervals where this rate was approximately constant. The robust algorithm used in VP   to smooth out the price from its random jumps, ensures the reliability of the indicator reading, which does not react to simple price volatility and its insignificant movements.             The indicator allows you to track trends and the moments of their reversals , during which t
Filter:
Malcolm David Parker
470
Malcolm David Parker 2021.04.22 10:42 
 

I find this indicator very useful for my manual trading

Reply to review