Prof MACD
- Indikatoren
-
Aleksey Ivanov
 👑 Theoretischer Physiker, Programmierer, Händler mit 15 Jahren Erfahrung.
------------------------------------------------------------------------------------------
💰 Präsentierte Produkte: - Version: 1.0
- Aktivierungen: 5
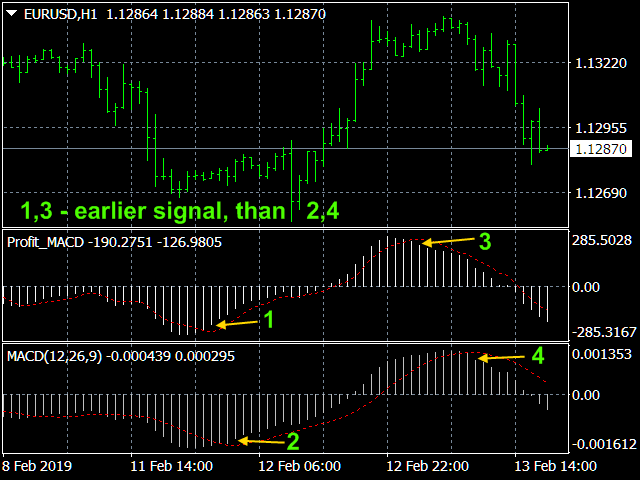
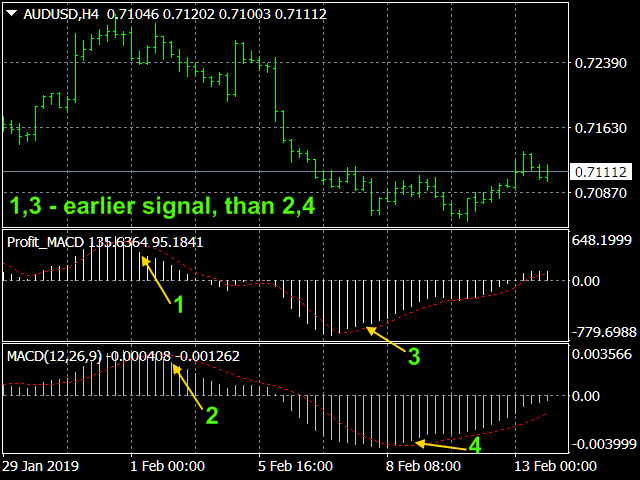
Ich stelle einen Indikator für Profis vor. Prof MACD ist dem klassischen MACD im Aussehen und in seinen Funktionen sehr ähnlich. Prof MACD basiert jedoch auf völlig neuen Algorithmen (z.B. hat er nur eine Mittelungsperiode) und ist robuster, vor allem bei kleinen Zeitrahmen, da er zufällige Kursverläufe filtert. Der klassische MACD-Indikator (Moving Average Convergence / Divergence) ist ein sehr guter Indikator, der dem Trend folgt und auf dem Verhältnis zwischen zwei gleitenden Durchschnitten, nämlich dem EMA mit Perioden von 12 und 26, basiert, d.h.
MACD = EMA(CLOSE, 12) - EMA(CLOSE, 26),
und die Signallinie - gleitender Durchschnitt über 9 Perioden des Indikators selbst
SIGNAL = SMA(MACD, 9).
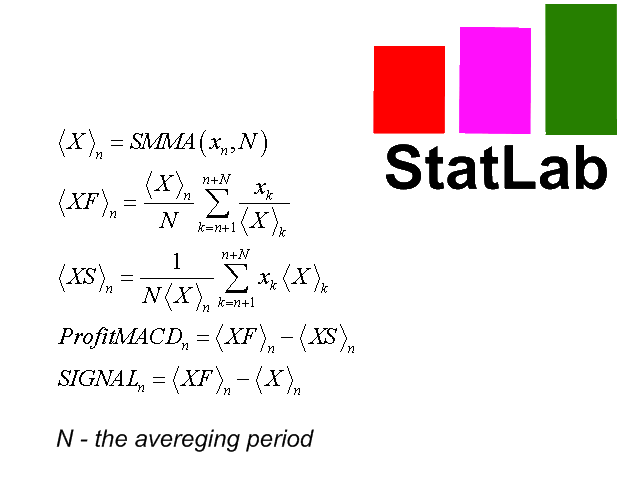
Der Algorithmus des Indikators Prof MACD ist viel komplizierter und wird im letzten Screenshot gezeigt. Prof MACD ist , wie der klassische MACD, am effektivsten, wenn der Markt mit einer großen Amplitude im Handelskorridor schwankt.
Der Indikator verfügt über alle Arten von Alarmen.
Vorteile von Prof MACD.
-
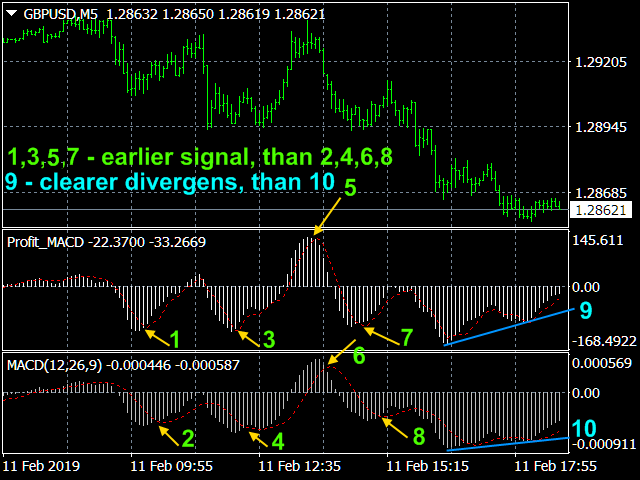
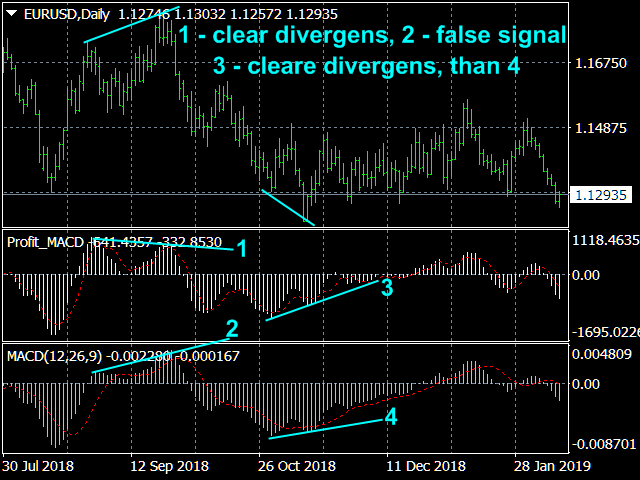
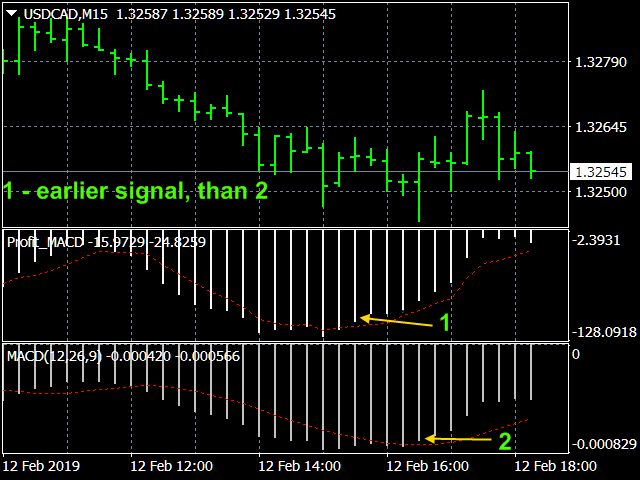
Der klassische MACD gibt viele falsche Signale auf kleinen Zeitfenstern und liefert gute Ergebnisse auf Wochen- und Tagescharts. DerProf MACD arbeitet auf stündlichen Zeitrahmen und kann sogar auf M5 recht genau sein, so dass er für Scalping verwendet werden kann.
-
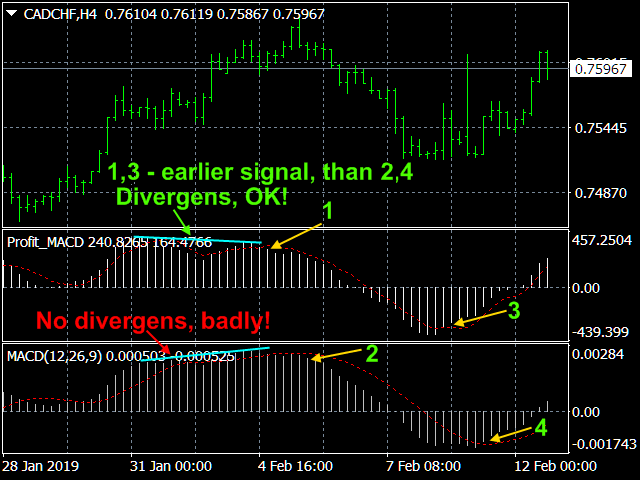
Darüber hinaus hat der Prof MACD-Indikator eine geringere Verzögerung.
-
Je nach dem Wert der Hauptlinie des Prof MACD, die in Punkten dargestellt wird, können Sie, wenn ein Signal vorliegt, die Position des Take Profit festlegen, wenn Sie auf die Schwingungen innerhalb des Kanals setzen. Und wenn Sie mit dem Trend bei diesem Wert spielen, können Sie den Wert des Stop Loss festlegen.
Prof MACD-Signale.
Die Signale für diese Indikatoren sind: (1) Überschneidungen, (2) überkaufte/überverkaufte Bedingungen und (3) Divergenzen.
1)Schnittpunkte .
Wenn die Hauptlinie des Indikators unter die Signallinie fällt, sollten Sie verkaufen; steigt sie über die Signallinie, kaufen Sie.Als Kauf-/Verkaufssignale werden auch die Schnittpunkte der Hauptlinie der Nullmarke nach oben/unten verwendet.
2. überkaufte/überverkaufte Bedingungen .
Wenn der Indikator sehr hoch ist, ist der Preis zu hoch und wird bald auf ein realistischeres Niveau zurückkehren.
3. Divergenzen .
Wenn ein höheres Kurshoch nicht durch ein höheres Hoch des Indikators bestätigt wird (bärische Divergenz) oder umgekehrt ein niedrigeres Minimum nicht durch ein Minimum des Indikators bestätigt wird (bullische Divergenz), bedeutet dies das Ende des Trends und die mögliche Umkehrung des Trends. Diskrepanzen sind besonders bedeutsam, wenn sie sich in überkauften/überverkauften Bereichen bilden.
Einstellungen des Indikators.
- Preistyp - angewandter Preis. Werte: Schlusskurs (Standard), Eröffnungskurs, Höchstkurs, Tiefstkurs, Medianpreis ((Hoch + Tief)/2), Typischer Preis ((Hoch + Tief + Schluss)/3), Gewichteter Preis ((Hoch + Tief + 2*Schluss)/4).
- Der Mittelungszeitraum - Mittelungszeitraum. Werte: beliebige Ganzzahl(9 Standard).
- Dicke der Hauptlinie - Werte: beliebige ganze Zahl(1 Standardwert).
- Dicke der Signallinie - Werte : eine beliebige ganze Zahl(1 Standardwert).
- Daten in Punkten des möglichen Gewinns? - Daten in Punkten des möglichen Gewinns anzeigen? Werte:true (Standard), false.
- Die Signalmethode - Typ des Handelssignal-Alarms.Werte: Nein, Alarm senden, Drucken (im Experten), Kommentar (im Chart), Ton + Druck, Ton + Kommentar, Ton, Push + Kommentar, Push, Mail + Kommentar, Mail.
- Anzahl der berechneten Balken - Werte: beliebige Ganzzahl(300 Standard).

I find this indicator very useful for my manual trading