Prof MACD

5

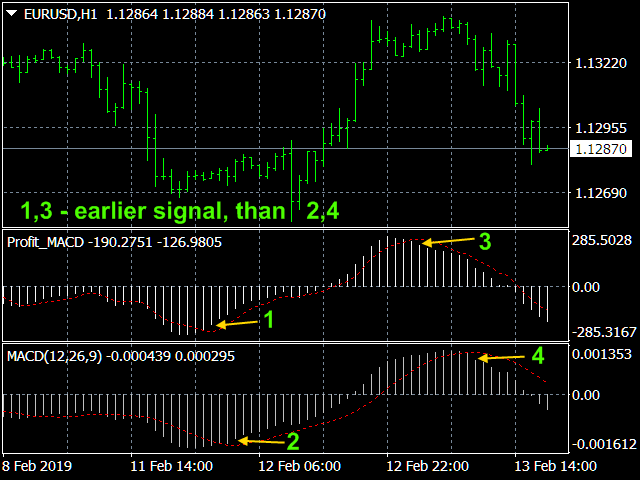
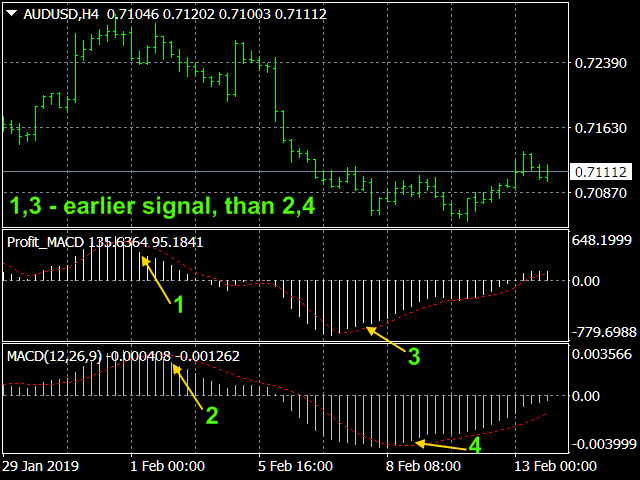
          I present an indicator for professionals. Prof MACD is very similar to classic MACD in appearance and its functions. However, Prof MACD is based on completely new algorithms (for example, it has only one averaging period) and is more robust, especially on small timeframes, since it filters random price walks. The classic MACD indicator (Moving Average Convergence / Divergence) is a very good indicator following the trend, based on the ratio between two moving averages, namely the EMA with periods of 12 and 26, i.e.

MACD = EMA(CLOSE, 12) - EMA(CLOSE, 26),
and the signal line - 9-period moving average from the indicator itself

SIGNAL = SMA(MACD, 9).

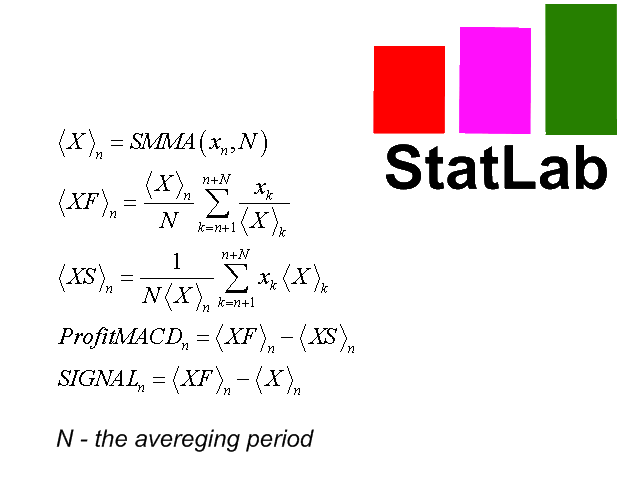
         The algorithm of the indicator Prof MACD is much more complicated and is shown in the last screenshot. Prof MACD, like the classic MACD, is most effective when the market fluctuates with a large amplitude in the trading corridor. 

       The indicator has all kinds of alerts.

Prof MACD  MT4  


Benefits of Prof MACD.

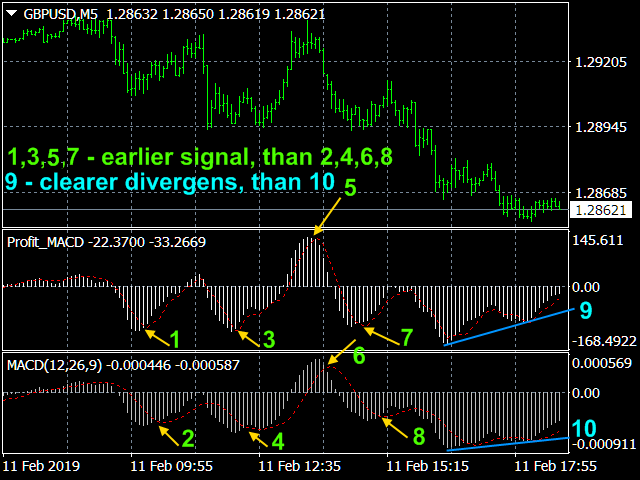
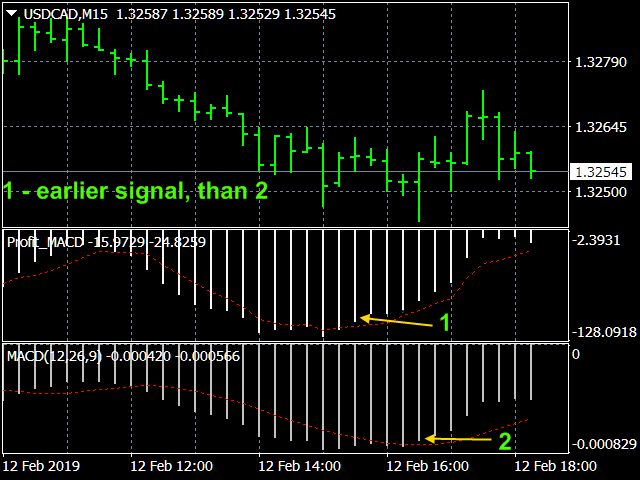
  1. Classic MACD gives a lot of false signals on small timeframes, providing good results on weekly and daily charts. Prof MACD works on hour timeframes and can be quite accurate even on M5, which allows it to be used for scalping.

  2.  In addition, the Prof MACD indicator has less lag.

  3. According to the value of the main line Prof MACD, presented in points, you can, if there is a signal, set the position of Take Profit when playing on the oscillations inside the channel. And when playing by the trend at this value, you can set the value of Stop Loss.


Prof MACD signals.

          The signals for these indicators are: (1) intersections, (2) overbought / oversold conditions, and (3) divergences.

    1. Intersections .

            If the main line of the indicator falls below the signal line, then you should sell; if it rises above the signal line, buy.  As signals to buy / sell, the intersection of the main line of the zero mark up / down is also used.

    2. Overbought / Oversold  conditions.

             If the indicator is very high, the price is too high and will soon return to a more realistic level.
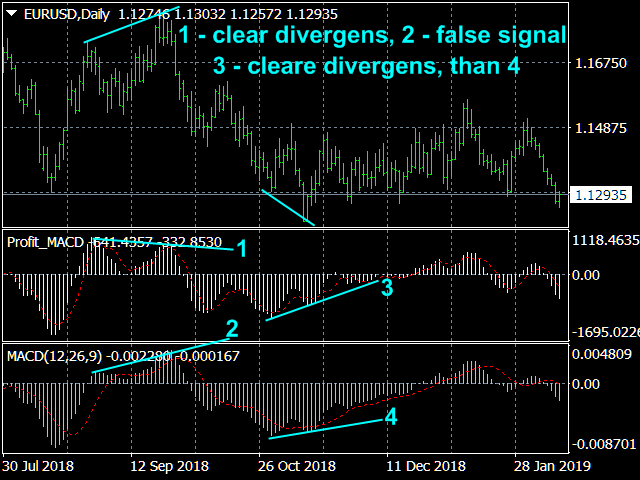
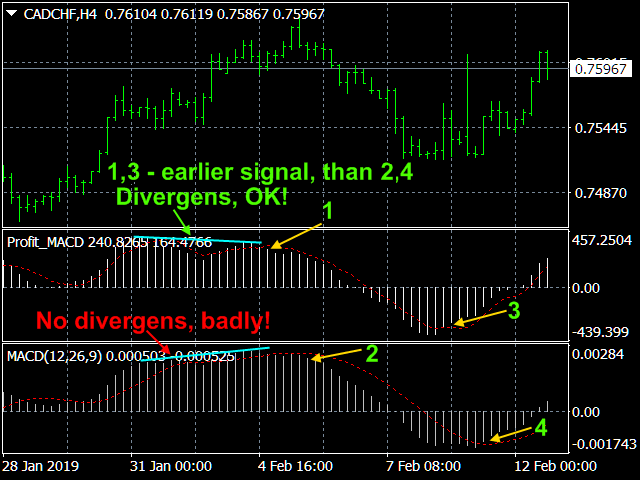
    3. Divergences .

            If a higher price high is not confirmed by a higher high on the indicator (bearish divergence) or vice versa, a lower minimum is not confirmed by a minimum on the indicator (bullish divergence), this means the end of the trend and the possible reversal of the trend.  Discrepancies are most significant if they form in overbought / oversold areas. 


Indicator settings.

  • Price type  - applied price. Values: Close price (default), Open price, High price, Low price, Median price ((high + low)/2), Typical price ((high + low + close)/3),    Weighted  price  ((high + low + 2*close)/4). 
  • The averaging period    -  averaging period. Values: any integer   (9 default).
  • Main line thickness  -  Values: any integer   (1 default).
  • Signal line thickness Values: any integer   (1 default).
  • Data in points of possible profit? -  Show data in points of possible profit? Values:  true (default), false
  • The Signal method Type of trading signal alert. Values:  No, Send alert, Print (in expert), Comment (in chart), Sound + Print, Sound + Comment, Sound, Push + Comment, Push,  Mail + Comment, Mail.
  • Number of calculated bars - Values: any integer   (300 default).


리뷰 1
Malcolm David Parker
482
Malcolm David Parker 2021.04.22 10:42 
 

I find this indicator very useful for my manual trading

추천 제품
Fibonacci sequence is defined by integer sequence: 0, 1, 1, 2, 3, 5, 8, 13, 21, 34, 55, 89, 144, ... By definition, it starts from 0 and 1, the next number is calculated as a sum of two previous numbers. Instead of the standard moving average, the indicator uses the following calculation of average price: Bar0 + Bar1 + Bar2 + Bar3 + Bar5 + Bar8 + Bar13 + Bar21 + ... Input parameters: fiboNum - numbers in the following integer sequence for Fibo Moving Average 1. 5 on default. fiboNum2 - numbers i
Description The base of this indicator is an ZigZag algorithm based on ATR and Fibo retracement. The ZigZag can be drawn like a classic ZigZag or like Arrows or needn't be drawn at all. This indicator is not redrawing in sense that the ZigZag's last shoulder is formed right after the appropriate conditions occur on the market. The shoulder doesn't change its direction afterwards (can only continue). There are some other possibilities to show advanced information in this indicator: Auto Fibo on
Fibonacci sequence is defined by integer sequence: 0, 1, 1, 2, 3, 5, 8, 13, 21, 34, 55, 89, 144, ... By definition, it starts from 0 and 1, the next number is calculated as a sum of two previous numbers. Instead of the standard moving average, the indicator uses the following calculation of average price: Bar0 + Bar1 + Bar2 + Bar3 + Bar5 + Bar8 + Bar13 + Bar21 + ... This indicator shows 2 moving Fibonacci lines and arrows when 2 these lines crossing each other. If an Aqua line is crossing a Yell
Price Magnet — Price Density and Attraction Levels Indicator Price Magnet is a professional analytical tool designed to identify key support and resistance levels based on statistical Price Density. The indicator analyzes a specified historical period and detects price levels where the market spent the most time. These zones act as “magnets,” attracting price action or forming a structural base for potential reversals. Unlike traditional Volume Profile tools, Price Magnet focuses on price-time d
웰컴 가격: 35달러 헤드 앤 숄더 패턴 은 신뢰할 수 있는 패턴 인식을 원하는 트레이더에게 이상적입니다. 강세 및 약세 헤드 앤 숄더 형성을 포함하며, 통합된 피보나치 레벨, 목선 돌파 감지 및 조기 예측 기술이 적용되었습니다. 차트 구조와 추세 반전을 정확하게 식별하는 기술적 분석을 중시하는 분들을 위한 강력한 MT5 도구입니다. 이중 감지 방법 방법 1 - 클래식 패턴 감지 명확한 구조적 규칙을 사용하여 표준 헤드 앤 숄더 패턴(일반형, 역형, 비표준형)을 감지합니다. 이 방법은 다음을 강조합니다: 명확한 목선 돌파 대칭적인 패턴 형성 피보나치 되돌림 레벨 기반 즉각적인 반응 구역 방법 2 - 예측적 패턴 감지 오른쪽 숄더가 형성되기 전에도 왼쪽 숄더와 머리를 조기에 식별하는 혁신적인 접근법입니다. 예측 삼각형 을 사용하며   Early_Quick_Pips 라인 을 그려 더 빠른 진입 지점과 가격 움직임에 대비할 시간을 제공합니다. 이 방법에서는 피보나치 레벨이 다르게 계산
This Automatic support/resistance indicator calculates various peaks and troughs of the price action, identifies relevant levels and draws support and resistance automatically. It uses the built-in "ZigZag" indicator in Metatrader as a data source hence, very much accurate indicator.  The support and resistance lines are contineusely updated as new levels and formed. The indicator has only 5 parameters to set, and mostly it can be used with the default values:  The description of the settings is
Free automatic Fibonacci is an indicator that automatically plots a Fibonacci retracement based on the number of bars you select on the BarsToScan setting in the indicator. The Fibonacci is automatically updated in real time as new highest and lowest values appears amongst the selected bars. You can select which level values to be displayed in the indicator settings. You can also select the color of the levels thus enabling the trader to be able to attach the indicator several times with differe
FREE
Renko System
Marco Montemari
This indicator can be considered as a trading system. It offers a different view to see the currency pair: full timeless indicator, can be used for manual trading or for automatized trading with some expert advisor. When the price reaches a threshold a new block is created according to the set mode. The indicator beside the Renko bars, shows also 3 moving averages. Features renko mode median renko custom median renko 3 moving averages wicks datetime indicator for each block custom notification
Gekko ADX Plus
Rodrigo Galeote
This is Gekko's Cutomized Cutomized Average Directional Index (ADX), a customized version of the famous ADX indicator. Use the regular ADX and take advantage two entry signals calculations and different ways of being alerted whenever there is potential entry or exit point. Inputs Period: Period for the ADX calculation; PlotSignalType: How will the indicator calculate entry (swing) signals: 1- ShowSwingsOnTrendLevel : Show Signals for Trend Confirmation Swings; 2- ShowSwingsOnTrendLevelDirection
AUTO FIBONACCI MULTI-TIMEFRAME TOOLKIT Technical analysis tool that automatically draws Fibonacci levels for 4H, Daily, Weekly, and Monthly sessions. AUTOMATIC FIBONACCI RETRACEMENTS (7 CLASSIC LEVELS): - 0.0% (Previous session Low - support level) - 23.6% (Fibonacci Golden Ratio - early entry level) - 38.2% (Strong retracement level) - 50.0% (Key pivot level highlighted in YELLOW - market equilibrium) - 61.8% (Main Golden Ratio - critical decision level) - 78.6% (Deep retracement level) - 100.0
Contact me for instruction, any questions! - Lifetime update free - Non-repaint - I just sell my products in Elif Kaya Profile, any other websites are stolen old versions, So no any new updates or support. Introduction Breakout Trend Scanner indicator works based on the Elliott Wave in technical analysis describes price movements in the financial market that are related to changes in trader sentiment and psychology and finds end of movement and breakout trend. The Elliott Wave pattern that is f
CosmiCLab FIBO
Kirils Subins
CosmiCLab SMC FIBO CosmiCLab SMC FIBO is a professional trading indicator designed for traders who use Smart Money Concepts (SMC), market structure analysis and Fibonacci retracement levels. The indicator automatically detects market swings and builds Fibonacci levels based on the latest impulse movement. It also identifies market structure changes such as BOS (Break of Structure) and CHOCH (Change of Character), helping traders understand the current market direction. CosmiCLab SMC FIBO also pr
Donchian Channel DC
Renato Takahashi
Donchian Channel DC is the indicator of Donchian Channels, that plots maximum and minimum values of a specific period, besides mean value line. It´s possible to configure simple period for analysis and the indicator will plot all three values. You can trade with this indicator as trend or reversal, according to each strategy. Do not let to test others indicators as soon as others expert advisors.
Golden Vector
Marius Ovidiu Sunzuiana
Golden Vector — Precision Market Geometry for the Modern Trader Golden Vector is a cutting‑edge trading indicator that fuses advanced Fibonacci analytics with high‑level mathematical modeling to reveal the hidden vectors driving market movement. Engineered for traders who demand more than basic retracement lines, it transforms raw price data into a geometrically structured roadmap for strategic entries and exits. Core Advantages Next‑Gen Fibonacci Engine — Goes beyond standard ratios, dynamical
Haven Key Levels PDH PDL
Maksim Tarutin
5 (8)
"Haven Key Levels PDH PDL"   인디케이터는 트레이더가 차트에서 핵심 레벨을 시각화하는 데 도움을 줍니다. 다음 레벨을 자동으로 표시합니다: DO (Daily Open)   — 일일 시가. NYM (New York Midnight)   — 뉴욕 자정 레벨. PDH (Previous Day High)   — 전일 고가. PDL (Previous Day Low)   — 전일 저가. WO (Weekly Open)   — 주간 시가. MO (Monthly Open)   — 월간 시가. PWH (Previous Week High)   — 전주 고가. PWL (Previous Week Low)   — 전주 저가. CMH (Current Month High)   — 당월 고가. CML (Current Month Low)   — 당월 저가. PMH (Previous Month High)   — 전월 고가. PML (Previous Month Low)   — 전월 저가. 다른
FREE
Channel FTF MT5
Pavel Verveyko
The Envelopes indicator determines the presence of a trend or flat. It has 3 types of signals, shows the probable retracement levels and levels of the possible targets. The Fibonacci coefficients are used in the indicator's calculations. Signals   (generated when touching the lines or rebounding from lines): Trend   - the middle line of the Envelopes has a distinct inclination; the lines below the channel's middle line are used for buy trades, the lines above the middle line and the middle line
Harness the power of the universe's most perfect number. Golden Retracement is an Expert Advisor meticulously engineered to identify and trade precise reversals at key Fibonacci retracement levels. It automatically detects significant market swings and calculates the golden ratio levels (38.2%, 50.0%, 61.8%), waiting for the price to "bounce" with a powerful confirmation. This bot brings mathematical elegance and disciplined execution to your trading, helping you capitalize on deep corrections a
FREE
Unlock the power of Fibonacci with our advanced indicator! This tool precisely plots Fibonacci levels based on the previous day's high and low, identifying the next day's key support and resistance levels. Perfect for day trading and swing trading, it has consistently generated weekly profits for me. Elevate your trading strategy and seize profitable opportunities with ease. NOTE: In the Input section make sure the draw labels are set to "True" so you can see each levels.
MASTA SESSION TARGETS - Fibonacci-Based Entry & Target System for XAUUSD The   MASTA SESSION TARGETS   brings professional Fibonacci target analysis directly onto your XAUUSD chart. Instead of manually calculating and drawing Fibonacci levels, this indicator automatically generates six sequential profit targets based on previous session data, giving you a clear roadmap for potential price movement in the current trading day. One Logic for XAUUSD Sessions The MASTA SESSION TARGET works specifical
MSnR Lines
Pierre Paul Amoussou
MSnR Lines 는 차트에 서포트 및 저항 수준을 표시하기 위한 사용자 정의 지표입니다. 이러한 수준은 말레이시아 서포트 및 저항 이론에 기반하여 영역이 아닌 선 차트의 피크와 밸리에서 유도된 특정 가격 수준으로 정의됩니다. 특징: A-Level, V-Level 및 갭 레벨의 세 가지 유형의 수준. 수준에 대한 신선도 표시: 신선한 수준은 신선하지 않은 수준보다 중요합니다. 신선한 및 신선하지 않은 수준을위한 사용자 정의 가능한 색상 및 스타일. 신선한 수준 또는 모든 수준만 표시하는 옵션. 조정 가능한 회고 기간 및 현재 가격 위 아래의 수준 수. 다중 시간 프레임 지원. 사용 방법: 트레이더는 거래 결정을 위해 잠재적인 지원 및 저항 수준을 식별하기 위해 MSnR Lines를 사용할 수 있습니다. 신선한 수준은 보다 중요하며 더 나은 거래 기회를 제공할 수 있습니다.
Thahab Indicator
Ahmed Jumaa Saif Ali Almheiri
Thahab Indicator is built around a powerful heatmap engine that makes it easy to spot key support and resistance areas directly on the chart. By highlighting price zones with strong accumulation and activity, traders can quickly identify where the market is accepting, rejecting, or building pressure. What makes Thahab Indicator special is that it combines: Heatmap-based accumulation zones VWAP POC Value Area Interactive dashboard controls all inside one tool. It is designed to give traders a cle
Cumulative Volume Delta MAX MTF Pro v4.4 — 거래량 기반 트레이딩의 정점 단 하나의 지표로 시장을 지배하십시오: 시장의 '진짜 의도'를 읽으십시오 추측은 멈추십시오. 가격이 움직이기 전에 기관 투자자들이 무엇을 하고 있는지 먼저 파악하십시오. CVD MAX MTF Pro v4.4는 거래량 분석 기술의 정점을 보여주며, 복잡한 데이터를 명확하고 실행 가능한 신호로 변환합니다. 이번 버전에서는 정밀한 다이버전스 감지와 그라데이션 인식 모멘텀 기능을 도입하여 가격 움직임을 주도하는 숨겨진 힘을 그 어느 때보다 정확하게 드러냅니다. v4.4 신기능: 정밀함의 진화 동적 그라데이션 인식 이동평균선 (MA) 정적인 추세선을 4가지 색상의 그라데이션 시스템으로 교체했습니다. 이제 단순히 '상승 추세'를 보는 것에 그치지 않고, 해당 추세의 건강 상태를 실시간으로 확인할 수 있습니다. DeepSkyBlue: 0선 위에서 상승 중 (강세 분출) Orange: 0선 위
The indicator is the advanced form of the MetaTrader 4 standard Fibonacci tool. It is unique and very reasonable for serious Fibonacci traders. Key Features Drawing of Fibonacci retracement and expansion levels in a few seconds by using hotkeys. Auto adjusting of retracement levels once the market makes new highs/lows. Ability to edit/remove any retracement & expansion levels on chart. Auto snap to exact high and low of bars while plotting on chart. Getting very clear charts even though many ret
"Adjustable Fractals"는 프랙탈 지표의 고급 버전으로, 매우 유용한 거래 도구입니다! .................................................................................................................. - 알다시피 표준 프랙탈 MT5  지표에는 설정이 전혀 없습니다. 이는 거래자에게 매우 불편합니다. - Adjustable Fractals는 이 문제를 해결했습니다. 필요한 모든 설정이 있습니다. - 지표의 조정 가능한 기간(권장 값 - 7 이상). - 가격의 고점/저점으로부터 조정 가능한 거리. - 프랙탈 화살표의 조정 가능한 디자인. - 표시기에는 모바일 및 PC 알림 기능이 내장되어 있습니다. 여기를 클릭하여 고품질 트레이딩 로봇과 지표를 확인하세요! 이 MQL5 웹사이트에서만 제공되는 오리지널 제품입니다.
Pivot Levels Pro EA
Vladimir Shumikhin
1 (1)
Pivot Levels Pro – MT5용 고급 자동매매 솔루션 (Expert Advisor) Pivot Levels Pro 는 MetaTrader 5를 위한 다기능 자동매매 프로그램(Expert Advisor)으로, 클래식(Classic), 피보나치(Fibonacci), 카마릴라(Camarilla), 우디(Woodie), 디마크(DeMark) 등 다양한 피벗(Pivot) 레벨을 자동으로 계산 및 표시하고, 이를 기반으로 거래를 실행합니다. 이 EA는 강력한 포지션 관리 로직(그리드 알고리즘, 트레일링 스톱, 손익분기 기능)을 직관적인 통계 패널과 결합하여 일·주·월간 및 전체 수익을 한눈에 확인할 수 있게 해줍니다. 거래 이력은 차트 상에서 화살표와 선으로 시각적으로 표시됩니다. 본 제품은 클래식 피벗 및 최신 피벗 계산 기법을 사용해 자동 매매를 원하는 트레이더에게 적합합니다. 또한 EUR/USD, GBP/USD, USD/JPY, USD/CHF와 같은 주요 통화쌍, 금(XAU/U
Pivot_Point_Weekly — clear, uncluttered weekly pivots for MT5 Pivot_Point_Weekly plots one thing and does it exceptionally well: the classic weekly pivot (P) calculated from the previous week’s high, low, and close. It renders each week’s pivot as a clean horizontal “step,” with short, perfectly vertical joins from week to week so you can see the regime shifts at a glance—without cluttering your chart with a forest of levels. This indicator is intentionally minimalist: no S1/R1 ladders, no fib v
VolumeDeltaWaves
Stanislav Korotky
This indicator is an extended implementation of Weis waves. It builds Weis waves on absolute volumes (which is the classical approach) or delta of volumes (unique feature) using different methods of wave formation and visualization. It works with real volumes, if available, or with tick volumes otherwise, but also provides an option to use so called "true volume surrogates", as an artificial substitution for missing real volumes (for example, for Forex symbols), which was introduced in correspo
-- 간단하지만 효과적입니다. 역전 지표 - 무엇인가요? 슈퍼트렌드(SuperTrend) 논리와 지수 곡선 기술을 결합한 추세 추종 오버레이 지표입니다. 추세 방향을 감지하고 차트에 동적 채널을 그리며, 추세가 반전될 때 실시간 알림을 보냅니다. 어떻게 작동하나요? 지표는 ATR과 슈퍼트렌드 계수를 사용해 지수형 기준선을 계산합니다. 가격이 이 기준선 위나 아래로 마감되면 추세 반전이 확인됩니다. 녹색 화살표는 매수 추세 시작을, 빨간색 화살표는 매도 추세 시작을 표시합니다. 주요 기능: ATR 기반 동적 채널을 적용한 지수 추세 기준선 녹색/적색으로 구분된 추세선 및 채워진 채널 추세 반전 시 매수/매도 화살표 신호 내장 알림: 팝업, 푸시 알림, 이메일, 소리 중복 알림 방지 (바당 하나의 알림) 완전 커스터마이징 가능: 색상, 선 두께, 화살표 크기, 채널 폭 지연 없는 깔끔한 차트 오버레이 입력값: 지수 추세율, 슈퍼트렌드 계수, ATR 기간, 채널 폭 토글 기능
FREE
Product Name:   Institutional Structure & Order Flow (SMC God Tier) Category:   Indicator / Trend / Price Action Short Description: The ultimate Smart Money Concept (SMC) indicator. Detects Order Blocks, FVGs, and Structure Breaks with institutional mitigation logic. Designed for Gold (XAUUSD) & Forex. Full Description: STOP TRADING RETAIL. START TRADING INSTITUTIONAL. Are you tired of lagging indicators? The   Institutional Structure & Order Flow (ISOF)   is not just another signal too
이 제품의 구매자들이 또한 구매함
ARIPoint
Temirlan Kdyrkhan
ARIPoint is a powerful trading companion designed to generate high-probability entry signals with dynamic TP/SL/DP levels based on volatility. Built-in performance tracking shows win/loss stats, PP1/PP2 hits, and success rates all updated live. Key Features: Buy/Sell signals with adaptive volatility bands Real-time TP/SL/DP levels based on ATR Built-in MA Filter with optional ATR/StdDev volatility Performance stats panel (Success, Profit/Loss, PP1/PP2) Alerts via popup, sound, push, or email Cu
SuperScalp Pro
Van Minh Nguyen
4.59 (22)
SuperScalp Pro – 고급 멀티 필터 스캘핑 지표 시스템 SuperScalp Pro는 클래식 Supertrend와 여러 지능형 확인 필터를 결합한 고급 스캘핑 지표로, 거래 기회를 식별하는 데 도움을 줍니다. M1부터 H4까지 다양한 시간대에서 효율적으로 작동하며, XAUUSD, BTCUSD 및 주요 Forex 통화쌍에 최적화되어 있습니다. 이 지표는 명확한 매수 및 매도 신호를 제공하며, ATR 기반으로 진입가, 손절가, 익절가를 자동 계산하여 보다 효과적인 리스크 관리를 지원합니다. Fibonacci Take Profit 기능은 중요한 가격 구간에서 더 빠르게 포지션을 청산할 수 있도록 하며, 해당 수준 도달 시 알림을 전송합니다. 기본 설정은 Fibonacci Take Profit이 활성화된 상태로 최적화되어 있으며, 보다 안정적이고 일관된 거래 경험에 중점을 둡니다. 차트에 적용하는 것만으로 즉시 사용할 수 있습니다. 고급 사용자를 위해 모든 파라미터는 자유롭게 사용
Entry In The Zone and SMC Multi Timeframe is a real-time 2-in-1 market analysis tool that combines market structure analysis and a No Repaint BUY / SELL signal system into a single indicator, built on Smart Money Concepts (SMC) — a widely adopted framework used by professional traders to understand market structure. This indicator helps you see the market more clearly, make decisions based on structure rather than guesswork, and focus on high-probability zones where price is more likely to react
Divergence Bomber
Ihor Otkydach
4.9 (87)
이 지표를 구매하신 분께는 다음과 같은 혜택이 무료로 제공됩니다: 각 거래를 자동으로 관리하고, 손절/익절 수준을 설정하며, 전략 규칙에 따라 거래를 종료하는 전용 도우미 툴 "Bomber Utility" 다양한 자산에 맞게 지표를 설정할 수 있는 셋업 파일(Set Files) "최소 위험", "균형 잡힌 위험", "관망 전략" 모드로 설정 가능한 Bomber Utility의 셋업 파일 이 전략을 빠르게 설치, 설정, 시작할 수 있도록 돕는 단계별 영상 매뉴얼 주의: 위의 모든 보너스를 받기 위해서는 MQL5 개인 메시지 시스템을 통해 판매자에게 연락해 주세요. 독창적인 커스텀 지표인 “Divergence Bomber(다이버전스 봄버)”를 소개합니다. 이 지표는 MACD 다이버전스(괴리) 전략을 기반으로 한 올인원(All-in-One) 거래 시스템입니다. 이 기술 지표의 주요 목적은 가격과 MACD 지표 간의 다이버전스를 감지하고, **향후 가격이 어느 방향으로 움직일지를 알려주는
Azimuth Pro
Ottaviano De Cicco
5 (7)
Azimuth Pro V2: Synthetic Fractal Structure and Confirmed Entries for MT5 Overview Azimuth Pro is a multi-level swing structure indicator by Merkava Labs . Four nested swing layers, swing-anchored VWAP, ABC pattern detection, three-timeframe structural filtering, and closed-bar confirmed entries — one chart, one workflow from micro-swings to macro-cycles. This is not a blind signal product. It is a structure-first workflow for traders who care about location, context, and timing. V2 Launch Offe
SignalTech MT5
Yue Wang
5 (15)
SignalTech MT5 is a trading system for EURUSD, USDCHF, USDJPY, AUDUSD, NZDUSD, EURJPY, AUDJPY, NZDJPY, CADJPY H2 and H3 Timeframe.  All the winning trades with chart setups are published on the comments page. 2025-12 1174 Pips 2026-01 2624 Pips 2026-02 2937 Pips 2026-03 2165 Pips 2026-04 2243 Pips It can generate signals with Buy/Sell Arrows and Pop-Up/Sound Alerts. Each signal has clear Entry and Stop Loss levels, which should be automatically flagged on the chart, as well as potential Targets
Power Candles MT5
Daniel Stein
5 (8)
Power Candles V3 - 자체 최적화 강도 지표 파워 캔들 V3는 적용된 모든 차트에서 통화 및 상품의 강세를 실행 가능한 거래 계획으로 전환합니다. 단순히 캔들에 색상을 입히는 대신, 백그라운드에서 실시간 자동 최적화를 수행하여 현재 보고 있는 종목에 대한 최적의 손절매, 익절 및 신호 임계값을 제공합니다. 한 번의 클릭으로 실시간 거래에 적용할 수 있으며, 진입점, 손절매 및 익절 선이 정확한 가격에 맞춰 차트에 표시되고, 방향과 함께 알림이 발령됩니다. 이 도구는 Stein Investments 에코시스템의 일부입니다. 18개 이상의 도구와 함께 당신의 1대1 AI 트레이딩 멘토 Max.  항상 대기 중, 모든 인디케이터를 깊이 있게 이해, 무언가를 차근차근 생각해보고 싶은 순간에 도움을 줍니다.  https://stein.investments 에서 만나보세요 매 종가 바마다 3,000회 이상의 트레이딩 시뮬레이션. 9가지 강도 상태. 2가지 전략을 병렬로 테스트.
FX Trend MT5 NG
Daniel Stein
5 (4)
FX Trend NG: 차세대 멀티 마켓 트렌드 인텔리전스 개요 FX Trend NG 는 다중 시간 프레임 기반의 전문 트렌드 분석 및 시장 모니터링 도구입니다. 몇 초 만에 전체 시장 구조를 파악할 수 있도록 설계되었습니다. 여러 차트를 일일이 전환할 필요 없이, 어떤 종목이 추세에 있는지, 어디에서 모멘텀이 약화되고 있는지, 그리고 어떤 시간 프레임이 서로 정렬되어 있는지 즉시 확인할 수 있습니다. 출시 기념 특별 혜택 – FX Trend NG 를 $30 (6개월) 또는 $80 평생 라이선스 로 이용할 수 있습니다. 이미 Stein Investments 고객이신가요? -> 메시지를 보내 전용 고객 그룹에 참여하세요. 설정이나 사용 방법이 필요하신가요? -> Stein Investments 공식 페이지 를 방문하세요. 1. FX Trend NG가 특별한 이유 3단계 추세 로직 – 단순한 Buy / Sell이 아닙니다 • 대부분의 지표는 Buy 또는 Sell 두 가지 상태만 제
Quantum TrendPulse
Bogdan Ion Puscasu
5 (23)
SuperTrend   ,   RSI   ,   Stochastic   의 힘을 하나의 포괄적인 지표로 결합하여 트레이딩 잠재력을 극대화하는 궁극의 트레이딩 도구   인 Quantum TrendPulse를   소개합니다. 정밀성과 효율성을 추구하는 트레이더를 위해 설계된 이 지표는 시장 추세, 모멘텀 변화, 최적의 진입 및 종료 지점을 자신 있게 식별하는 데 도움이 됩니다. 주요 특징: SuperTrend 통합:   주요 시장 추세를 쉽게 따라가고 수익성의 물결을 타세요. RSI 정밀도:   매수 과다 및 매도 과다 수준을 감지하여 시장 반전 시점을 파악하는 데 적합하며 SuperTrend 필터로 사용 가능 확률적 정확도:   변동성이 큰 시장에서 숨겨진 기회를 찾기 위해 확률적 진동   을 활용하고 SuperTrend의 필터로 사용 다중 시간대 분석:   M5부터 H1 또는 H4까지 다양한 시간대에 걸쳐 시장을 최신 상태로 유지하세요. 맞춤형 알림:   맞춤형 거래 조건이 충족되면
이 지표를 구매하면 제 프로페셔널 트레이드 매니저를 무료로 드립니다. 우선 이 거래 시스템이 리페인팅, 리드로잉 및 레이그 인디케이터가 아니라는 점을 강조하는 것이 중요합니다. 이는 수동 및 로봇 거래 모두에 이상적인 것으로 만듭니다. 온라인 강좌, 설명서 및 프리셋 다운로드. "스마트 트렌드 트레이딩 시스템 MT5"은 새로운 및 경험이 풍부한 트레이더를 위해 맞춤형으로 제작된 종합적인 거래 솔루션입니다. 10개 이상의 프리미엄 인디케이터를 결합하고 7개 이상의 견고한 거래 전략을 특징으로 하여 다양한 시장 조건에 대한 다목적 선택이 가능합니다. 트렌드 추종 전략: 효과적인 트렌드 추이를 타기 위한 정확한 진입 및 손절 관리를 제공합니다. 반전 전략: 잠재적인 트렌드 반전을 식별하여 트레이더가 범위 시장을 활용할 수 있게 합니다. 스캘핑 전략: 빠르고 정확한 데이 트레이딩 및 단기 거래를 위해 설계되었습니다. 안정성: 모든 인디케이터가 리페인팅, 리드로잉 및 레이그가 아니므로 신뢰
Gann Made Easy MT5
Oleg Rodin
5 (3)
Gann Made Easy 는 mr.의 이론을 사용하여 최고의 거래 원칙을 기반으로 하는 전문적이고 사용하기 쉬운 Forex 거래 시스템입니다. W.D. 간. 이 표시기는 Stop Loss 및 Take Profit Levels를 포함하여 정확한 BUY 및 SELL 신호를 제공합니다. PUSH 알림을 사용하여 이동 중에도 거래할 수 있습니다. 구매 후 거래 방법 안내 및 유용한 추가 지표를 무료로 받으시려면 저에게 연락주세요! 아마도 Gann 거래 방법에 대해 이미 여러 번 들었을 것입니다. 일반적으로 Gann의 이론은 초보자 거래자뿐만 아니라 이미 거래 경험이 있는 사람들에게도 매우 복잡한 것입니다. Gann의 거래 방식은 이론적으로 적용하기 쉽지 않기 때문입니다. 나는 그 지식을 연마하고 Forex 지표에 최고의 원칙을 적용하기 위해 몇 년을 보냈습니다. 표시기는 적용하기가 매우 쉽습니다. 차트에 첨부하고 간단한 거래 권장 사항을 따르기만 하면 됩니다. 지표는 지속적으로 시장 분석
Basic Harmonic Patterns Dashboard MT5
Mehran Sepah Mansoor
4.36 (11)
이 대시보드는 선택한 심볼에 대해 사용 가능한 최신 고조파 패턴을 표시하므로 시간을 절약하고 더 효율적으로 사용할 수 있습니다 /   MT4 버전 . 무료 인디케이터:   Basic Harmonic Pattern 인디케이터 열 Symbol :   선택한 심볼이 나타납니다 Trend :   강세 또는 약세 Pattern :   패턴 유형(가틀리, 나비, 박쥐, 게, 상어, 사이퍼 또는 ABCD) Entry :   진입 가격 SL:   스톱로스 가격 TP1:   1차 테이크프로핏 가격 TP2:   2차 테이크프로핏 가격 TP3:   3차 테이크프로핏 가격 Current price:   현재 가격 Age (in bars):   마지막으로 그려진 패턴의 나이 주요 입력 Symbols :   "28개 주요 통화쌍" 또는 "선택한 심볼" 중에서 선택합니다. Selected Symbols :   쉼표로 구분하여 모니터링하려는 원하는 심볼("EURUSD,GBPUSD,XAUUSD")을 선택
Grabber System MT5
Ihor Otkydach
4.83 (23)
탁월한 기술적 지표인 Grabber를 소개합니다. 이 도구는 즉시 사용 가능한 “올인원(All-Inclusive)” 트레이딩 전략으로 작동합니다. 하나의 코드 안에 강력한 시장 기술 분석 도구, 매매 신호(화살표), 알림 기능, 푸시 알림이 통합되어 있습니다. 이 인디케이터를 구매하신 모든 분들께는 다음의 항목이 무료로 제공됩니다: Grabber 유틸리티: 오픈 포지션을 자동으로 관리하는 도구 단계별 영상 매뉴얼: 설치, 설정, 그리고 실제 거래 방법을 안내 맞춤형 세트 파일: 인디케이터를 빠르게 자동 설정하여 최고의 성과를 낼 수 있도록 도와줍니다 다른 전략은 이제 잊어버리세요! Grabber만이 여러분을 새로운 트레이딩의 정점으로 이끌어 줄 수 있습니다. Grabber 전략의 주요 특징: 거래 시간 프레임: M5부터 H4까지 거래 가능한 자산: 어떤 자산이든 사용 가능하지만, 제가 직접 테스트한 종목들을 추천드립니다 (GBPUSD, GBPCAD, GBPCHF, AUDCAD, AU
Atomic Analyst MT5
Issam Kassas
3.94 (31)
우선적으로 언급할 점은이 거래 지표가 다시 그리지 않고 지연되지 않으며 이를 통해 수동 및 로봇 거래 모두에 이상적이라는 점입니다. 사용자 매뉴얼: 설정, 입력 및 전략. Atomic Analyst는 가격의 강도와 모멘텀을 활용하여 시장에서 더 나은 이점을 찾는 PA Price Action Indicator입니다. 고급 필터를 장착하여 잡음과 거짓 신호를 제거하고 거래 잠재력을 높이는 데 도움이 됩니다. 복잡한 지표의 다중 레이어를 사용하여 Atomic Analyst는 차트를 스캔하고 복잡한 수학적 계산을 간단한 신호와 색상으로 변환하여 초보 트레이더가 이해하고 일관된 거래 결정을 내릴 수 있도록합니다. "Atomic Analyst"는 새로운 및 경험이 풍부한 트레이더를위한 종합적인 거래 솔루션입니다. 프리미엄 지표와 최고 수준의 기능을 하나의 거래 전략에 결합하여 모든 종류의 트레이더에 대한 다재다능한 선택지가되었습니다. 인트라데이 거래 및 스캘핑 전략 : 빠르고 정확한 일일
Btmm state engine pro
Garry James Goodchild
5 (4)
BTMM State Engine Pro is a MetaTrader 5 indicator for traders who use the Beat The Market Maker approach: Asian session context, kill zone timing, level progression, peak formation detection, and a multi-pair scanner from a single chart. It combines cycle state logic with a built-in scanner dashboard so you do not need the same tool on many charts at once. What it does Draws the Asian session range; session times can follow broker server offset or be set in inputs. Tracks level progression (L
Trend Screener Pro MT5
STE S.S.COMPANY
4.85 (104)
트렌드 표시기, 트렌드 트레이딩 및 필터링을 위한 획기적인 고유 솔루션, 하나의 도구 안에 내장된 모든 중요한 트렌드 기능! Forex, 상품, 암호 화폐, 지수 및 주식과 같은 모든 기호/도구에 사용할 수 있는 100% 다시 칠하지 않는 다중 시간 프레임 및 다중 통화 표시기입니다. Trend Screener는 차트에 점이 있는 화살표 추세 신호를 제공하는 효율적인 지표 추세 추종 지표입니다. 추세 분석기 표시기에서 사용할 수 있는 기능: 1. 트렌드 스캐너. 2. 최대 이익 분석이 있는 추세선. 3. 추세 통화 강도 측정기. 4. 경고가 있는 추세 반전 점. 5. 경고가 있는 강력한 추세 점. 6. 추세 화살표 Trend Screener Indicator가 있는 일일 분석 예, 일일 신호 성능...등은 여기에서 찾을 수 있습니다. 여기를 클릭하십시오. LIMITED TIME OFFER : Trend Screener Indicator는 50$ 및 평생 동안만 사용할 수 있습니다.
소개       Quantum Breakout PRO   , 브레이크아웃 존 거래 방식을 변화시키는 획기적인 MQL5 지표! 13년 이상의 거래 경험을 가진 숙련된 트레이더 팀이 개발한       퀀텀 브레이크아웃 PRO       혁신적이고 역동적인 브레이크아웃 존 전략으로 거래 여정을 새로운 차원으로 끌어올리도록 설계되었습니다. Quantum Breakout Indicator는 5개의 이익 목표 영역이 있는 브레이크아웃 영역의 신호 화살표와 브레이크아웃 상자를 기반으로 한 손절 제안을 제공합니다. 초보자 거래자와 전문 거래자 모두에게 적합합니다. Quantum EA 채널:       여기를 클릭하세요 중요한! 구매 후 설치 매뉴얼을 받으려면 개인 메시지를 보내주십시오. 추천: 기간: M15 통화쌍: GBPJPY, EURJPY, USDJPY,NZDUSD, XAUUSD 계정 유형: 스프레드가 매우 낮은 ECN, Raw 또는 Razor 브로커 시간: GMT +3 중개인 :
Meridian Pro
Ottaviano De Cicco
5 (1)
Meridian Pro 2.00: Professional Multi-Timeframe Trend Matrix for MT5 Meridian Pro 2.00 is a professional adaptive trend matrix for MetaTrader 5. It combines the original Meridian trend engine, a clean chart ribbon, closed-bar signal arrows, an 8-timeframe dashboard, Fuel momentum, weighted consensus, synthetic HTF processing and chart-native higher-timeframe context lines. The goal is simple: read current trend, multi-timeframe structure, strength, momentum and EA-ready state from one discipline
OmniSync Projection
Antonio-alin Teculescu
5 (1)
Chronos Fractal Engine is an innovative price projection indicator for MetaTrader 5, designed to transform your technical analysis by intelligently identifying and projecting historical price patterns. Built upon an advanced correlation algorithm and the fractal principles of the market, this powerful tool visualizes potential future price movements, giving you a unique edge in your trading decisions. What is Chronos Fractal Engine? At its core, the Chronos Fractal Engine employs a sophisticat
우선적으로, 이 거래 도구는 전문적인 거래에 이상적인 비-다시 그리기 및 지연되지 않는 지표입니다.  온라인 강좌, 사용자 매뉴얼 및 데모. 스마트 가격 액션 컨셉트 인디케이터는 신규 및 경험 많은 트레이더 모두에게 매우 강력한 도구입니다. Inner Circle Trader Analysis 및 Smart Money Concepts Trading Strategies와 같은 고급 거래 아이디어를 결합하여 20가지 이상의 유용한 지표를 하나로 결합합니다. 이 인디케이터는 스마트 머니 컨셉트에 중점을 두어 대형 기관의 거래 방식을 제공하고 이동을 예측하는 데 도움을 줍니다.  특히 유동성 분석에 뛰어나 기관이 어떻게 거래하는지 이해하는 데 도움을 줍니다. 시장 트렌드를 예측하고 가격 변동을 신중하게 분석하는 데 탁월합니다. 귀하의 거래를 기관 전략에 맞추어 시장의 동향에 대해 더 정확한 예측을 할 수 있습니다. 이 인디케이터는 시장 구조를 분석하고 중요한 주문 블록을 식별하고 다양
RelicusRoad Pro MT5
Relicus LLC
5 (24)
RelicusRoad Pro: 퀀트 시장 운영 체제 70% 할인 평생 이용권 (한정 시간) - 2,000명 이상의 트레이더와 함께하세요 왜 대부분의 트레이더는 "완벽한" 지표를 가지고도 실패할까요? 진공 상태에서 단일 개념 만으로 거래하기 때문입니다. 문맥 없는 신호는 도박입니다. 지속적인 승리를 위해서는 컨플루언스(중첩) 가 필요합니다. RelicusRoad Pro는 단순한 화살표 지표가 아닙니다. 완전한 퀀트 시장 생태계 입니다. 독점적인 변동성 모델링을 사용하여 가격이 이동하는 "공정 가치 로드"를 매핑하고, 단순 노이즈와 실제 구조적 돌파를 구분합니다. 추측은 그만두세요. 기관급 로드 로직으로 거래를 시작하세요. 핵심 엔진: "Road" 알고리즘 시스템의 중심에는 시장 상황에 실시간으로 적응하는 동적 변동성 채널인 Road Algo 가 있습니다. 세이프 라인(평형) 과 가격이 수학적으로 반전될 가능성이 높은 확장 레벨 을 투영합니다. Simple Road: 일반적인 시장을 위
Market Structure Patterns
Samuel Manoel De Souza
4.47 (19)
Market Structure Patterns   is an indicator based on   smart money concepts   that displays   SMC/ICT   elements that can take your trading decisions to the next level. Take advantage of the   alerts ,   push notifications   and   email messages   to keep informed from when an element is formed on the chart, the price crosses a level and/or enters in a box/zone. Developers can access the values of the elements of the indicator using the   global variables  what allows the automation of trading
FX Power MT5 NG
Daniel Stein
5 (31)
FX Power: 통화 강세 분석으로 더 스마트한 거래 결정을 개요 FX Power 는 어떤 시장 상황에서도 주요 통화와 금의 실제 강세를 이해하기 위한 필수 도구입니다. 강한 통화를 매수하고 약한 통화를 매도함으로써 FX Power 는 거래 결정을 단순화하고 높은 확률의 기회를 발견합니다. 트렌드를 따르거나 극단적인 델타 값을 사용해 반전을 예측하고자 한다면, 이 도구는 귀하의 거래 스타일에 완벽히 적응합니다. 단순히 거래하지 말고, FX Power 로 더 스마트하게 거래하세요. 1. FX Power가 거래자에게 매우 유용한 이유 통화와 금의 실시간 강세 분석 • FX Power 는 주요 통화와 금의 상대적 강세를 계산하고 표시하여 시장 역학에 대한 명확한 통찰력을 제공합니다. • 어떤 자산이 앞서고 있고 어떤 자산이 뒤처지는지 모니터링하여 보다 현명한 거래 결정을 내릴 수 있습니다. 포괄적인 멀티 타임프레임 뷰 • 단기, 중기 및 장기 타임프레임에서 통화와 금의 강세를
Crystal Heikin Ashi Signals
Muhammad Jawad Shabir
5 (2)
Crystal Heikin Ashi Signals - Professional Trend & Signal Detection Indicator Advanced Heikin Ashi Visualization with Intelligent Signal System for Manual & Automated Trading Final Price: $149 ---------> Price goes up $10 after every 10 sales . Limited slots available — act fast . Overview Crystal Heikin Ashi Signals is a professional-grade MetaTrader 5 indicator that combines pure Heikin Ashi candle visualization with an advanced momentum-shift detection system. Designed for both manual traders
Trend indicator AI mt5
Ramil Minniakhmetov
5 (17)
트렌드 인공 지능 지표는 실행 가능한 진입 점 및 반전 경고와 추세 식별을 결합하여 상인의 시장 분석을 향상시킬 훌륭한 도구입니다. 이 표시기는 사용자가 자신감과 정밀도로 외환 시장의 복잡성을 탐색 할 수 있도록 지원합니다 기본 신호 외에도 트렌드 인공 지능 지표는 풀백 또는 되돌림 중에 발생하는 2 차 진입 점을 식별하여 거래자가 기존 트렌드 내에서 가격 수정을 활용할 수 있도록합니다. 중요한 장점: ·작동 4 및 5 *명확한 구매 또는 판매 신호 *다시 칠하지 않습니다 *모든 자산에서 작동 나는 전보 사기에 개 또는 세트를 판매하지 않도록주의. 모든 설정은 블로그에 여기에 무료.  중요! 지침 및 보너스를 얻기 위해 구입 후 즉시 저에게 연락! 진짜 가동 감시는 뿐 아니라 나의 다른 제품 여기에서 찾아낼 수 있습니다: https://www.mql5.com/en/users/mechanic/seller&nbsp ; 설정 및 입력: 모든 자산에 대해 기본 설정을 권
KT Alpha Hunter Arrows MT5
KEENBASE SOFTWARE SOLUTIONS
대부분의 화살표 인디케이터는 신호만 보여주고, 나머지 판단은 모두 트레이더에게 맡깁니다. KT Alpha Hunter Arrows는 완성된 트레이딩 플랜을 제공합니다. 각 신호 화살표가 표시될 때마다 진입선, 손절선, 네 개의 익절 목표, 그리고 현재 심볼과 시간대가 지금 거래할 가치가 있는지 알려주는 실시간 엣지 판정이 함께 그려집니다. 포함된 Trade Manager EA는 사용자가 직접 진입한 뒤의 실행 관리를 맡아, 시장이 흔들리고 감정이 개입되기 쉬운 상황에서도 거래 원칙을 유지할 수 있도록 도와줍니다. 리페인트 없음. 종가 확정 후 신호만 표시. Forex, Gold, Indices 및 사용자가 거래하는 다양한 MT5 지원 상품에 맞게 설계되었습니다. 주요 기능 캔들이 마감된 후에만 표시되는 리페인트 없는 매수 및 매도 화살표. 각 신호마다 진입선, 구조적 손절선, 네 개의 익절 목표 표시. 현재 차트에서 매수와 매도 셋업을 별도로 평가하는 Edge Dashboard.
ARICoins
Temirlan Kdyrkhan
ARICoin is a powerful trading companion designed to generate high-probability entry signals with dynamic TP/SL/DP levels based on volatility. Built-in performance tracking shows win/loss stats, PP1/PP2 hits, and success rates all updated live. Key Features: Buy/Sell signals with adaptive volatility bands Real-time TP/SL/DP levels based on ATR Built-in MA Filter with optional ATR/StdDev volatility Performance stats panel (Success, Profit/Loss, PP1/PP2) Alerts via popup, sound, push, or email Cust
Current event:  https://c.mql5.com/1/326/A2SR2025_NoMusic.gif MT5용 A2SR 지표: 자동화된 실제 수요 및 공급(S/R). + 거래 상품. Product description in English here. --   Guidance   : -- at   https://www.mql5.com/en/blogs/post/734748/page4#comment_16532516 -- and  https://www.mql5.com/en/users/yohana/blog 더욱 스마트한 거래 결정을 위한 강력하고, 정확하며, 시간 절약적인 기능 + EA 호환 객체. 주요 장점 선행 실제 SR 레벨(지연 또는 재표시 없음) 2014년부터 MT4 에서 수년간 입증된 신뢰성을 바탕으로 A2SR이 이제 MetaTrader 5에서도 사용 가능합니다. 가격이 도달하기 전에 실제 지지선과 저항선을 식별하는 선행적이고 재표시 없는 지표를 통해 트레이더에
Gartley Hunter Multi
Siarhei Vashchylka
5 (11)
Gartley Hunter Multi - An indicator for searching for harmonic patterns simultaneously on dozens of trading instruments and on all possible timeframes. Manual (Be sure to read before purchasing) | Version for MT4 Advantages 1. Patterns: Gartley, Butterfly, Shark, Crab. Bat, Alternate Bat, Deep Crab, Cypher 2. Simultaneous search for patterns on dozens of trading instruments and on all possible timeframes 3. Search for patterns of all possible sizes. From the smallest to the largest 4. All fou
Entry Points Pro for MT5
Yury Orlov
4.48 (138)
다시 색을 칠하지 않고 거래에 진입할 수 있는 정확한 신호를 제공하는 MT5용 지표입니다. 외환, 암호화폐, 금속, 주식, 지수 등 모든 금융 자산에 적용할 수 있습니다. 매우 정확한 추정값을 제공하고 매수와 매도의 가장 좋은 시점을 알려줍니다. 하나의 시그널로 수익을 내는 지표의 예와 함께 비디오 (6:22)시청하십시오! 대부분의 거래자는 Entry Points Pro 지표의 도움으로 첫 거래 주 동안 트레이딩 결과를 개선합니다. 저희의   Telegram Group 을 구독하세요! Entry Points Pro 지표의 좋은점. 재도색이 없는 진입 신호 신호가 나타나고 확인되면(시그널 캔들이 완성된 경우) 신호는 더 이상 사라지지 않습니다. 여타 보조지표의 경우 신호를 표시한 다음 제거되기 때문에 큰 재정적 손실로 이어집니다. 오류 없는 거래 게시 알고리즘을 통해 트레이드(진입 또는 청산)를 할 이상적인 순간을 찾을 수 있으며, 이를 통해 이를 사용하는 모든 거래자의 성공률이
제작자의 제품 더 보기
Identify Trend
Aleksey Ivanov
4.13 (24)
"추세 식별" 표시기는 매우 정확하고 가장 중요한 것은 짧은 지연으로 진정한 추세 움직임의 시작을 확립할 수 있는 강력한 필터링 방법을 사용합니다. 지표는 거래 스캘퍼 전략과 장기 거래 전략 모두에 사용할 수 있습니다.              지표 평균 알고리즘은 마지막 스크린샷에 나와 있습니다.               표시기 판독값은 명확하고 매우 간단하며 설명이 필요하지 않습니다. 지표의 파란색 선은 상승 추세를 표시하고 금색 선은 플랫, 빨간색 선은 하락 추세를 나타냅니다.  빨간색 또는 금색 선이 파란색으로 바뀌면 바이 로트가 열려야 합니다. 파란색 또는 금색 라인이 빨간색으로 변경되면 매도 포지션이 열립니다.         가격 변경 방향의 가능한 순간은 어떤 상황에서도 다시 그려지지 않는 화살표로 표시됩니다. 표시기는 모든 유형의 알림을 포함합니다. 표시 지침(추세 방향에 대한)이 마지막 두 막대에서 일치할 때 경고가 트리거됩니다.     표시기 설
FREE
Absolute Bands
Aleksey Ivanov
4.67 (3)
Principles of construction of the indicator.               The Absolute Bands (AB) indicator is reminiscent of the Bollinger Bands indicator with its appearance and functions, but only more effective for trading due to the significantly smaller number of false signals issued to them. This effectiveness of the Absolute Bands indicator is due to its robust nature.               In the Bollinger Bands indicator, on both sides of the moving average - Ma, there are lines spaced from Ma by the standa
FREE
TrueChannel
Aleksey Ivanov
5 (8)
The TrueChannel   indicator shows us the true price movement channels. This indicator resembles Donchian Channel   in its appearance, but is built on the basis of completely different principles and gives (in comparison with Donchian Channel , which is better just to use to assess volatility) more adequate trading signals.              As shown in the article , the price actually moves in channels parallel to the time axis and jumps abruptly from the previous channels to the subsequ
FREE
Channel Builder
Aleksey Ivanov
4.75 (4)
The Channel Builder (CB) or Ivanov Bands indicator is a broad generalization of the Bollinger Bands indicator. First, in CB, the mean line <X> is calculated using various averaging algorithms. Secondly, the mean deviations calculated by Kolmogorov averaging are plotted on both sides of the middle line <X>.                The middle line <X>, besides the standard SMA, EMA, SMMA and LWMA averaging algorithms, can be Median = (Max + Min) / 2 sliding median (which is the default). In
FREE
Alligator Analysis
Aleksey Ivanov
5 (1)
Indicator description.            The “ Alligator Analysis ” ( AA ) indicator allows you to build various (by averaging types and by scales) “ Alligators ” and their combinations, i.e. allows you to analyze the state of the market based on the correlation of this state with a whole range of different " Alligators ".  The classic " Alligator " by Bill Williams is based on moving averages and Fibonacci numbers, which makes it one of the best indicators now. The classic " Alligator "   is based on
FREE
PDP indicator is used for: defining price probability distributions. This allows for a detailed representation of the channel and its borders and forecast the probability of a price appearing at each segment of its fluctuations; defining the channel change moment. Operation principles and features PDP analyzes a quote history on lower timeframes and calculates a price probability distribution on higher ones. Forecast algorithms allow the indicator to calculate probability distributions and mov
Signal Bands
Aleksey Ivanov
Signal Bands is a sensitive and convenient indicator, which performs deep statistical processing of information. It allows to see on one chart (1) the price trend, (2) the clear price channel and (3) latent signs of trend change. The indicator can be used on charts of any periods, but it is especially useful for scalping due to its high sensitivity to the current market state. The functions of the indicator : First, the Signal Bands indicator draws channels into which all price fluctuations exa
Iterative Moving Average
Aleksey Ivanov
5 (1)
Iterative Moving Average – IMA.   IMA is obtained by correcting the usual   MA.   The correction consists in addition   to MA averaged difference between the time series (X) and its MA, i.e.   IMA(X)=MA(X) + MA ( Х -MA(X)). Correction is done in several iterations (and, exactly, 2 iterations in this indicator) and with a change in the averaging period.               As a result, the time-series points begin to cluster around (on all sides) of the getting   IMA and with a smaller de
Structure of the indicator.               The Cunning crocodile indicator consists of three moving averages (applied to the price   Median price   = (high + low)/2 ) :   1) the usual MA ( SMA , EMA , SMMA ,   LWMA )  or the mean <X> of the process X and her two generalizations 2) <XF> = <X / <X >> * <X> and 3) <XS> = <X * <X >> / <X> with the same averaging period. All three curves intersect at common points that (such an intersection in which the cunning crocodile, unlike the usual one, "never
Sensitive Signal
Aleksey Ivanov
5 (2)
The Sensitive Signal ( SS ) indicator, using the filtering methods  (which includes cluster multicurrency analysis) developed by the author, allows, with a high degree of probability, to establish the beginning of the true (filtered from interference - random price walks) trend movement. It is clear that such an indicator is very effective for trading on the currency exchange , where signals are highly distorted by random noise. The filtration developed by the author is carried out
Profit MACD
Aleksey Ivanov
5 (2)
I present an indicator for professionals. ProfitMACD is very similar to classic MACD in appearance and its functions . However, ProfitMACD is based on completely new algorithms (for example, it has only one averaging period) and is more robust, especially on small timeframes, since it filters random price walks. The classic MACD indicator (Moving Average Convergence / Divergence) is a very good indicator following the trend, based on the ratio between two moving averages, namely the EM
The principle of the indicator.               A simple moving average (SMA) with an averaging period (2n + 1) of bars is always obtained lagging by n bars. If SMA or other types of moving averages are the basis for making trading decisions, then their strong delay does not allow   to open positions in time and close positions, which leads to losses.                            The Estimation moving average without lag ( EMAWL ) indicator calculates the non-lagging moving average, which is calcula
The principle of the indicator.               The Strong Trend Flat Signal (STFS) indicator is the intersection of two, developed by the author, non-lagging moving averages with averaging periods 21 and 63.               A simple moving average (SMA) with an averaging period (2n + 1) of bars is always obtained lagging by n bars. If SMA or other types of moving averages are the basis for making trading decisions, then their strong delay does not allow  to open positions in time and close positio
StatChannel
Aleksey Ivanov
5 (1)
The principle of the indicator.               The StatChannel ( SC ) indicator is a development of the Bollinger Bands indicator ( ВВ ).  BB is a moving average, on both sides of which two lines are drawn, separated from it by standard deviations std multiplied by the corresponding coefficient. At the same time, a moving average with an averaging period (2n + 1) bars is always obtained lagging behind n bars.  Sliding std is also lagging behind on n bars, also calculated by (2n + 1) points. Such
StatPredict
Aleksey Ivanov
Introduction.             The indicator predicts the price in accordance with the prevailing trend  and its own small statistical price fluctuations around this trend. At the same time, in StatPredict , you need to set the time horizon of the forecasted events, which is set by the parameter settings of the “ Length of forecast in bars ” indicator and determined by the characteristic time scale of the current   trend, which is best measured by the ProfitMACD indicator or by the previous price co
Asummetry
Aleksey Ivanov
The principle of the indicator.                             The Asummetry  indicator allows you to predict the beginning of a change in the direction of trends, long before their visual appearance on the price chart.               The author statistically revealed that before changing the direction of the trend, the probability distribution function of the price is made as asymmetric as possible. More precisely, the price movement in any direction always pulls sideways the function of its dist
Indicator is used for: defining price probability distributions. This allows for a detailed representation of the channel and its borders and forecast the probability of a price appearing at each segment of its fluctuations; defining the channel change moment.   Operation principles and features Indicator analyzes a quote history on lower timeframes and calculates a price probability distribution on higher ones. Forecast algorithms allow the indicator to calculate probability distributions and m
Identify Market State
Aleksey Ivanov
5 (1)
The Identify Market State   indicator allows you to set the beginning of a new trends and pullbacks on an existing trend. This indicator can be used both for trading on scalper strategies and for long-term trading strategies.               The indicator is based on the 14 periodic DeMarker   indicator and the 8 periodic simple moving average from this indicator. Statistical studies have shown that the sharp peaks of the DeMarker   indicator curve when they drop below its minimum li
Signal Envelopes
Aleksey Ivanov
The Signal Envelopes   indicator uses the robust filtering method based on: (1) the moving median Buff0 = <Median> = (Max {x} + Min {x}) / 2 and (2) the averaging algorithm developed by the author Buff1 = <(<Median> ) ^ (- 3)> * (<Median>) ^ 4  based on the moving median. The Signal Envelopes   indicator allows you to most accurately and with the minimum possible delay set the beginning of a new trend.  The Signal Envelopes indicator can be used both for trading according to scalpe
Profit Trade
Aleksey Ivanov
The principle of constructing indicator lines .               Profit Trade  indicator is very effective for trading. Profit Trade  is a deep development of the well-known Donchian channel  indicator. The upper (BlueViolet color) Dup and the lower (IndianRed) Ddn lines of the indicator are constructed in the same way as in the Donchian channel , based on the highest (high of High) and lowest (low of Low) prices for the previous n1 = 20 periods. The middle line (Gold) Dm is constructed in the sam
Signal Channel
Aleksey Ivanov
The principle of constructing indicator lines and their meaning .               The Signal Channel   indicator uses a robust filtering method based on two moving medians applicable to the High and Low prices, i.e. the lines <High> and <Low>, where <..> is the sign of linear averaging, which are shifted by certain values ​​in an uptrend and by opposite values ​​in a downtrend, which allows you to get a narrow channel, approximately outlining each bar. Sharp kinks of the lines of such a channel a
Robust Filter
Aleksey Ivanov
5 (1)
The Robust filter   indicator is based on the robust filtering algorithm developed by the author using the multi-period averaged moving median. The algorithm for this averaging is shown in the last screenshot.                The indicator calculates and shows: 1. The direction of the trend; 2. Entry and exit points of positions; 3. StopLoss   lines calculated from current price probability distributions and selected probability of closing an order by StopLoss before the trend revers
Absolute price
Aleksey Ivanov
This   indicator is intended for professionals assessing fundamental market trends.  This indicator calculates the index of any instrument and analyzes it.              The index of the state currency shows the real purchasing power of this currency, and the dynamics of this index shows the dynamics of the economic state of the corresponding state. An analysis of the indices of both currencies included in a currency pair makes it much more reliable to identify the trend of this cur
The Multicurrency Trend Detector ( MTD ) indicator allows you to immediately and on one chart on a selected time interval (extending from a zero bar to a bar set in the settings by the value horizon) determine the presence, direction and strength of trends in all major currencies, as well as assess the reliability of these trends.               This is achieved by calculating indices (non-relative purchasing power) of eight major currencies, namely: AUD, CAD, CHF, EUR, GBP, JPY, NZ
StatZigZag
Aleksey Ivanov
The StatZigZag  indicator looks like a regular ZigZag , but is built on the basis of completely different algorithms. The StatZigZag  indicator is a broken line built from segments of regression lines of different lengths, the beginning of each of which comes from the end of the previous segment. Each regression segment is built until the variance or spread of price around it begins to exceed a certain critical value, after which the construction of this segment ends and the constr
Velocity of price change
Aleksey Ivanov
5 (1)
The Velocity of price change   ( VP ) indicator shows the average rate of price change at those characteristic time intervals where this rate was approximately constant. The robust algorithm used in VP   to smooth out the price from its random jumps, ensures the reliability of the indicator reading, which does not react to simple price volatility and its insignificant movements.             The indicator allows you to track trends and the moments of their reversals , during which t
Casual Channel
Aleksey Ivanov
5 (1)
차트에서 보는 추세가 항상 수익을 올릴 수 있는 추세는 아닙니다. 트렌드에는 두 가지 종류가 있다:  1)   안정적이고 따라서 거래자에게 신뢰할 수 있는 이익을 제공할 수 있는 근본적인 경제적 이유에 의해 야기되는 진정한 추세;  2)    추세처럼 보이지만 일련의 무작위 이벤트로 인해 발생하는 잘못된 추세 섹션 - 가격(주로)을 한 방향으로 이동. 이러한 잘못된 추세 섹션은 짧고 언제든지 방향을 바꿀 수 있습니다(그리고 일반적으로 식별 후 즉시 역전됨).  따라서 잘못된 추세로 돈을 버는 것은 (우연이 아닌) 불가능합니다. 시각적으로 참과 거짓 추세는 처음에는 구별할 수 없습니다. 더욱이 무작위 가격 변동이나 그에 의해 생성된 잘못된 추세는 항상 실제 추세에 중첩되어 특히 실제 추세에서 후퇴를 일으킬 수 있습니다. 그러한 국지적 역전은 새로운 근본적인 경제적 원인에 의해 야기된 글로벌 역전과 식별되고 구별될 필요가 있습니다.              캐주얼
Quality trend
Aleksey Ivanov
5 (1)
The Quality trend indicator expresses the ratio of the strength of a trend or the speed of its growth (fall) to the degree of its noisiness or a certain norm of amplitudes of chaotic fluctuations of a growing (falling) price. The position of the indicator line above zero shows an increasing trend, below zero - a falling trend, the fluctuation of the indicator line near zero shows a flat. If the indicator line begins to fluctuate rapidly around zero and approach it, then this indica
Scientific trade
Aleksey Ivanov
5 (1)
An extremely convenient indicator that truly makes the process of making money on the exchange easy. It is based on the scientifically rigorous theory of the market developed by the author, the beginning of which is presented here .                The full algorithm of this indicator operation is presented in the article .               The indicator calculates the most probable price movement trajectory and displays it on the chart. Based on the predicted price movement trajectory
Firstly , the script estimates how many Mx bars of the chart (on which this script is applied) the future trend will most likely continue and what is its quality. Secondly (and most importantly), the script is an auxiliary tool for the extremely mathematically advanced and extremely effective ScientificTrade indicator in trading. The script calculates the optimal averaging period, which is also equal to Mx, of the ScientificTrade indicator, which gives the maximum profit according to the strate
필터:
Malcolm David Parker
482
Malcolm David Parker 2021.04.22 10:42 
 

I find this indicator very useful for my manual trading

리뷰 답변