Prof MACD
- Indicadores
-
Aleksey Ivanov
 👑 Físico teórico, programador, trader con 15 años de experiencia.
-------------------------------------------------------------------------------
💰 Productos presentados:
1) 🏆 Indicadores con filtrado óptimo de ruidos de mercado (para elegir puntos de apertura y cierre de posiciones). - Versión: 1.0
- Activaciones: 5
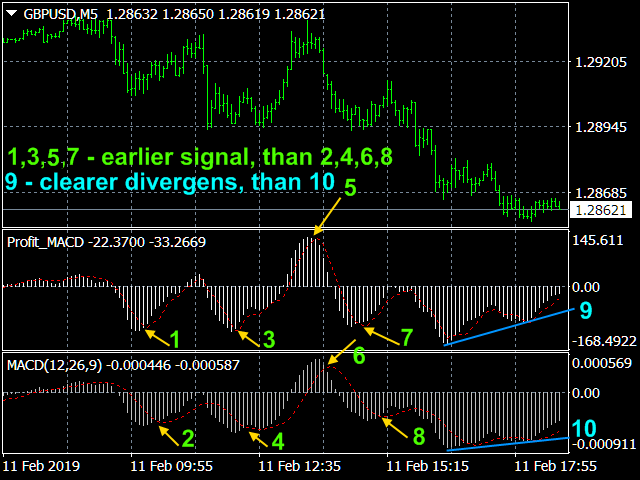
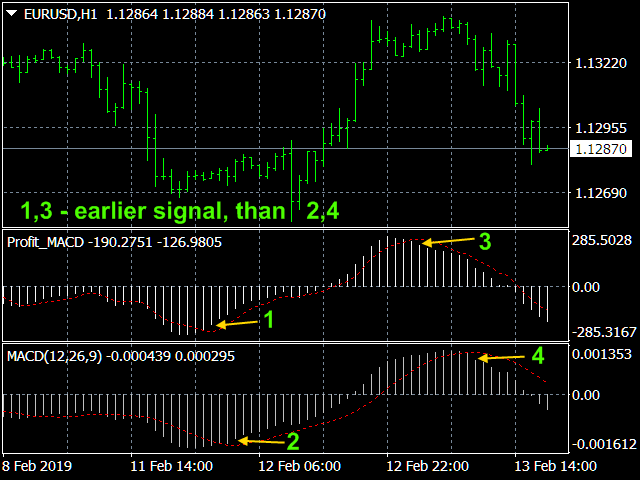
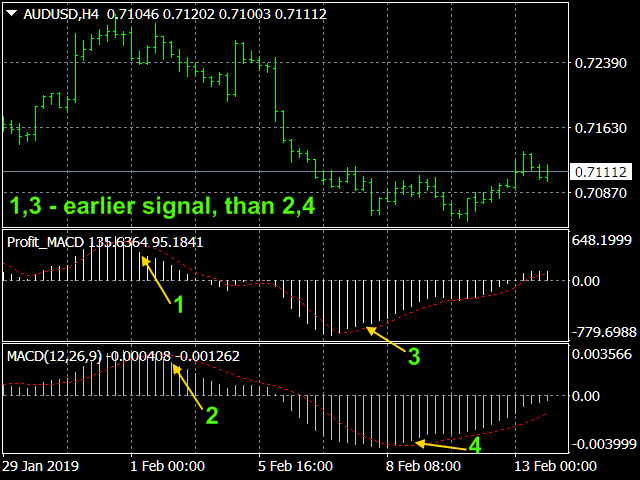
Les presento un indicador para profesionales. Prof MACD es muy similar al MACD clásico en apariencia y en sus funciones. Sin embargo, Prof MACD se basa en algoritmos completamente nuevos (por ejemplo, sólo tiene un periodo de promediación) y es más robusto, especialmente en marcos temporales pequeños, ya que filtra los paseos aleatorios de los precios. El indicador clásico MACD (Moving Average Convergence / Divergence) es un indicador muy bueno de seguimiento de la tendencia, basado en la relación entre dos medias móviles, a saber, la EMA con períodos de 12 y 26, es decir
MACD = EMA(CLOSE, 12) - EMA(CLOSE, 26),
y la línea de señal - media móvil de 9 periodos del propio indicador
SIGNAL = SMA(MACD, 9).
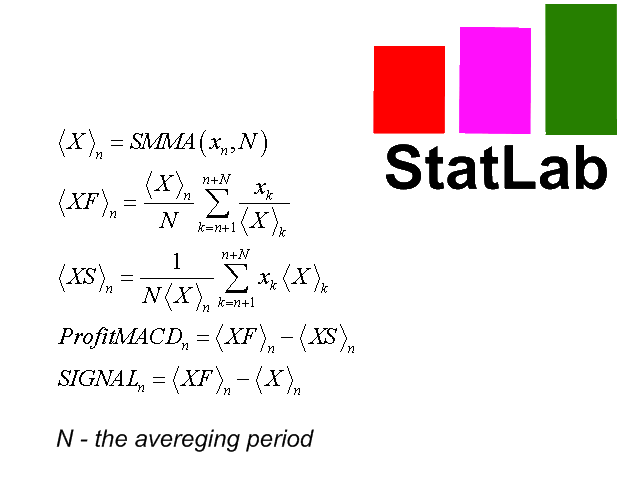
El algoritmo del indicador Prof MACD es mucho más complicado y se muestra en la última captura de pantalla. Prof MACD, al igual que el MACD clásico, es más eficaz cuando el mercado fluctúa con una gran amplitud en el corredor de negociación.
El indicador tiene todo tipo de alertas.
Ventajas del Prof MACD.
-
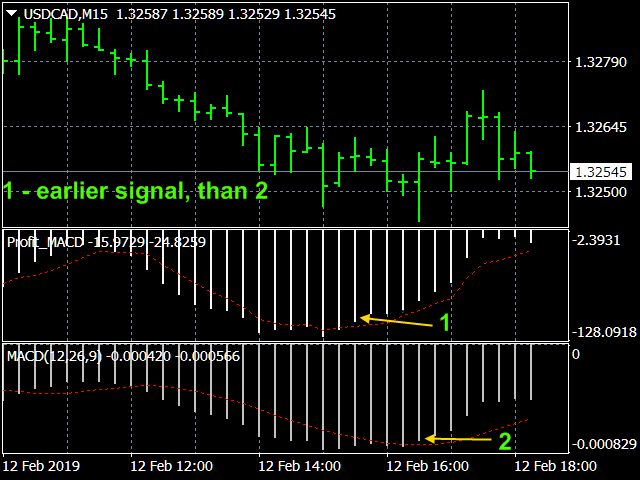
El MACD clásico da muchas señales falsas en timeframes pequeños, dando buenos resultados en gráficos semanales y diarios. Prof MACD trabaja en timeframes de una hora y puede ser bastante preciso incluso en M5, lo que le permite ser utilizado para scalping.
-
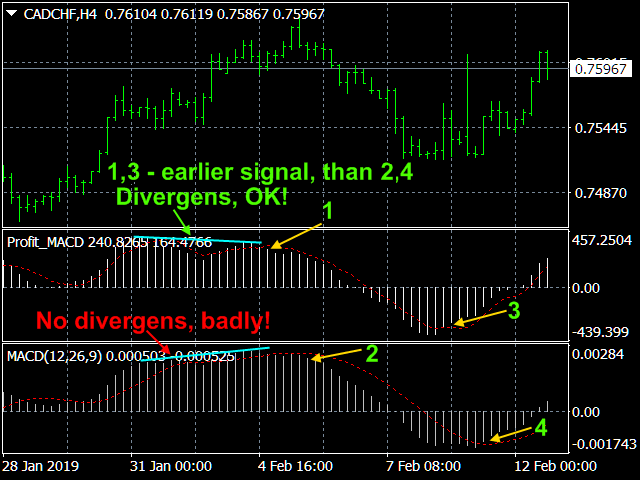
Además, el indicador Prof MACD tiene menos retardo.
-
De acuerdo con el valor de la línea principal Prof MACD, presentado en puntos, puede, si hay una señal, establecer la posición de Take Profit cuando se juega en las oscilaciones dentro del canal. Y cuando se juega por la tendencia en este valor, se puede establecer el valor de Stop Loss.
Prof MACD señales.
Las señales de estos indicadores son: (1) intersecciones, (2) condiciones de sobrecompra / sobreventa, y (3) divergencias.
1.Intersecciones .
Si la línea principal del indicador cae por debajo de la línea de señal, entonces usted debe vender; si se eleva por encima de la línea de señal, comprar.Como señales para comprar / vender, la intersección de la línea principal de la marca cero arriba / abajo también se utiliza.
2. Condiciones de sobrecompra / sobreventa.
Si el indicador es muy alto, el precio es demasiado alto y pronto volverá a un nivel más realista.
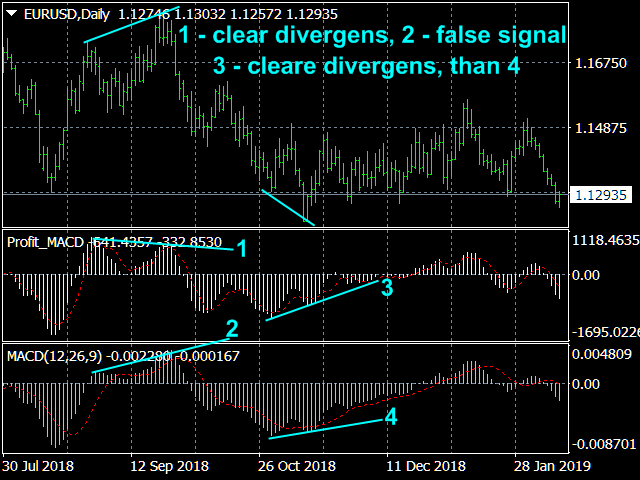
3. Divergencias .
Si un máximo del precio no es confirmado por un máximo más alto en el indicador (divergencia bajista) o viceversa, un mínimo más bajo no es confirmado por un mínimo en el indicador (divergencia alcista), esto significa el final de la tendencia y la posible inversión de la tendencia. Las discrepancias son más significativas si se forman en zonas de sobrecompra / sobreventa.
Configuración del indicador.
- Tipo de precio - precio aplicado. Valores: Precio de cierre (por defecto), Precio de apertura, Precio alto, Precio bajo, Precio medio ((alto + bajo)/2), Precio típico ((alto + bajo + cierre)/3), Precio ponderado ((alto + bajo + 2*cierre)/4).
- El período de promediación - período de promediación. Valores: cualquier número entero(9 por defecto).
- Grosor de la línea principal - Valores: cualquier número entero(1 por defecto).
- Grosor de la línea de señal - Valores : cualquier entero(1 por defecto).
- ¿Datos en puntos de posible beneficio? - ¿Mostrar datos en puntos de posible beneficio? Valores:true (por defecto), false.
- El método de señal - Tipo de alerta de señal de comercio.Valores: No, Enviar alerta, Imprimir (en experto), Comentar (en gráfico), Sonido + Imprimir, Sonido + Comentar, Sonido, Push + Comentar, Push, Mail + Comentar, Mail.
- Número de barras calculadas - Valores: cualquier número entero(300 por defecto).

I find this indicator very useful for my manual trading