Powerful Pivot Point Weekly

Pivot_Point_Weekly — clear, uncluttered weekly pivots for MT5

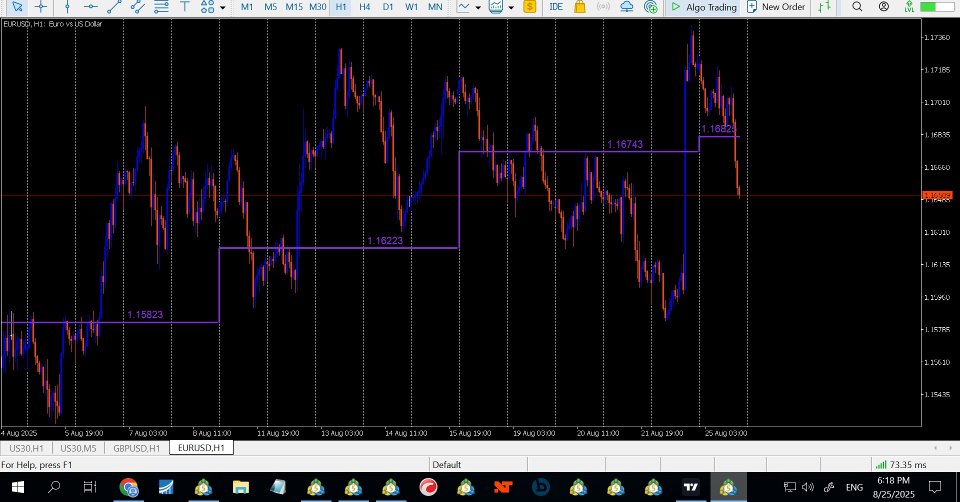
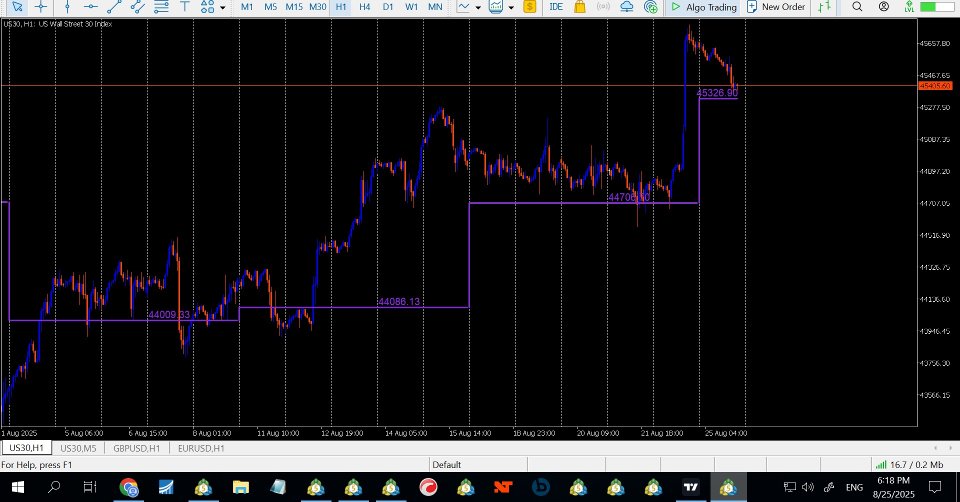
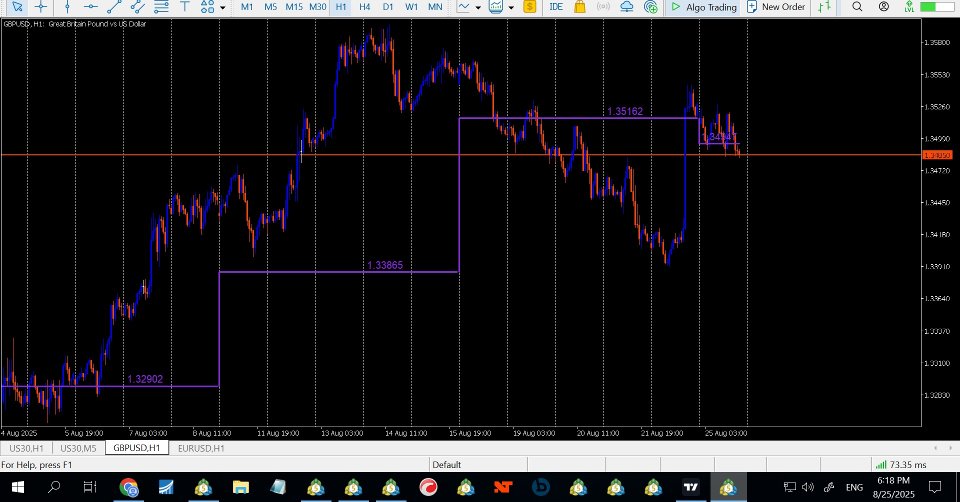
Pivot_Point_Weekly plots one thing and does it exceptionally well: the classic weekly pivot (P) calculated from the previous week’s high, low, and close. It renders each week’s pivot as a clean horizontal “step,” with short, perfectly vertical joins from week to week so you can see the regime shifts at a glance—without cluttering your chart with a forest of levels.

This indicator is intentionally minimalist: no S1/R1 ladders, no fib variations, no autoscaling circus. Just the weekly “balance price” the market respected (or rejected), displayed in a way that works on any timeframe and for any symbol you trade.

What is a weekly pivot—and why it matters

A pivot point is a simple average of price that old-school floor traders used to map out the day’s likely “balance” area. The classic formula is:

Pivot (P) = (High + Low + Close) / 3

While this calculation is typically applied to the previous day for intraday trading, many swing traders and systematic intraday traders rely on the previous week’s pivot. Weekly pivots have a few advantages:

  • Noise reduction: Weekly data smooths the random chop you often get on daily pivots.

  • Institutional rhythm: Many funds and desks rebalance and reassess on weekly cycles. Prior-week balance levels often act as “gravity.”

  • Context on lower timeframes: On M1–H1 charts, the weekly pivot acts like a slow, steady mean—great for confluence.

In practice, the weekly pivot behaves like a fair-value magnet. Price often mean-reverts toward it when stretched, or it uses it as an intrawEEK “spine” during trends.

What makes this indicator different

  • Only the essential level: Plots the previous-week classic pivot (P)—nothing else—so your eye isn’t distracted by five support/resistance tiers you don’t plan to trade.

  • Step-style rendering: Each week is a crisp horizontal segment; between weeks you get a short vertical join. The result looks like a “snake” that moves only when the underlying weekly balance changes—perfect for regime reading.

  • Time-aware starts: A Start Offset (minutes) lets you align the Monday boundary to the market you trade (e.g., indices with a Sunday micro-session). No more “half Sundays” bleeding into your week.

  • Labelled prices: Each step carries its price label above the line so you always know the exact level.

  • Broker-agnostic week separators: The indicator picks Monday opens from D1 data and draws weekly bars from W1 to compute pivots, keeping boundaries stable.

  • Ultra-light: Uses chart objects (trend lines and text) rather than heavy buffers or recalcs. It idles quietly and refreshes on a short timer or on new weekly data.

Inputs (defaults shown)

  • Weeks to draw ( InpLookbackWeeks = 52 )
    How many weekly steps to render back in time.

  • Color ( InpColor = BlueViolet )
    The line + label color. Keep it high-contrast against your chart.

  • Line & join width ( InpLineWidth = 3 )
    Thickness of both horizontals and the short vertical joins.

  • Price label font size ( InpFontSize = 10 )
    Font size for the pivot price printed above each line.

  • Price label offset (points) ( InpTextOffsetPoints = 10.0 )
    How far above the line the label sits (in symbol points).

  • Draw current week to NOW / Next Monday ( InpExtendToNextMon = false )

    • false (default): The current week’s step draws only up to “now.”

    • true: The current week’s step draws all the way to next Monday—handy for cleaner screenshots or forward planning.

  • Start offset (minutes) ( InpStartOffsetMin = 60 )
    Shifts the Monday boundary forward by N minutes.

    • Indices / CFDs with Sunday micro-sessions: 60 is a sensible default to avoid starting the week at an illiquid Sunday print.

    • FX: 0 is often fine (use broker time).

  • Auto-recheck every N seconds ( InpRebuildSecs = 3 )
    Micro-refresh cadence. Lightweight; leave it as is unless you want it slower.

Note: We removed miscellaneous “status labels” from both the code and the inputs so the user window is cleaner and clients can’t break anything by toggling non-essential switches.

Quick start

  1. Attach the indicator to any chart and timeframe (it’s timeframe-agnostic).

  2. If you trade US30/US100/US500 or cash indices, keep Start Offset = 60 to ignore the thin Sunday (broker-time dependent).

  3. If you trade FX, set Start Offset = 0 unless your broker’s “Monday” opens awkwardly early.

  4. Decide whether you want the current week’s line to run to now (default) or to next Monday (aesthetics/screenshots).

  5. Keep the default BlueViolet, width 3 unless your theme demands otherwise.

You’ll see a ladder of horizontal steps—each the prior week’s pivot—with tight vertical hops between them. The price label sits just above each step.

How to use the weekly pivot in practice

Think of the weekly pivot as both context and actionable level.

1) Mean reversion “back to fair value”

  • When price stretches far from the weekly P and momentum stalls (e.g., lower-timeframe divergence, exhaustion wicks), a rotation back toward P is common.

  • Entries: look for confirmation on your chosen lower timeframe (e.g., M15/M5 structure break) in the direction of the move back to P.

  • Exits: partial near P, trail the rest in case it “overshoots and hugs.”

2) Trend alignment (use P as a spine)

  • In strong directional weeks, price may ride one side of P.

  • Use the pivot as a dynamic bias filter: bias long above P, short below P—but demand structure confirmation; don’t use P alone.

3) Pullback-to-pivot continuation

  • In uptrends: watch for a pullback to P that holds and flips back up—often a high-R multiple entry.

  • In downtrends: mirror logic from above.

4) Opening drive / weekly reprice

  • Monday–Tuesday often see a decisive push away from last week’s balance.

  • If the new week blasts through P and holds, don’t fight it; treat P as broken structure, and look for continuation trades in the break direction.

5) Confluence with other structure

  • Weekly P + HTF levels (prior weekly high/low), VWAP, session opens, or round numbers strengthens the zone.

  • One clean level + one clean trigger > three noisy indicators.

Pro tip: Use the vertical joins as mental “regime switches.” Large vertical hops from week to week signal a meaningful shift in weekly balance—be slower fading those.

Why weekly instead of daily pivots?

  • Cleaner signal: Daily pivots are popular but can be very reactive (and noisy) in fast markets. Weekly pivots update less often and reveal the bigger mean.

  • Fewer fake-outs: Weekly pivots aren’t whipsawed by a single unexpected news candle the way daily pivots can be.

  • Better for swing and structured intraday: If you plan trades over multiple sessions, weekly pivots give you a durable backbone.

If you love daily pivots, keep them—but add the weekly P for higher-timeframe context. Many traders find the combo reduces overtrading and improves target selection.

Settings playbook by market

  • US indices (cash CFDs): Start Offset = 60 (or 90) often lines the “Monday start” with the meaningful cash-session handoff on your broker.

  • FX majors: Start Offset = 0 . If your broker’s Monday D1 candle includes a tiny Sunday sliver that skews your week, try 30–60.

  • Crypto: Because markets run 24/7, weekly boundaries matter even more. Keep Offset = 0 ; use the weekly P as your “week spine.”

Risk and trade management ideas

  • Stops: Don’t hide stops on the pivot. Place them beyond the structure you’re trading (e.g., above a swing high if shorting a failure to reclaim P).

  • Targets: For mean-revert trades, P itself is a rational first target. In trend trades, P can be the entry or add-on trigger rather than the target.

  • Sizing: Weekly pivots are HTF levels—give your trades breathing room or drop to a lower timeframe for precision entries.

  • News: Weekly pivots survive most single data releases, but major macro events (CPI, NFP, FOMC, central bank) can reset behavior around the pivot. Have a rule.

Common mistakes to avoid

  • Treating P as a wall: The pivot is not a brick wall. It’s a balance estimate. Price often travels through it, pauses, then chooses a side.

  • Ignoring context: Always ask, “Are we trending or balancing?” The same level behaves differently in each regime.

  • Overfitting offsets: Use Start Offset to fix obvious boundary issues, not to cherry-pick a perfect backtest.

  • Stacking indicators: Simplicity is the edge here. One clean level + clear price action usually beats five conflicting tools.

Installation & usage notes (MT5)

  1. Copy Pivot_Point_Weekly.mq5 to MQL5/Indicators/ and compile.

  2. Drag Pivot_Point_Weekly from the Navigator onto any chart.

  3. Configure Start Offset for your symbol type (60 for indices, 0 for FX is a good baseline).

  4. Set Extend to Next Monday to true if you want a full-length current week line for screenshots; otherwise leave at false.

  5. Keep Lookback = 52 unless you need fewer steps for visual clarity.

The indicator self-updates on a short timer and on new weekly bars. It’s extremely light; you can run it on your main workspace without lag.

Under the hood (for the curious)

  • Weekly pivot values come from W1 data: P = (H + L + C) / 3 using the previous week’s OHLC.

  • Weekly boundaries (the step start/stop) are aligned via D1 Mondays, then shifted by your Start Offset (minutes) to suit instruments with off-hours trading or Sunday micro-sessions.

  • Steps are drawn as trend objects (no rays), joins are perfectly vertical (both points at the same timestamp), and labels are text objects placed just above each step with your chosen offset.

Example workflows

  • Scalper who respects HTF: Trade your usual M1–M5 triggers, but check: are we above or below weekly P? Fade trades against P only with exceptional structure; otherwise, let P be your “risk-on/off” switch.

  • Intraday mean-revert: When price stretches away from P during London/NY and stalls, hunt reversions into P. Exit partial at P; keep a runner for an overshoot.

  • Swing alignment: On H4/D1, if price reclaims P early in the week and the vertical join shows a sizable upward shift from last week, set a bullish bias until proven otherwise.

FAQ

Does it repaint?
No. Each weekly pivot is fixed once the prior week closes. The current week’s line length grows with time (if you set “to now”), but the value for that week does not change once it’s defined.

Why don’t you draw S1/R1 etc.?
Clarity. Many traders only use the weekly P for context and a single actionable level. If you want a full ladder, you can stack a separate S/R indicator on top—but most find the chart cleaner (and decision-making faster) with just P.

My broker’s “Monday” seems odd. What should I do?
Use Start Offset. If your Monday begins on a Sunday micro-session, add 30–90 minutes so the first “Monday” time slice lines up with the deeper-liquidity open. The default 60 suits many index CFDs.

What if I want screenshots without the line cutting off mid-week?
Set Extend to Next Monday = true. That draws the current step forward to the next Monday boundary (great for product cards or documentation).

A few trading tips

  • Combine the weekly pivot with last week’s high/low. When P sits near that range mid-point, expect balance; when the new week opens far from P, expect reprice toward it (or a strong hold away from it).

  • Use time-of-day/session. A reclaim of P during the NY cash session carries different weight than a reclaim at 2 a.m. your broker time.

  • Keep a journal of how your instrument behaves relative to P. Every market has quirks. Some hug the weekly pivot for hours; others treat it as a launchpad.

  • Risk first. Pivots are tools, not guarantees. Size modestly and let structure, not hope, decide your exit.


Pivot_Point_Weekly gives you the weekly market “fair value” in the cleanest possible way: one level per week, drawn as an easy-to-read step, labeled, and aligned to sensible week boundaries.

Recommended products
Owl Smart Levels MT5
Sergey Ermolov
3.93 (30)
MT4 version  |   FAQ The Owl Smart Levels Indicator is a complete trading system within the one indicator that includes such popular market analysis tools as Bill Williams' advanced fractals , Valable ZigZag which builds the correct wave structure of the market, and Fibonacci levels which mark the exact levels of entry into the market and places to take profits. Detailed description of the strategy Instructions for working with the indicator Advisor-assistant in trading Owl Helper Private User
The Trend Catcher: The Trend Catcher Strategy with Alert Indicator is a versatile technical analysis tool that aids traders in identifying market trends and potential entry and exit points. It features a dynamic Trend Catcher Strategy , adapting to market conditions for a clear visual representation of trend direction. Traders can customize parameters to align with their preferences and risk tolerance. The indicator assists in trend identification, signals potential reversals, serves as a trail
FREE
Free automatic Fibonacci is an indicator that automatically plots a Fibonacci retracement based on the number of bars you select on the BarsToScan setting in the indicator. The Fibonacci is automatically updated in real time as new highest and lowest values appears amongst the selected bars. You can select which level values to be displayed in the indicator settings. You can also select the color of the levels thus enabling the trader to be able to attach the indicator several times with differe
FREE
The indicator detects and displays М. Gartley's Butterfly pattern. The pattern is plotted by the extreme values of the ZigZag indicator (included in the resources, no need to install). After detecting the pattern, the indicator notifies of that by the pop-up window, a mobile notification and an email. The pattern and wave parameters are displayed on the screenshots. The default parameters are used for demonstration purposes only in order to increase the amount of detected patterns. Parameters z
Overview Harmonic Patterns MT5 is a technical analysis indicator designed for the MetaTrader 5 platform. It identifies and displays harmonic price patterns, such as Butterfly, Cypher, Crab, Bat, Shark, and Gartley, in both bullish and bearish directions. The indicator calculates key price levels, including entry, stop loss, and three take-profit levels, to assist traders in analyzing market movements. Visual elements and customizable alerts enhance usability on the chart. Features Detects six ha
This is an MTF indicator of support and resistance levels based on Advanced ZigZag Dynamic and/or Extended Fractals indicator extremums with price labels (can be disabled). More higher TFs can be selected for MTF mode. By default, the levels are generated based on ZigZag indicator dots. Fractals indicator dots can also be used together with ZigZag or instead of it. In order to simplify the use and save CPU time, calculation is performed once per each bar at its opening. Parameters: ForcedTF - ch
Noize Absorption Index - is the manual trading system that measures the difference of pressure between bears forces and bulls forces. Green line - is a noize free index that showing curent situation. Zero value of index shows totally choppy/flat market.Values above zero level shows how powerfull bullish wave is and values below zero measures bearish forces.Up arrow appears on bearish market when it's ready to reverse, dn arrow appears on weak bullish market, as a result of reverse expectation.
MSnR Lines
Pierre Paul Amoussou
MSnR Lines is a custom indicator designed to display Support and Resistance levels on a chart. These levels are based on Malaysian Support and Resistance theory, which defines levels not as areas but as specific price levels derived from line chart peaks and valleys. Features: Three types of levels: A-Level, V-Level, and Gap Level. Freshness indication for levels: Fresh levels are more significant than unfresh levels. Customizable color and style for fresh and unfresh levels. Option to display o
Auto Optimized RSI   is a smart and easy-to-use arrow indicator designed for precision trading. It automatically finds the most effective RSI Buy and Sell levels for your selected symbol and timeframe using real historical data simulations. The indicator can be used as a standalone system or as part of your existing trading strategy. It is especially useful for intraday trading. Unlike traditional RSI indicators that rely on fixed 70/30 levels,   Auto Optimized RSI   dynamically adjusts its lev
**   All Symbols   x   All Timeframes   scan just by pressing scanner button ** Discount: The price is $50$, But now it is just $35, Limited time offer is active. *** Contact me  to send you instruction and add you in "Trend Reversal group" for sharing or seeing experiences with other users. Introduction: Trendlines are the most famous technical analysis in trading . Trendlines continually form on the charts of markets across all the different timeframes providing huge opportunities for traders
Mine Farm
Maryna Kauzova
Mine Farm is one of the most classic and time-tested scalping strategies based on the breakdown of strong price levels. Mine Farm is the author's modification of the system for determining entry and exit points into the market... Mine Farm - is the combination of great potential with reliability and safety. Why Mine Farm?! - each order has a short dynamic Stop Loss - the advisor does not use any risky methods (averaging, martingale, grid, locking, etc.) - the advisor tries to get the most
Premium level is a unique indicator with more than 80% accuracy of correct predictions! This indicator has been tested for more than two months by the best Trading Specialists! The author's indicator you will not find anywhere else! From the screenshots you can see for yourself the accuracy of this tool! 1 is great for trading binary options with an expiration time of 1 candle. 2 works on all currency pairs, stocks, commodities, cryptocurrencies Instructions: As soon as the red arrow app
Trade smarter, not harder: Empower your trading with Harmonacci Patterns This is arguably the most complete harmonic price formation auto-recognition indicator you can find for the MetaTrader Platform. It detects 19 different patterns, takes fibonacci projections as seriously as you do, displays the Potential Reversal Zone (PRZ) and finds suitable stop-loss and take-profit levels. [ Installation Guide | Update Guide | Troubleshooting | FAQ | All Products ] It detects 19 different harmonic pri
LT Rainbow Trend
Thiago Duarte
5 (1)
Do you, like me, like to trade with the trend? Then this indicator will help you! Rainbow Trend is a trend indicator, which uses several Moving Averages on the chart. It measures different trend strenght zones for different periods: very long term, long term, mid term, short term and very short term. Each zone has its color, and it is possible to have sound alert when the prices leaves a zone and enters another. Its configuration is very simple. If you find any bug or have any suggestions, conta
The standard Bollinger Bands indicator has been improved by integrating additional indications from the Standard Deviation indicator (StdDev), which gives an additional filter for confirming trading signals. In addition, the color of the indicator's lines shows the beginning of a trend, its development and exhaustion. This indicator has a signal block that notifies the trader of the beginning of the trend on any time frame to which it is attached. Settings Type of messages - select the type of
PZ Support Resistance MT5
PZ TRADING SLU
3.71 (7)
Unlock key market insights with automated support and resistance lines Tired of plotting support and resistance lines? This is a multi-timeframe indicator that detects and plots supports and resistance lines in the chart with the same precision as a human eye would. As price levels are tested over time and its importance increases, the lines become thicker and darker, making price leves easy to glance and evaluate. [ Installation Guide | Update Guide | Troubleshooting | FAQ | All Products ] Boos
Fibonacci Progression with Breaks Indicator MT5 Fibonacci Progression with Breaks Indicator MT5 interprets market price shifts incrementally, following the principles of the Fibonacci sequence. This technical indicator initiates from a key pivot and plots Fibonacci-based price zones aligned with the prevailing trend direction. Additionally, it highlights trade opportunities by displaying green and red arrows to indicate potential buy or sell setups. «Indicator Installation & User Guide» MT5 Ind
FREE
Double HMA MTF for MT5
Pavel Zamoshnikov
4 (4)
This is an advanced multi-timeframe version of the popular Hull Moving Average (HMA) Features Two lines of the Hull indicator of different timeframes on the same chart. The HMA line of the higher timeframe defines the trend, and the HMA line of the current timeframe defines the short-term price movements. A graphical panel with HMA indicator data from all timeframes at the same time . If the HMA switched its direction on any timeframe, the panel displays a question or exclamation mark with a tex
Terra Infinity is a flat indicator. This improved version of the CalcFlat indicator has three additional lines that significantly increase its effectiveness. Unlike its predecessor with two static levels, Terra Infinity adds three dynamic lines above the main histogram, which are interpreted as follows: base signal line, minimum signal line, maximum signal line. These lines are formed using the additional parameter Avg, which is the average value of the histogram. Averaging produces a line cl
STRICTLY FOR BOOM INDEX ONLY!!!!! Here I bring the Maximum Trend Arrows OT1.0 MT5 indicator. This indicator is made up of a combination of different trend indicators for entries and exits, for entries an orange arrow will paint on the chart below the current market and a red flag for closing of trades and it produces buy arrows only. When the orange arrow appears, it will appear along with it's sound to notify you. The 1H timeframe is recommended, don't use it anywhere else than on the 1H timefr
The RSI Divergence + FVG Signal indicator combines Relative Strength Index (RSI) Divergence with Fair Value Gap (FVG) detection to generate high-probability buy and sell signals based on both momentum shifts and institutional imbalance zones. Core Features: RSI Divergence Detection : Identifies both regular and hidden bullish/bearish divergences between price and RSI. Divergences indicate potential trend reversals or continuation. FVG Zone Recognition : Detects Fair Value Gaps (imbalances caused
Donchian Channel DC is the indicator of Donchian Channels, that plots maximum and minimum values of a specific period, besides mean value line. It´s possible to configure simple period for analysis and the indicator will plot all three values. You can trade with this indicator as trend or reversal, according to each strategy. Do not let to test others indicators as soon as others expert advisors.
Fibonacci Auto
Makarii Gubaydullin
Automatically plots Fibo levels, based on the High & Low prices from the specified time frame Multiple bars   may be united: e.g. you can get a Fibo based on the 10-days Highs and Lows My   #1   Utility : 66+ features, including this indicator  |   Contact me  for any questions  |    MT4 version Helps to see potential reversal levels; Patterns formed at the Fibo levels tend to be stronger; Significantly   reduces   the   time   spent   on   manual  plotting ; Settings: Timeframe to calculate the
Statistical Arbitrage Spread Generator for Cointegration [MT5] What is Pair Trading? Pair trading is a market-neutral strategy that looks to exploit the relative price movement between two correlated assets — instead of betting on the direction of the market. The idea? When two assets that usually move together diverge beyond a statistically significant threshold, one is likely mispriced. You sell the expensive one, buy the cheap one , and profit when they converge again. It’s a statistica
FREE
Unlock the power of Fibonacci with our advanced indicator! This tool precisely plots Fibonacci levels based on the previous day's high and low, identifying the next day's key support and resistance levels. Perfect for day trading and swing trading, it has consistently generated weekly profits for me. Elevate your trading strategy and seize profitable opportunities with ease. NOTE: In the Input section make sure the draw labels are set to "True" so you can see each levels.
Anti Crab Harmonic Pattern Indicator for MT5 The Anti Crab Harmonic Pattern Indicator on MetaTrader 5 uses specific Fibonacci ratios—such as 0.618, 1.27, and 2.27—to accurately pinpoint potential price reversal zones. It visually displays bullish patterns in red and bearish patterns in blue. «Indicator Installation & User Guide» MT5 Indicator Installation  | Anti Crab Harmonic Pattern Indicator MT4 | ALL Products By  TradingFinderLab  | Best MT5 Indicator:  Refined Order Block Indicator for MT 5
FREE
Welcome to the Ultimate Harmonic Patterns recognition indicator that is focused to detect advanced patterns. The Gartley pattern, Bat pattern, and Cypher pattern  are popular technical analysis tools used by traders to identify potential reversal points in the market. Our Ultimate Harmonic Patterns recognition Indicator is a powerful tool that uses advanced algorithms to scan the markets and identify these patterns in real-time. With our Ultimate Harmonic Patterns recognition Indicator, you ca
Development of the previous version of the indicator ZigZag WaveSize MT4 ZigZag WaveSize - modified standard ZigZag indicator with added information about wave length in points, levels, and different alert logic General Improvements: Code adaptation for MetaTrader 5 Optimized work with graphical objects New Features: Horizontal levels at extremes Selection of level types: horizontal/rays/segments Filter for liquidity levels (not broken by price) Buffer for breakouts: adjusting sensitivity to f
FREE
Master head and shoulders patterns for better trading decisions A head and shoulders pattern is a chart formation that resembles a baseline with three peaks, the outside two are close in height and the middle is highest. It predicts a bullish-to-bearish trend reversal and is believed to be one of the most reliable trend reversal patterns. It is one of several top patterns that signal, with varying degrees of accuracy, that a trend is nearing its end.  [ Installation Guide | Update Guide | Troub
HMA Trend Professional MT5
Pavel Zamoshnikov
4.25 (4)
Improved version of the free HMA Trend indicator (for MetaTrader 4) with statistical analysis. HMA Trend is a trend indicator based on the Hull Moving Average (HMA) with two periods. HMA with a slow period identifies the trend, while HMA with a fast period determines the short-term movements and signals in the trend direction. The main differences from the free version: Ability to predict the probability of a trend reversal using analysis of history data. Plotting statistical charts for analyzi
Buyers of this product also purchase
Divergence Bomber
Ihor Otkydach
4.98 (61)
Each buyer of this indicator also receives the following for free: The custom utility "Bomber Utility", which automatically manages every trade, sets Stop Loss and Take Profit levels, and closes trades according to the rules of this strategy Set files for configuring the indicator for various assets Set files for configuring Bomber Utility in the following modes: "Minimum Risk", "Balanced Risk", and "Wait-and-See Strategy" A step-by-step video manual to help you quickly install, configure, and s
Grabber System MT5
Ihor Otkydach
5 (15)
Let me introduce you to an excellent technical indicator – Grabber, which works as a ready-to-use "All-Inclusive" trading strategy. Within a single code, it integrates powerful tools for technical market analysis, trading signals (arrows), alert functions, and push notifications. Every buyer of this indicator also receives the following for free: Grabber Utility for automatic management of open orders Step-by-step video guide: how to install, configure, and trade with the indicator Custom set fi
Trend Screener Pro MT5
STE S.S.COMPANY
4.87 (90)
Unlock the Power of Trends Trading with the Trend Screener Indicator: Your Ultimate Trend Trading Solution powered by Fuzzy Logic and Multi-Currencies System! Elevate your trading game with the Trend Screener, the revolutionary trend indicator designed to transform your Metatrader into a powerful Trend Analyzer. This comprehensive tool leverages fuzzy logic and integrates over 13 premium features and three trading strategies, offering unmatched precision and versatility. LIMITED TIME OFFER : Tre
Gold Stuff mt5
Vasiliy Strukov
4.92 (189)
Gold Stuff mt5 is a trend indicator designed specifically for gold and can also be used on any financial instrument. The indicator does not redraw and does not lag. Recommended time frame H1. Contact me immediately after the purchase to get   personal bonus!  You can get a free copy of our Strong Support and Trend Scanner indicator, please pm. me! Settings  and manual   here  Please note that I do not sell my EA's or special sets on telegram, it is only available on Mql5 and my set files are on
Trend indicator AI mt5
Ramil Minniakhmetov
5 (7)
Trend Ai indicator  mt5 is great tool that will enhance a trader’s market analysis by combining trend identification with actionable entry points and reversal alerts.  This indicator empowers users to navigate the complexities of the forex market with confidence and precision Beyond the primary signals, Trend Ai indicator identifies secondary entry points that arise during pullbacks or retracements, enabling traders to capitalize on price corrections within the established trend. Important Advan
Quantum TrendPulse
Bogdan Ion Puscasu
5 (13)
Introducing Quantum TrendPulse , the ultimate trading tool that combines the power of SuperTrend , RSI , and Stochastic into one comprehensive indicator to maximize your trading potential. Designed for traders who seek precision and efficiency, this indicator helps you identify market trends, momentum shifts, and optimal entry and exit points with confidence. Key Features: SuperTrend Integration: Easily follow the prevailing market trend and ride the wave of profitability. RSI Precision: Detect
Support And Resistance Screener Breakthrough unique Solution With All Important levels analyzer and Markets Structures Feature Built Inside One Tool ! Our indicator has been developed by traders for traders and with one Indicator you will find all Imporant market levels with one click. LIMITED TIME OFFER : Support and Resistance Screener Indicator is available for only 50 $ and lifetime. ( Original price 125$ ) (offer extended) The available tools ( Features ) in our Indicator are :  1. HH-LL S
AriX
Temirlan Kdyrkhan
1 (1)
AriX Indicator for MT5 A powerful trend-following and signal-evaluation tool AriX is a custom MT5 indicator that combines Moving Averages and ATR-based risk/reward logic to generate clear buy/sell signals. It visualizes dynamic SL/TP levels, evaluates past trade outcomes, and displays win/loss statistics in a clean on-chart panel. Key features include: Buy/Sell signals based on MA crossovers ATR-based SL/TP1/TP2/TP3 levels with visual lines and labels Signal outcome tracking with real-time stat
***  Entry In The Zone and SMC Multi Timeframe is a real-time market analysis tool developed based on the Smart Money Concepts (SMC) framework. It automatically analyzes reversal points and key zones across multiple timeframes, with a focus on providing no repaint signals and highlighting Points of Interest (POI). Additionally It also features an Auto Fibonacci Level System that automatically draws Fibonacci lines to help detect pullback and reversal points instantly. Most importantly, the sign
ARIPoint
Temirlan Kdyrkhan
ARIBot is a powerful trading companion designed to generate high-probability entry signals with dynamic TP/SL/DP levels based on volatility. Built-in performance tracking shows win/loss stats, PP1/PP2 hits, and success rates — all updated live. Key Features: Buy/Sell signals with adaptive volatility bands Real-time TP/SL/DP levels based on ATR Built-in MA Filter with optional ATR/StdDev volatility Performance stats panel (Success, Profit/Loss, PP1/PP2) Alerts via popup, sound, push, or email Cus
How many times have you bought a trading indicator with great back-tests, live account performance proof with fantastic numbers and stats all over the place but after using it, you end up blowing your account? You shouldn't trust a signal by itself, you need to know why it appeared in the first place, and that's what RelicusRoad Pro does best! User Manual + Strategies + Training Videos + Private Group with VIP Access + Mobile Version Available A New Way To Look At The Market RelicusRoad is the
Matrix Arrow Indicator MT5
Juvenille Emperor Limited
5 (14)
Matrix Arrow Indicator MT5  is a unique 10 in 1 trend following   100% non-repainting  multi-timeframe indicator that can be used on all symbols/instruments:   forex,   commodities,   cryptocurrencies,   indices,   stocks .  Matrix Arrow Indicator MT5  will determine the current trend at its early stages, gathering information and data from up to 10 standard indicators, which are: Average Directional Movement Index (ADX) Commodity Channel Index (CCI) Classic Heiken Ashi candles Moving Average
FX Volume MT5
Daniel Stein
4.84 (19)
FX Volume: Experience Genuine Market Sentiment from a Broker’s Perspective Quick Overview Looking to elevate your trading approach? FX Volume provides real-time insights into how retail traders and brokers are positioned—long before delayed reports like the COT. Whether you’re aiming for consistent gains or simply want a deeper edge in the markets, FX Volume helps you spot major imbalances, confirm breakouts, and refine your risk management. Get started now and see how genuine volume data can
TPSproTREND PrO MT5
Roman Podpora
4.64 (14)
Entry points at the bar close,  without redrawing .  Trend scanner  across all assets,  MTF - mode  and much more in one tool. We recommend using it together with   RFI LEVELS. ИНСТРУКЦИЯ RUS   /   INSTRUCTIONS  ENG         /         VERSION MT4   Main functions: Accurate entry signals WITHOUT REPAINTING! Once a signal appears, it remains valid! This is a significant distinction from repainting indicators that might provide a signal and then alter it, potentially leading to deposit losses. Now,
ACB Breakout Arrows MT5
KEENBASE SOFTWARE SOLUTIONS
5 (1)
The ACB Breakout Arrows indicator provides a crucial entry signal in the market by detecting a special breakout pattern. The indicator constantly scans the chart for a settling momentum in one direction and provide the accurate entry signal right before the major move. Get multi-symbol and multi-timeframe scanner from here - Scanner for ACB Breakout Arrows MT 5 Key features Stoploss   and Take Profit levels are provided by the indicator. Comes with a MTF Scanner dashboard which tracks the brea
Algo Pumping
Ihor Otkydach
4.74 (19)
PUMPING STATION – Your Personal All-inclusive strategy Introducing PUMPING STATION — a revolutionary Forex indicator that will transform your trading into an exciting and effective activity! This indicator is not just an assistant but a full-fledged trading system with powerful algorithms that will help you start trading more stable! When you purchase this product, you also get FOR FREE: Exclusive Set Files: For automatic setup and maximum performance. Step-by-step video manual: Learn how to tr
PZ Swing Trading MT5
PZ TRADING SLU
5 (5)
Protect against whipsaws: revolutionize your swing trading approach Swing Trading is the first indicator designed to detect swings in the direction of the trend and possible reversal swings. It uses the baseline swing trading approach, widely described in trading literature. The indicator studies several price and time vectors to track the aggregate trend direction and detects situations in which the market is oversold or overbought and ready to correct. [ Installation Guide | Update Guide | Tro
TPSpro RFI Levels MT5
Roman Podpora
4.47 (17)
Reversal zones - levels / Active zones of a major player INSTRUCTIONS RUS   /   INSTRUCTIONS   ENG   /   Version MT4 EVERY BUYER OF THIS INDICATOR       GET ADDITIONALLY   FOR FREE   : 3 months       access to trading signals from the service       RFI SIGNALS       — ready-made entry points according to the TPSproSYSTEM algorithm. 3 months       access to training materials with regular updates - immersion in strategy and professional growth. 24/5 support on weekdays and access to a closed tra
Trend Forecaster
Alexey Minkov
5 (7)
The Trend Forecaster indicator utilizes a unique proprietary algorithm to determine entry points for a breakout trading strategy. The indicator identifies price clusters, analyzes price movement near levels, and provides a signal when the price breaks through a level. The Trend Forecaster indicator is suitable for all financial assets, including currencies (Forex), metals, stocks, indices, and cryptocurrencies. You can also adjust the indicator to work on any time frames, although it is recommen
Top indicator for MT5   providing accurate signals to enter a trade without repainting! It can be applied to any financial assets:   forex, cryptocurrencies, metals, stocks, indices .  Watch  the video  (6:22) with an example of processing only one signal that paid off the indicator! MT4 version is here It will provide pretty accurate trading signals and tell you when it's best to open a trade and close it. Most traders improve their trading results during the first trading week with the help of
Introduction to X3 Chart Pattern Scanner X3 Cherart Pattern Scanner is the non-repainting and non-lagging indicator detecting X3 chart patterns including Harmonic pattern, Elliott Wave pattern, X3 patterns, and Japanese Candlestick patterns. Historical patterns match with signal patterns. Hence, you can readily develop the solid trading strategy in your chart. More importantly, this superb pattern scanner can detect the optimal pattern of its kind. In addition, you can switch on and off individu
FX Levels MT5
Daniel Stein
5 (7)
FX Levels: Exceptionally Accurate Support & Resistance for All Markets Quick Overview Looking for a reliable way to pinpoint support and resistance levels across any market—currencies, indices, stocks, or commodities? FX Levels merges our traditional “Lighthouse” method with a forward-thinking dynamic approach, offering near-universal accuracy. By drawing from real-world broker experience and automated daily plus real-time updates, FX Levels helps you identify reversal points, set profit targe
FX Power MT5 NG
Daniel Stein
5 (17)
FX Power: Analyze Currency Strength for Smarter Trading Decisions Overview FX Power is your go-to tool for understanding the real strength of currencies and Gold in any market condition. By identifying strong currencies to buy and weak ones to sell, FX Power simplifies trading decisions and uncovers high-probability opportunities. Whether you’re looking to follow trends or anticipate reversals using extreme delta values, this tool adapts seamlessly to your trading style. Don’t just trade—trade
Easy Breakout MT5
Mohamed Hassan
4.6 (5)
After your purchase, feel free to contact me for more details on how to receive a bonus indicator called VFI, which pairs perfectly with Easy Breakout for enhanced confluence!    Easy Breakout MT5   is a powerful price action trading system built on one of the most popular and widely trusted strategies among traders: the   Breakout strategy ! This indicator delivers crystal-clear Buy and Sell signals based on breakouts from key support and resistance zones. Unlike typical breakout indicators
Gartley Hunter Multi
Siarhei Vashchylka
5 (11)
Gartley Hunter Multi - An indicator for searching for harmonic patterns simultaneously on dozens of trading instruments and on all possible timeframes. Manual (Be sure to read before purchasing) | Version for MT4 Advantages 1. Patterns: Gartley, Butterfly, Shark, Crab. Bat, Alternate Bat, Deep Crab, Cypher 2. Simultaneous search for patterns on dozens of trading instruments and on all possible timeframes 3. Search for patterns of all possible sizes. From the smallest to the largest 4. All fou
IQ Gold Gann Levels a non-repainting, precision tool designed exclusively for XAUUSD/Gold intraday trading. It uses W.D. Gann’s square root method to plot real-time support and resistance levels, helping traders spot high-probability entries with confidence and clarity. William Delbert Gann (W.D. Gann) was an exceptional market analyst, whose trading technique was based on a complex blend of mathematics, geometry, astrology, and ancient mathematics which proved to be extremely accurate. Download
This dashboard shows the latest available   harmonic patterns   for the selected symbols, so you will save time and be more efficient /   MT4 version . Free Indicator:   Basic Harmonic Pattern Comparison of "Basic Harmonic Pattern" vs. "Basic Harmonic Patterns Dashboard" Indicators Feature Basic Harmonic Pattern Basic Harmonic Patterns Dashboard Functionality Detects and displays harmonic patterns on a single chart Searches multiple symbols and timeframes for harmonic patterns, displays res
Atbot
Zaha Feiz
4.71 (45)
ATbot : How It Works and How to Use It How It Works The "AtBot" indicator for the MT5 platform generates buy and sell signals using a combination of technical analysis tools. It integrates Simple Moving Average (SMA), Exponential Moving Average (EMA), and the Average True Range (ATR) index to identify trading opportunities. Additionally, it can utilize Heikin Ashi candles to enhance signal accuracy. MQL Channel    Leave a massage after purchase and receive a special bonus gift. Key Features: ⦁
Introducing the POWER TRADE indicator created by a small group of traders with a few years trading trading the financial market profitably . This is a plug and play indicator that provides you with  POWERFUL Entry signals with Profit Taking and rebound zones. The indicator Works with all MT5 trading instruments. The indicator uses previous  chart data as receipt to speculate on future market moves.
Bill Williams Advanced
Siarhei Vashchylka
5 (10)
Bill Williams Advanced is designed for automatic chart analysis using Bill Williams' "Profitunity" system. The indicator analyzes four timeframes at once. Manual (Be sure to read before purchasing) Advantages 1. Automatically analyzes the chart using the "Profitunity" system of Bill Williams. The found signals are placed in a table in the corner of the screen. 2. Equipped with a trend filter based on the Alligator indicator. Most of the system signals are recommended to be used only according t
More from author
Market Profile Heatmap
Samuele Borella
5 (1)
MP TPO Heatmap — Market Profile (TPO) with VAH/VAL/POC/IB Market Profile is a way to visualize how price accepts or rejects value within a session. Instead of averaging, it counts how often price traded at each level during equal-time “brackets.” The result is a distribution you can read at a glance: thick areas = acceptance; thin edges = rejection. This indicator implements a TPO-based Market Profile with clean session lines (POC, VAH, VAL, IBH, IBL) and a fast, two-tone heatmap cloud that high
Tired of losing money? Neuro_Inverted_Panel_EA is your solution — the ultimate manual trading panel for those ready to embrace inverted psychology! Simply attach the EA to your chart, set the maximum daily loss you're willing to accept (for smart risk control), and trade as you normally would — but without watching your "Toolbox" for open trades . This panel turns your typical losing habits into a winning strategy by flipping your decisions upside down — literally. Once attached, the panel displ
ARTIFICIAL INTELLIGENCE INVESTMENT TOOL. ATTACH TO THE CHART, LEAVE AND FORGET. VPS HIGHLY RECOMMENDED-INVESTMENT SYSTEM. (MQL5 VPS) RR_EA is an investment-grade swing trading EA with a built-in Artificial Intelligence decision engine. It has been specifically engineered to trade the US30(Dow Jones) and NASDAQ-100 index market. The internal AI trading logic is fully automated — no manual intervention is required after setup. The only input from the user is the lot size they wish to trade (based
Inverted_Chart_EA Utility Expert Advisor Inverted_Chart_EA creates and maintains a mirror-inverted chart of any symbol and timeframe. It automatically generates a custom instrument (e.g. US30_INV ) and keeps its price history updated in real time, with bars mirrored around a chosen pivot. This utility gives traders a new way to analyze the market from a different perspective by flipping the chart upside down. Why use an inverted chart? Highlight hidden patterns – price formations that look ordin
Volume at Price (VAP) VAP is a right-anchored Volume Profile Heatmap for MetaTrader 5 designed for clean, fast, and stable execution on any chart. It shows where trading activity clustered, not just when—so you can read balance/imbalance, spot value migration, and plan trades with precise references: VAH, VAL, and POC . What VAP shows Heatmap Profile (tick-volume): A compact, right-anchored histogram that scales with the chart. Value Area (~70%) in Gold Non-Value in White Soft shadow gradient
Filter:
No reviews
Reply to review