GridBotIND
- Indicators
- Version: 1.0
- Activations: 5

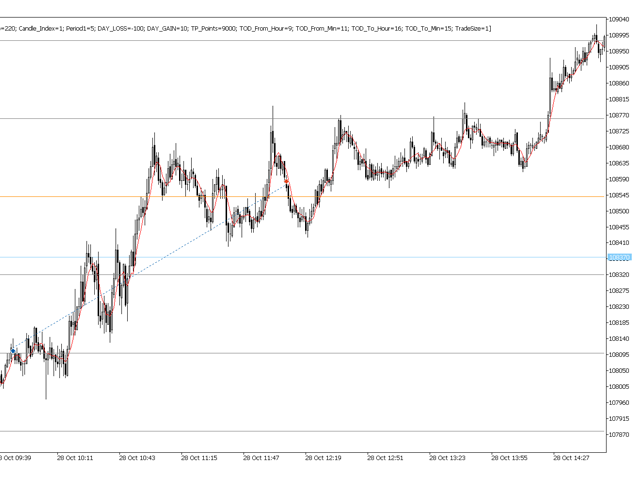
O GRIDBOT WIM robô de investimento para Mini Índice.
Parametrizado com grade linear ou zona de expansão
(FIMATHE).
CONFIGURAÇÕES:
Ponto de entrada Pivot dia anterior
double r1 = pivot + distance;
double r2 = r1 + distance;
double r3 = r2 + distance;
double r4 = r3 + distance;
double r5 = r4 + distance;
double r6 = r5 + distance;
double r7 = r6 + distance;
double r8 = r7 + distance;
double r9 = r8 + distance;
double r10 = r9 + distance;
double s1 = pivot - distance;
double s2 = s1 - distance;
double s3 = s2 - distance;
double s4 = s3 - distance;
double s5 = s4 - distance;
double s6 = s5 - distance;
double s7 = s6 - distance;
double s8 = s7 - distance;
double s9 = s8 - distance;
double s10 = s9 - distance;