PIVOT eXtreme
- Indicators
-
Syamsurizal Dimjati
 Hello traders, I design and develop high-quality indicators and Expert Advisors (EAs) for MT5 (since 2023), built to help you achieve more consistent and reliable trading results.
 - Version: 5.55
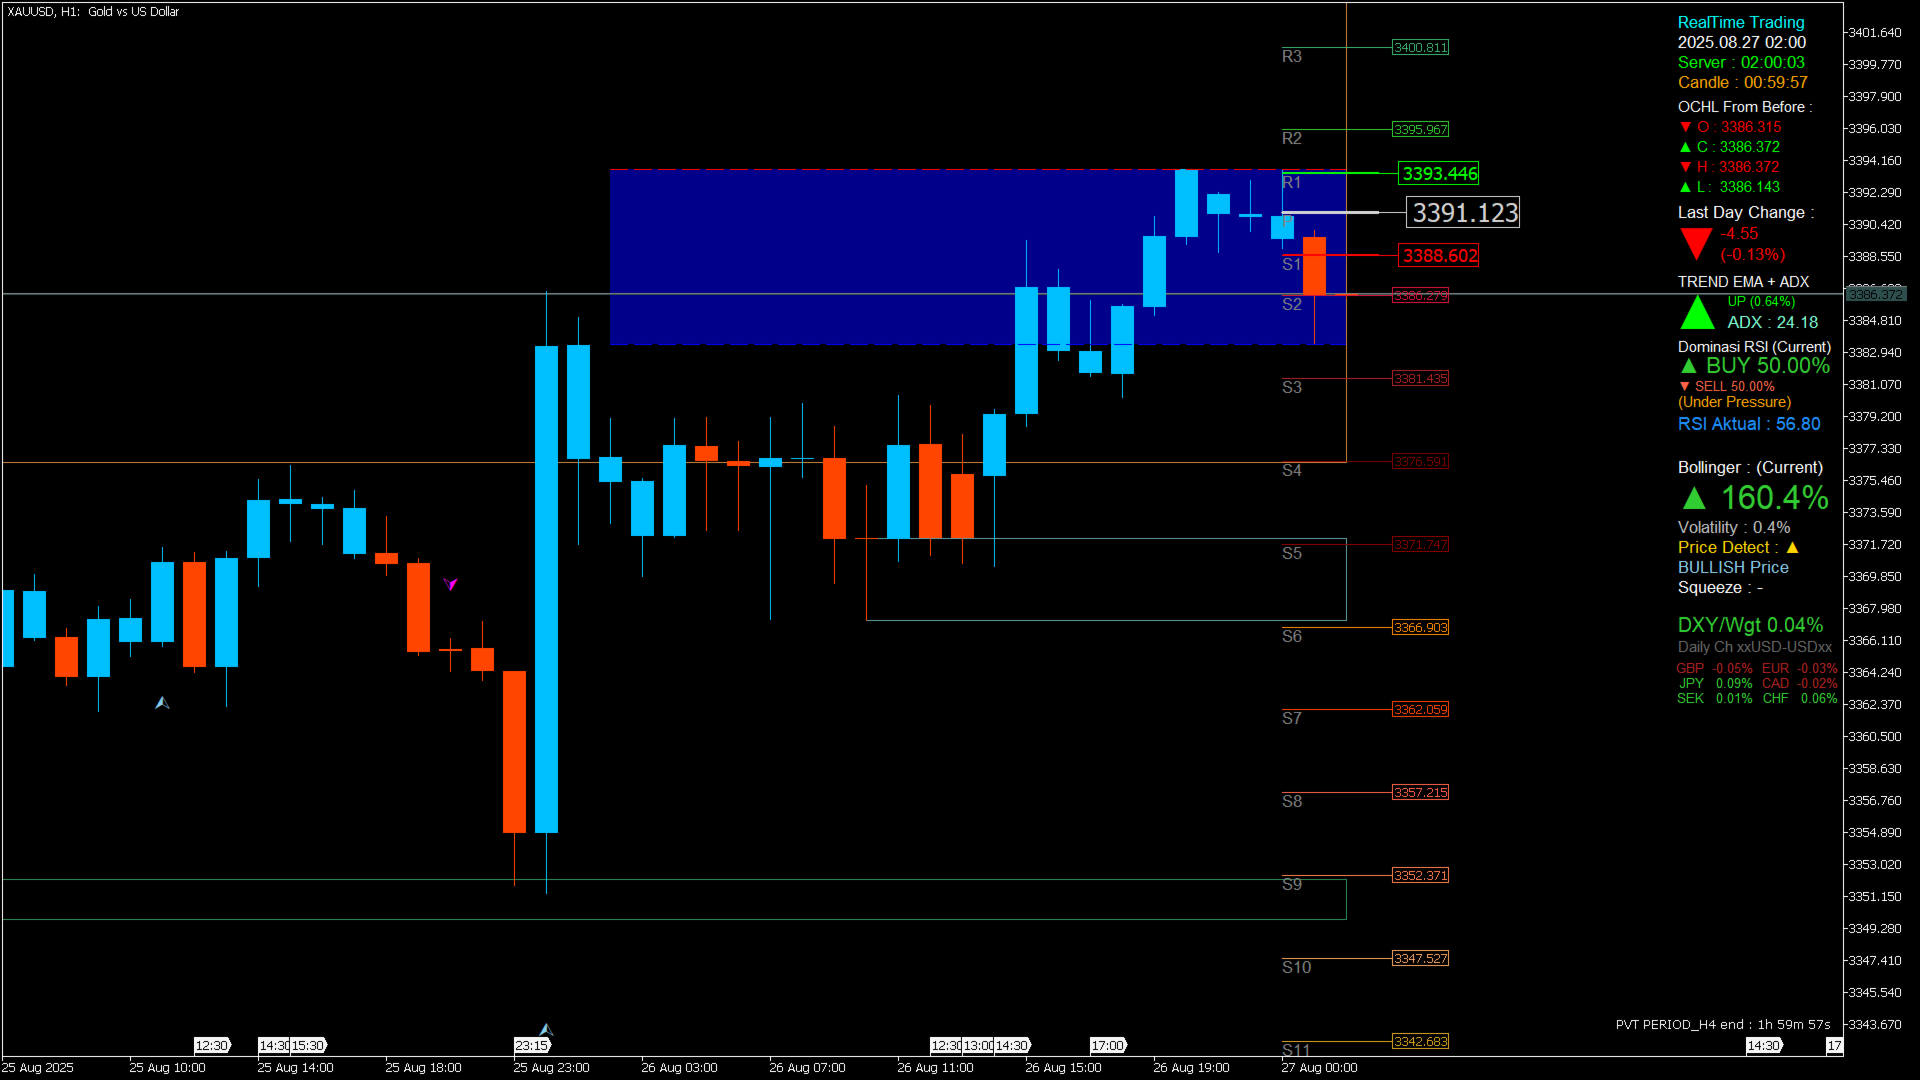
Pivot eXtreme
Pivot adalah level referensi penting yang digunakan trader untuk memetakan potensi support & resistance intraday maupun jangka lebih panjang.
Dalam sistem ini, level pivot dikembangkan menjadi P (Pivot Point utama), R1–R13 (Resistance), serta S1–S13 (Support).
Pivot Point (P)
-
Titik pusat utama, dihitung dari rata-rata harga (High + Low + Close) / 3.
-
Berfungsi sebagai acuan keseimbangan harga:
-
Jika harga di atas P → tren cenderung bullish.
-
Jika harga di bawah P → tren cenderung bearish.
-
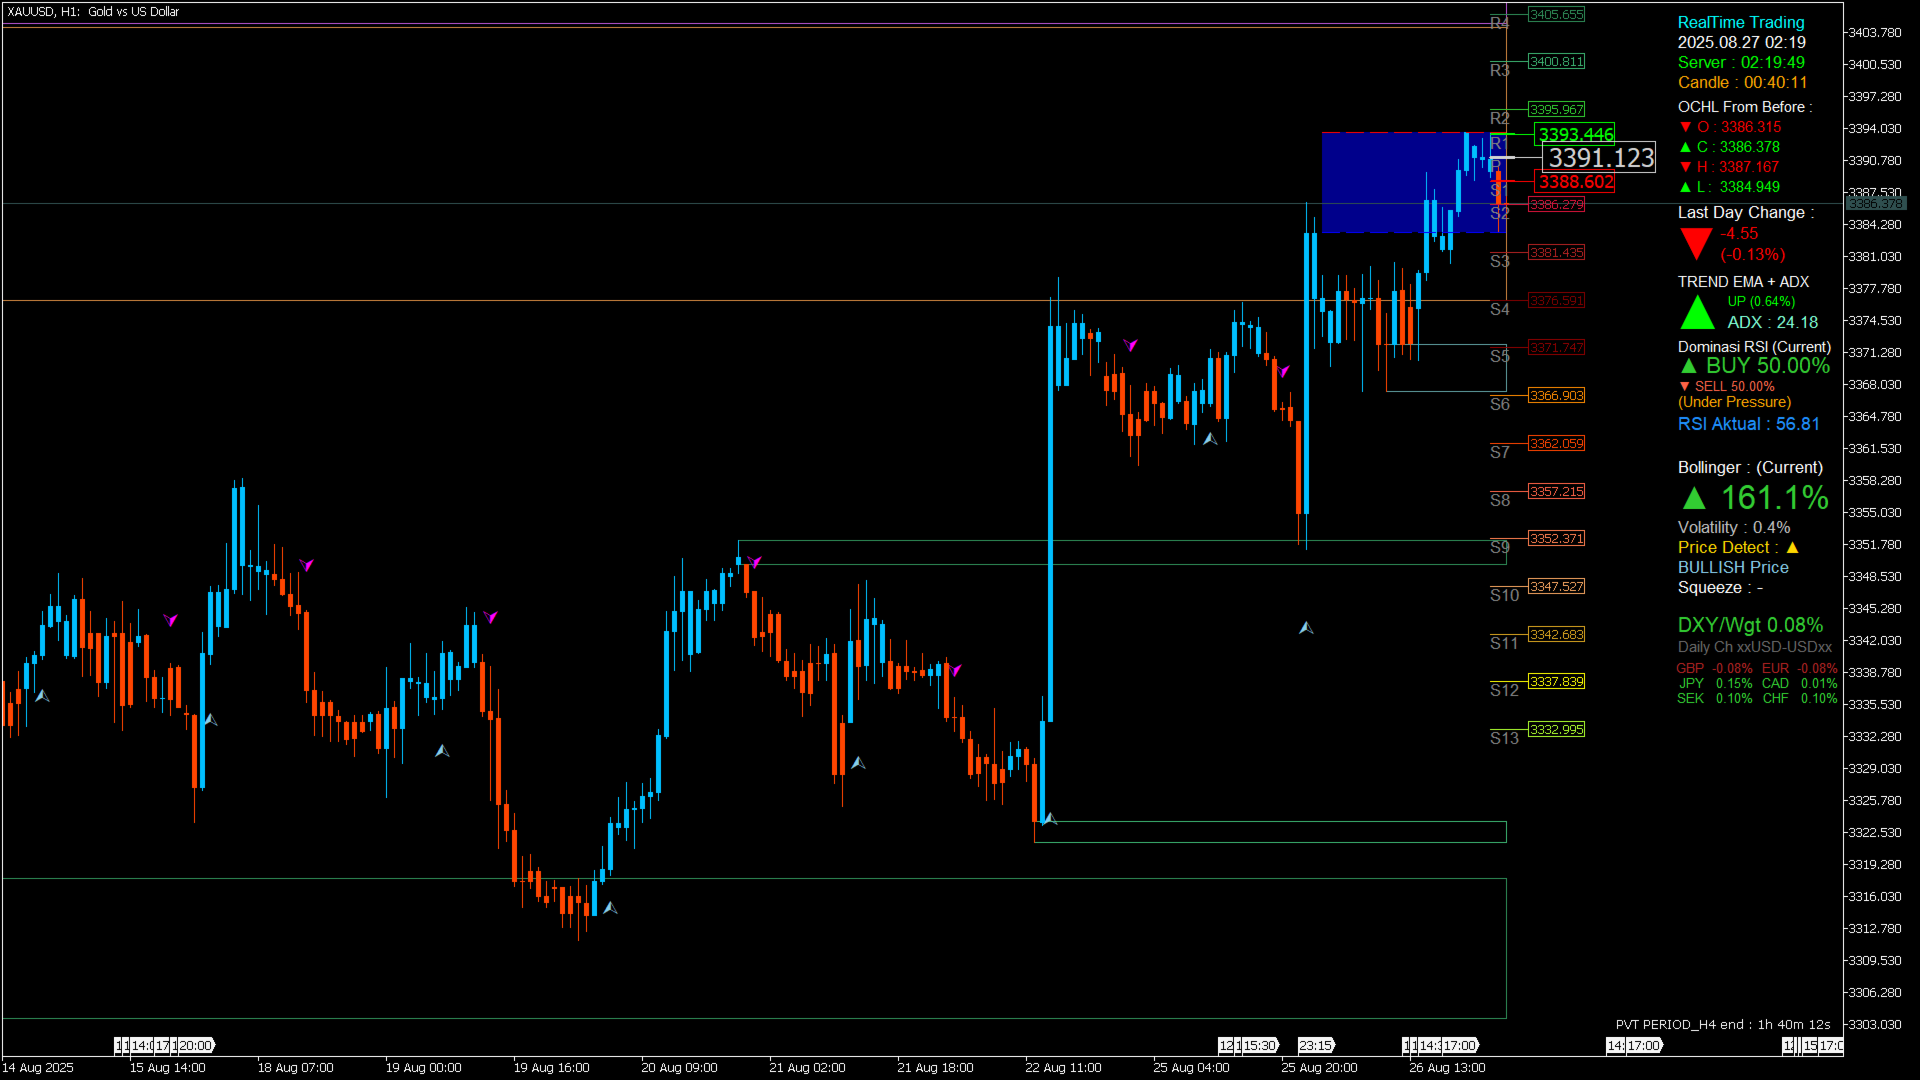
Resistance Levels (R1 – R13)
-
Digunakan sebagai target kenaikan atau area potensi harga tertahan.
-
R1 – R3 → resistance ringan (intraday).
-
R4 – R7 → resistance menengah (swing).
-
R8 – R13 → resistance kuat (level ekstrem, jarang disentuh, cocok untuk konfirmasi tren besar).
Support Levels (S1 – S13)
-
Digunakan sebagai target penurunan atau area potensi pantulan.
-
S1 – S3 → support ringan (intraday).
-
S4 – S7 → support menengah (swing).
-
S8 – S13 → support kuat (level ekstrem, validasi tren besar).
Tampilan Visual & Warna Dinamis (Custom)
Agar lebih mudah dibaca dan fokus meningkat, gunakan sistem warna gradasi:
-
Pivot (P): Biru terang / emas → titik pusat yang menonjol.
-
Resistance (R1–R13):
-
R1–R3 → Oranye lembut → mudah terlihat tapi tidak terlalu keras.
-
R4–R7 → Merah solid → memberi peringatan area kuat.
-
R8–R13 → Merah gelap / ungu → level ekstrem, jarang disentuh.
-
-
Support (S1–S13):
-
S1–S3 → Hijau lembut → area pantulan cepat.
-
S4–S7 → Hijau solid → support menengah, lebih kuat.
-
S8–S13 → Hijau gelap / biru kehijauan → level support ekstrem.
-
Kelebihan Konsep Ini
-
Universal → bisa dipakai di semua pairs (Forex, Gold, Index, Crypto).
-
Multi-level → cocok untuk scalper, intraday, hingga swing trader.
-
Visual fokus → gradasi warna membantu otak membedakan kekuatan level tanpa bingung.
-
Elegan & modern → tampilan chart tetap bersih meski menampilkan banyak level.