GridBotIND
- Indikatoren
- Version: 1.0
- Aktivierungen: 5

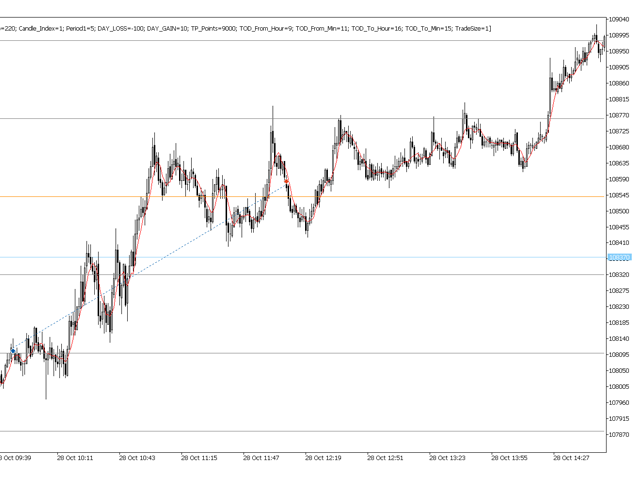
Der GRIDBOT WIM Investitionsroboter für Mini Index.
Parametrisiert mit linearem Raster oder Expansionszone (FIMATHE).
EINSTELLUNGEN:
Einstiegspunkt Pivot Vortag
double r1 = Pivot + Abstand;
double r2 = r1 + Abstand;
double r3 = r2 + Abstand;
double r4 = r3 + Abstand;
double r5 = r4 + Abstand;
double r6 = r5 + Abstand;
double r7 = r6 + Abstand;
double r8 = r7 + Abstand;
double r9 = r8 + Abstand;
double r10 = r9 + Abstand;
double s1 = Drehpunkt - Abstand;
double s2 = s1 - Abstand;
double s3 = s2 - Abstand;
double s4 = s3 - Abstand;
double s5 = s4 - Abstand;
double s6 = s5 - Abstand;
double s7 = s6 - Abstand;
double s8 = s7 - Abstand;
double s9 = s8 - Abstand;
double s10 = s9 - Abstand;