History Pattern Search
- Indicators
- Yevhenii Levchenko
- Version: 3.12
- Updated: 5 November 2022
- Activations: 20
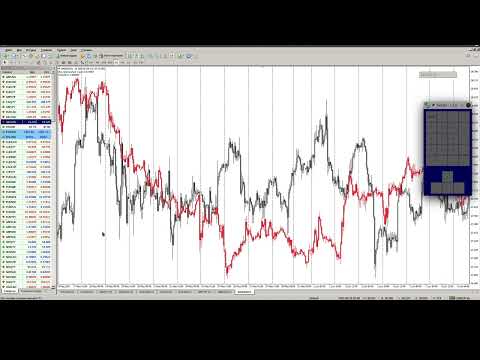
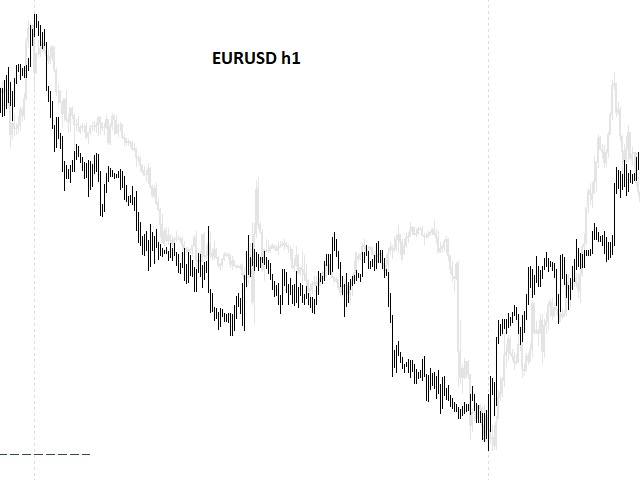
The indicator builds current quotes, which can be compared with historical ones and on this basis make a price movement forecast. The indicator has a text field for quick navigation to the desired date.
Options:
Symbol - selection of the symbol that the indicator will display;
SymbolPeriod - selection of the period from which the indicator will take data;
IndicatorColor - indicator color;
Inverse - true reverses quotes, false - original view;
Next are the settings of the text field, in which you can enter the date, which you can immediately jump to by pressing 'enter'.