History Pattern Search
- Indicateurs
- Version: 3.12
- Mise à jour: 5 novembre 2022
- Activations: 20

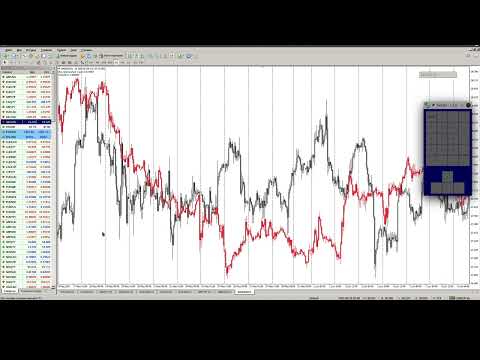
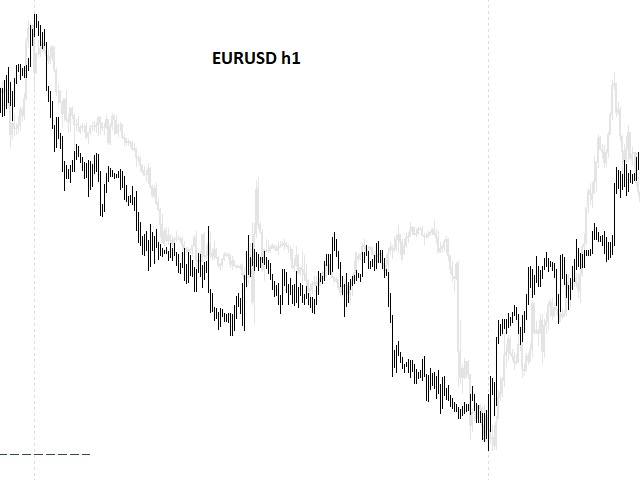
L'indicateur construit les cotations actuelles, qui peuvent être comparées aux cotations historiques et, sur cette base, faire une prévision de l'évolution des prix. L'indicateur dispose d'un champ de texte pour une navigation rapide jusqu'à la date souhaitée.
Option :
Symbole - sélection du symbole que l'indicateur affichera ;
SymbolPeriod - sélection de la période à partir de laquelle l'indicateur prendra des données ;
IndicatorColor - couleur de l'indicateur ;
HorisontalShift - décalage des guillemets dessinés par l'indicateur du nombre de barres spécifié;
Inverse - vrai inverse les guillemets, faux - vue originale ;
ChartVerticalShiftStep - décalage vertical du graphique (flèche haut/bas sur le clavier) ;
Viennent ensuite les paramètres du champ de texte, dans lequel vous pouvez entrer la date, à laquelle vous pouvez immédiatement accéder en appuyant sur 'Entrée'.