History Pattern Search
- Indicadores
- Versão: 3.12
- Atualizado: 5 novembro 2022
- Ativações: 20

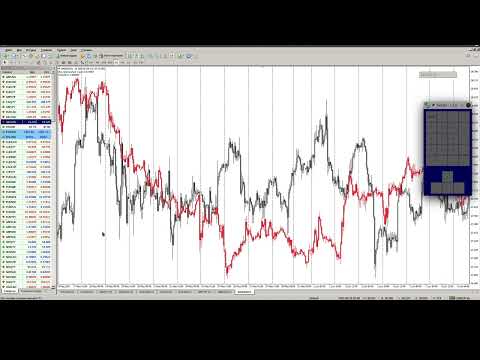
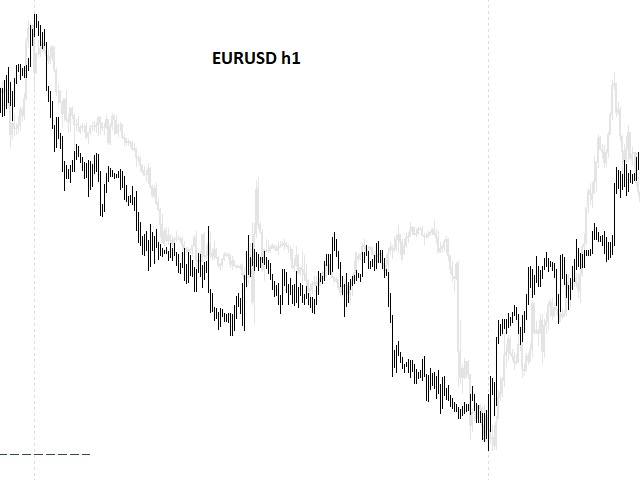
O indicador cria cotações atuais, que podem ser comparadas com as históricas e, com base nisso, fazer uma previsão do movimento dos preços. O indicador possui um campo de texto para navegação rápida até a data desejada.
Opções:
Símbolo - seleção do símbolo que o indicador exibirá;
SymbolPeriod - seleção do período do qual o indicador coletará dados;
IndicatorColor - cor do indicador;
HorisontalShift - deslocamento das cotações desenhadas pelo indicador pelo número especificado de barras;
Inverse - true inverte aspas, false - visão original;
ChartVerticalShiftStep - deslocamento do gráfico verticalmente (seta para cima/para baixo no teclado);
A seguir estão as configurações do campo de texto, no qual você pode inserir a data, para a qual você pode pular imediatamente pressionando 'enter'.