History Pattern Search
- 지표
- 버전: 3.12
- 업데이트됨: 5 11월 2022
- 활성화: 20

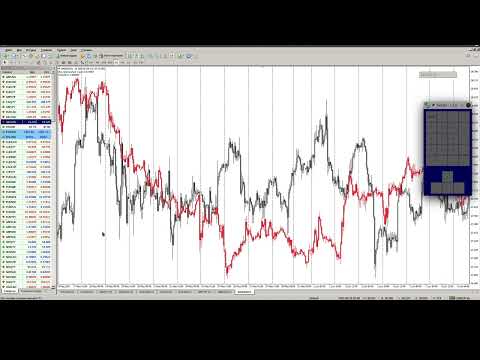
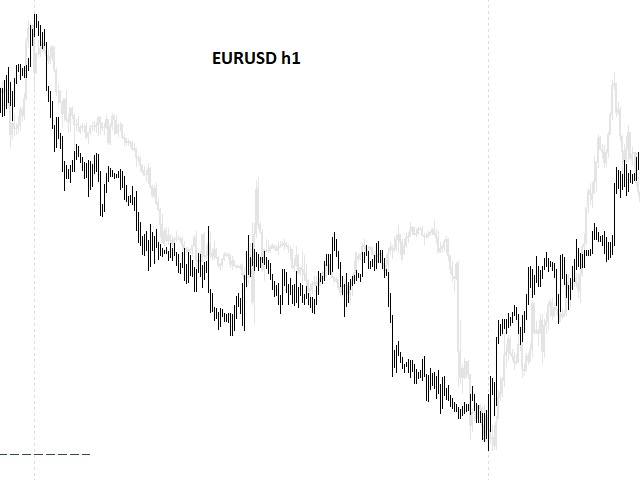
표시기는 현재 시세를 작성하여 과거 시세와 비교할 수 있으며 이를 바탕으로 가격 변동을 예측합니다. 표시기에는 원하는 날짜로 빠르게 이동할 수 있는 텍스트 필드가 있습니다.
옵션:
기호 - 표시기가 표시할 기호 선택.
SymbolPeriod - 지표가 데이터를 가져올 기간 선택.
IndicatorColor - 표시기 색상.
HorisontalShift - 지시자가 그린 따옴표를 지정된 막대 수만큼 이동합니다.
Inverse - true는 인용 부호를 반대로, false - 원래 보기를 반전합니다.
ChartVerticalShiftStep - 차트를 수직으로 이동합니다(키보드의 위/아래 화살표).
다음은 날짜를 입력할 수 있는 텍스트 필드의 설정으로, '엔터'를 누르면 즉시 이동할 수 있습니다.
옵션:
기호 - 표시기가 표시할 기호 선택.
SymbolPeriod - 지표가 데이터를 가져올 기간 선택.
IndicatorColor - 표시기 색상.
HorisontalShift - 지시자가 그린 따옴표를 지정된 막대 수만큼 이동합니다.
Inverse - true는 인용 부호를 반대로, false - 원래 보기를 반전합니다.
ChartVerticalShiftStep - 차트를 수직으로 이동합니다(키보드의 위/아래 화살표).
다음은 날짜를 입력할 수 있는 텍스트 필드의 설정으로, '엔터'를 누르면 즉시 이동할 수 있습니다.