History Pattern Search
- 指标
-
Yevhenii Levchenko
 Programmer
 - 版本: 3.12
- 更新: 5 十一月 2022
- 激活: 20
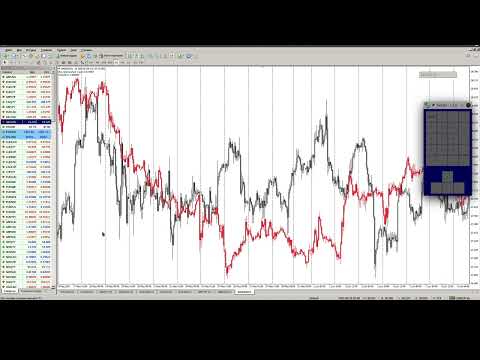
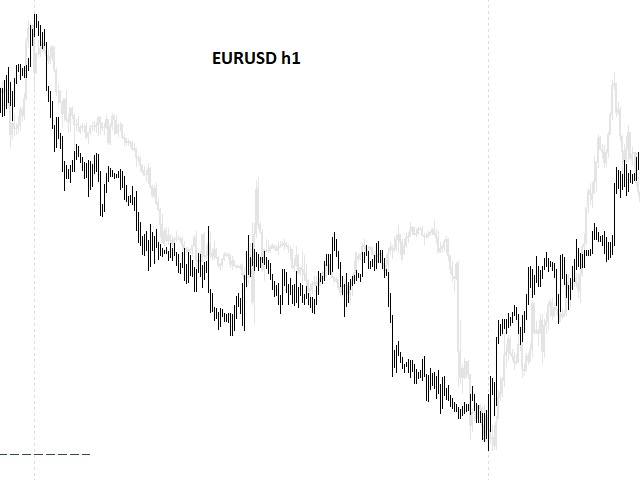
该指标建立当前报价,可以与历史报价进行比较,并在此基础上进行价格走势预测。指示器有一个文本字段,用于快速导航到所需日期。
选项:
符号 - 选择指标将显示的符号;
SymbolPeriod - 选择指标从中获取数据的时段;
IndicatorColor - 指示器颜色;
HorisontalShift - 由指标绘制的报价移动指定的柱数;
Inverse - true 反转引号,false - 原始视图;
ChartVerticalShiftStep - 图表垂直移动(键盘上的向上/向下箭头);
接下来是文本字段的设置,您可以在其中输入日期,您可以通过按“回车”立即跳转到该日期。
接下来是文本字段的设置,您可以在其中输入日期,您可以通过按“回车”立即跳转到该日期。