Smi Ergodic Scanner MT4

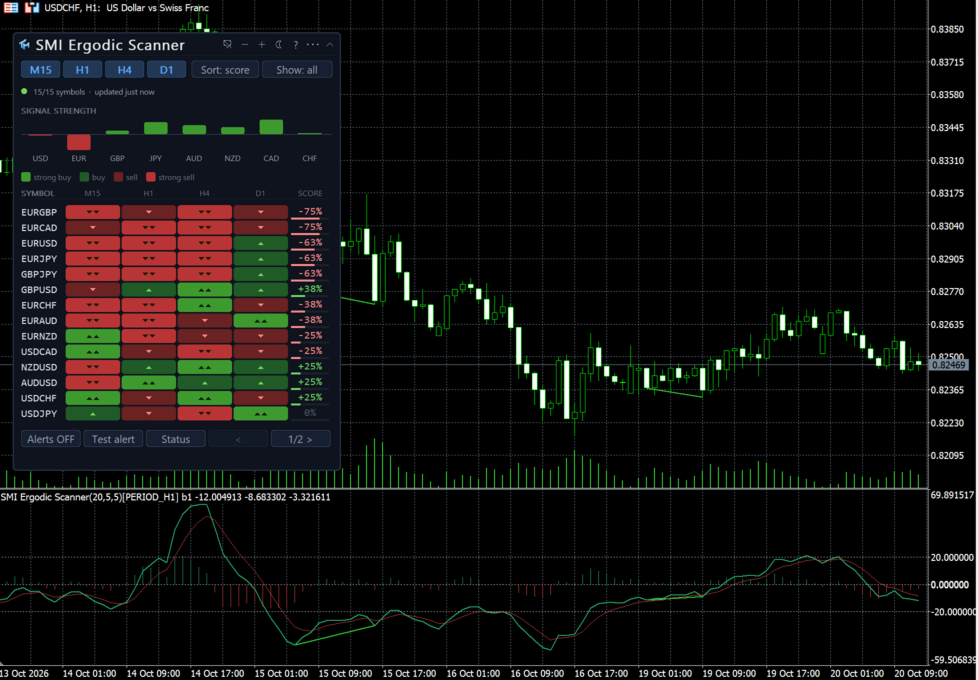
One board, twenty eight symbols, and a momentum reading calm enough to trust. SMI Ergodic Scanner runs Blau's double smoothed index across four timeframes per symbol, grades a crossing by whether it happened beyond the levels, and keeps the oscillator under the board so the crossing can be checked by eye.

The price increases by $10 every 10 purchases.

SMI Ergodic Scanner is two products in one file. The first is the SMI Ergodic index itself, in this chart's own sub window: the index, its signal line, and the histogram between them.

The second is a board that runs the same calculation across a list of symbols on several timeframes at once. The board says which instruments have signalled and how recently; the chart under it shows you what produced the signal, so you do not have to attach a second indicator to act on what the table found.

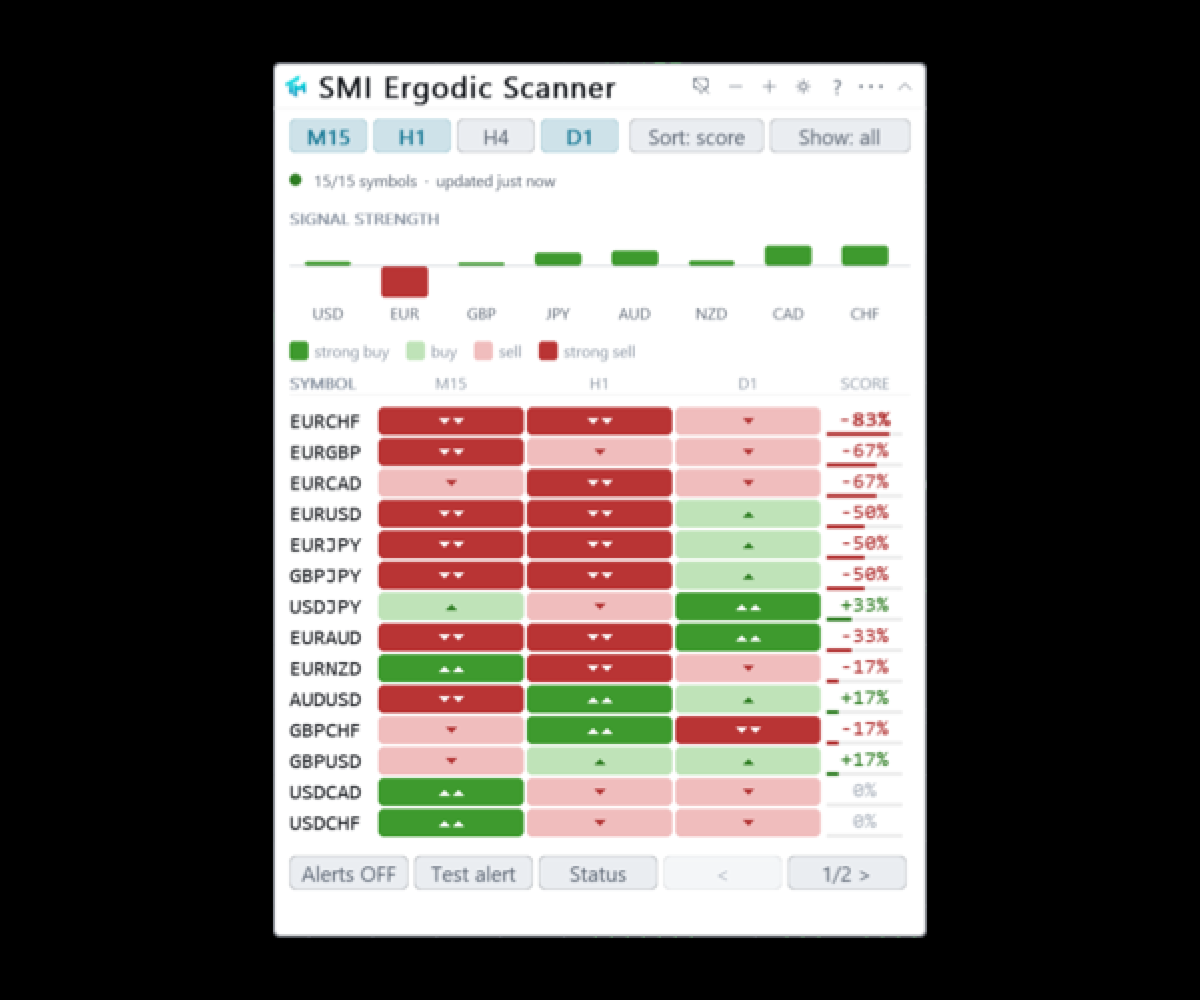
The board

A row per symbol, a column per scanned timeframe, up to four columns and up to twenty eight symbols. It ships scanning fifteen symbols and is raised to twenty eight from one setting. The symbol list is comma separated, or the board can take the Market Watch list instead. Broker prefix and suffix are detected from the chart you are on, or given by hand. Out of the box the board scans four timeframes: M15, H1, H4 and D1.

A cell reads like ^14b G2: which side the signal was on, how many bars ago it fired, and its grade. The word flat means the calculation ran and found no direction. Three dots mean the cell has not been measured yet, and hovering it explains why in words once tooltips are switched on, which they are not by default. A signal older than the freshness threshold keeps its colour but is drawn quieter, so hue says direction and weight says how much it still matters. A row carrying a fresh signal anywhere in it gets a wash of the accent colour.

The AGREE column is the reason to use a board rather than eight charts. For each symbol it takes the visible timeframe columns, finds the majority side, and prints something like v3/4: the direction, and how many of the visible timeframes stand on it. When every visible timeframe agrees, the cell is drawn bold in that side's colour. A tie prints a dash and is deliberately not a verdict. With a single timeframe visible the column is removed entirely rather than printing 1/1, which would only restate the cell beside it.

Column headers are buttons. Click a timeframe header to sort by that column, freshest first, rows with nothing in it at the bottom; click it again to reverse. Click AGREE to sort by agreement, full agreement first. The active header carries the accent colour and a caret, so the sort state lives on the control itself. A separate Sort button cycles freshest, grade and name for a whole-board order.

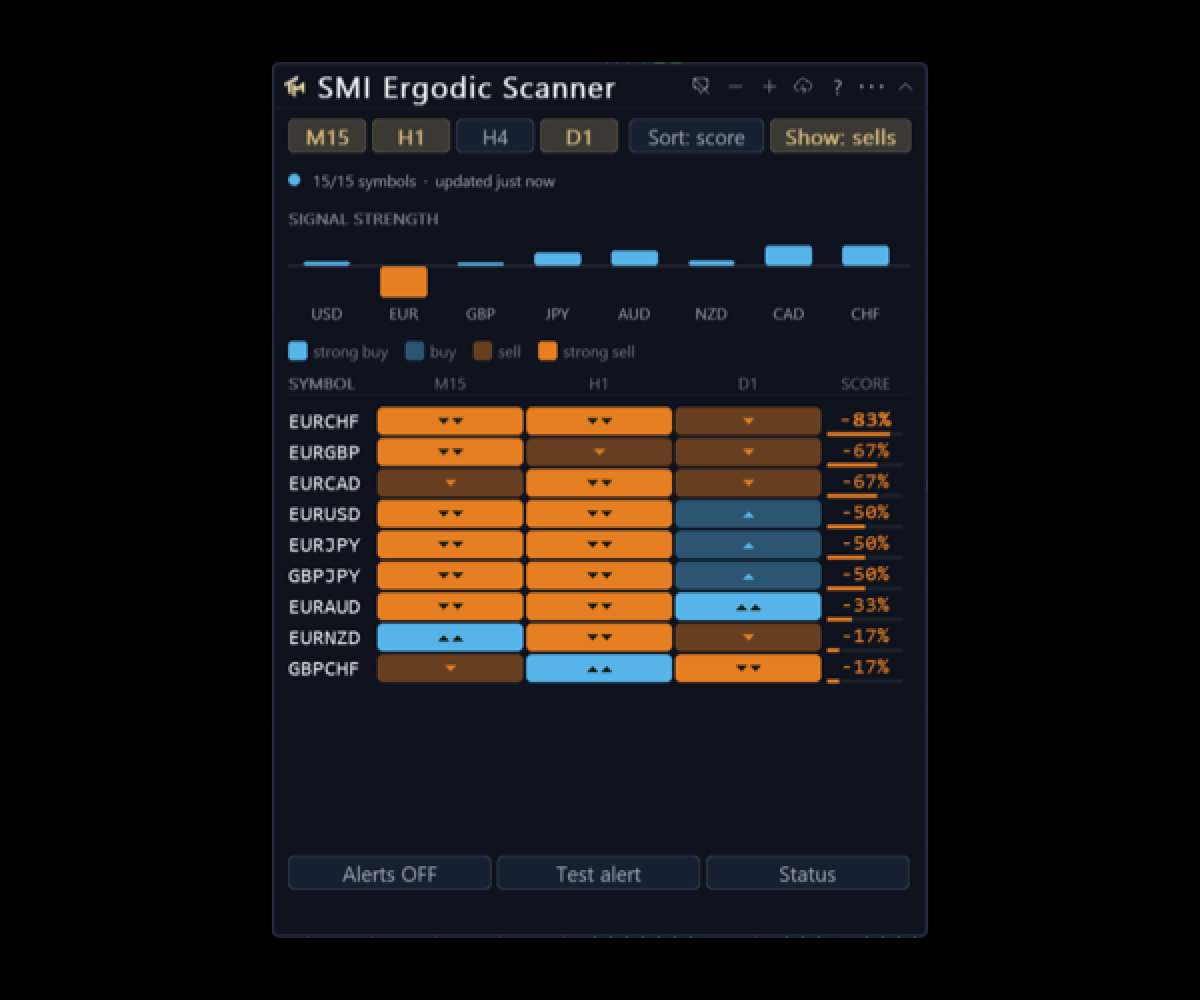
A Show button cycles all, buys, sells and fresh. Buys and sells follow the AGREE verdict and not any single cell, so a row shown under buys always reads an up glyph in AGREE, and a tie appears under neither. This filters the view and not the calculation: a hidden row is still measured and can still alert.

The legend above the table decodes the notation in one line, including the grade half, which it prints only because this port grades. It can be switched off. Timeframe buttons show and hide a column without stopping the calculation behind it.

The visible row count is fitted to the chart pane and the row setting is a maximum. No page buttons are drawn when everything fits; when it does not, previous and next appear with the page number. Because the board never draws more rows than the pane holds, the page buttons are always on screen and always reachable, however tall the row setting is.

Two status lines are always on show: symbols ready of total, how long since the last update, signals in the lookback window; then either the watchdog line or a sentence explaining why nothing is showing.

Diagnostics

A second panel, off by default, answers the question "why is there no signal": symbol coverage, which series are short of bars, how many signals were found in the window, and how many symbols this indicator switched on in Market Watch to do its work. A cell that could not be measured is explained rather than left blank.

The chart indicator

In its own sub window: the index and its signal line, and the difference between them as a histogram, coloured by whether the momentum is expanding or fading rather than merely by its sign. Divergence lines are drawn on the index and, if you want them, between the matching pivots on the price chart as well.

The settings sheet

Values covers the timeframe, the long smoothing of twenty, the short smoothing of five, the signal length of five, the two grading levels at plus and minus twenty, and the three divergence rows. Styles covers the palette, the index and its signal, the line width, and the histogram, which can be reduced to one plain colour. Every Values row has steppers, a range and a sentence of help.

Alerts covers the master switch, the per-event switches, the four channels, the cooldown and a test button.

Three colour schemes, including a colour-blind safe one that uses blue and orange rather than red and green. Panel position, scheme, the sort, the filter, which columns are visible and every value changed on the sheet persist per chart across a timeframe change and a terminal restart. The interface is English.

Alerts

Off out of the box. A master switch sits on the panel itself, next to a Test alert button that fires through every channel currently on.

The events are a fresh BUY and a fresh SELL, declared separately for each scanned timeframe, plus data health, which speaks when a symbol loses or regains its data. There is a minimum grade setting, and because this port grades its cells the setting does real work here.

The channels are a popup window, a sound, a push to the mobile terminal and e-mail. The cooldown is kept per cell and per event, thirty minutes by default. Telegram is not part of this product.

Cost

The work is budgeted: a set number of symbols is refreshed per timer tick, so a long list spreads its load instead of stalling the terminal. The first pass is progressive and the panel reports the percentage measured.

Reading it from an EA

The chart indicator publishes eight buffers, all readable through iCustom and CopyBuffer. Buffer 0 is the index and buffer 1 is its signal line. Buffer 2 is the difference between the index and its signal, drawn as a histogram, and buffer 3 is the colour index that paints it. Buffer 4, Signal, is +1 on a BUY bar, -1 on a SELL bar and 0 otherwise. Buffer 5 is the grade of that signal, buffer 6 carries the divergence marks, and buffer 7 is the zero line.

This product has no separate Buy and Sell price buffers, because there is no price to put an arrow at in a sub window. The signal is buffer 4 and it is the contract: filled on every pass whatever the Styles tab says, and present in the Data Window. Hiding a plot is done by taking its colour away and never by emptying a buffer, so every index above stays readable with the display switches off.

This map is the scanner's own. The free single chart indicator publishes the same eight indices and adds an Override buffer at index 8, which the scanner has no use for. Read the list above rather than assuming the two are interchangeable.

The board itself is a panel and not a buffer. It is read by eye and by alert.

The single chart indicator behind this one, SMI Ergodic MTF, is free and carries the same engine. If you follow one symbol, take that one; this scanner exists for watching many at once.

Provenance

This is a port of the SMI Ergodic Indicator, William Blau's index, which is his TSI under another name. The mathematics is public and the indicator is built into TradingView, which makes a port by formula admissible. Two deviations are declared. The scale is multiplied by one hundred so the pane reads in per cent as everywhere in this line, which moves no crossing, no zero and no divergence by a single bar and changes only the axis label and the number in a scanner cell. And the recursion starts from zero on the first bar, where Pine seeds each average with a mean and returns nothing before that.

The product is called SMI Ergodic Scanner because that is the name of the method, not because authorship of the method is claimed here. The original work belongs to its author.

Honest limits

The board reads closed bars and counts a cell's age in closed bars. The chart indicator under it can show a signal on the bar still forming, and such a signal can be gone by the close. What has been published on a closed bar does not change afterwards.

The oscillator is live on the forming bar. A cross that exists mid-bar can be absent at the close, and the panel line and the grade go with it. Closed bars do not change.

Double smoothing is late by construction. The index is quiet in a chop because it is meant to be, and that same quietness means it arrives after a fast move has already started.

The levels grade a signal, they do not filter one. Every crossing is published, and a crossing far from the levels is graded one rather than suppressed.

The long and short lengths move every crossing the product will ever show. Two configurations give two different sets of signals and neither of them is the true one.

AGREE counts timeframes, it does not estimate probability. Four timeframes agreeing means four correlated readings of one instrument agreed. A tie produces no verdict on purpose and is hidden by both the buys filter and the sells filter.

Scanning costs. Twenty-eight symbols on four timeframes is a hundred and twelve cells and will be felt on a slow machine; the budget setting is what you turn down.

Symbols your broker does not carry, and series with fewer bars than the settings need, cannot be measured, and the board says which and why rather than leaving the cell blank.

No profit figure, win rate or backtest result is claimed here.

Recommended products
[ZhiBiCCI] indicators are suitable for all cycle use, and are also suitable for all market varieties. [ZhiBiCCI] Green solid line is a reversal of bullish divergence. The green dotted line is a classic bullish divergence. [ZhiBiCCI] The solid line to the red is a reverse bearish divergence. The red dotted line is a classical bearish divergence. [ZhiBiCCI] can be set in the parameters (Alert, Send mail, Send notification), set to (true) to send instant signals to the alarm window, email, insta
VR Cub
Vladimir Pastushak
VR Cub is an indicator for getting high-quality entry points. The indicator was developed to facilitate mathematical calculations and simplify the search for entry points into a position. The trading strategy for which the indicator was written has been proving its effectiveness for many years. The simplicity of the trading strategy is its great advantage, which allows even novice traders to successfully trade with it. VR Cub calculates position opening points and Take Profit and Stop Loss targe
Auto Fibo Pro m
DMITRII GRIDASOV
"Auto FIBO Pro"   Crypto_Forex  indicator  - is great auxiliary tool in trading! Indicator automatically calculate and place on chart Fibo levels and local trend lines (red color). Fibonacci levels indicate key areas where price can reverse. Most important levels are 23.6%, 38.2%, 50% and 61.8%. You can use it   for reversal scalping  or for zone grid trading. There are plenty of opportunities to  improve your current system using Auto FIBO Pro indicator as well. It has Info Spread Swap Displa
Your Good Friends — this is not just an indicator, but your reliable trading assistant, designed for traders who value simplicity, clarity, and stability. It combines the best classic methods of technical analysis — support and resistance levels, reversal signals, visual cues — and presents them in the clearest, most user-friendly format possible. Suitable for both beginners and experienced traders — especially those who want to eliminate chaos, reduce stress, and trade based on clear signals.
The Th3Eng PipFinite indicator is based on a very excellent analysis of the right trend direction with perfect custom algorithms. It show the true direction and the best point to start trading. With StopLoss point and Three Take Profit points. Also it show the right pivot of the price and small points to order to replace the dynamic support and resistance channel, Which surrounds the price. And Finally it draws a very helpful Box on the left side on the chart includes (take profits and Stop loss
Binary Options Support Resistance Indicator This indicator is designed for binary options trading and effectively shows retracements from support and resistance levels. Signals appear on the current candle. A red arrow pointing downwards indicates a potential selling opportunity, while a blue arrow pointing upwards suggests buying opportunities. All that needs adjustment is the color of the signal arrows. It is recommended to use it on the M1-M5 timeframes as signals are frequent on these timef
Night ghost
Dmitriy Kashevich
Night Ghost - Arrow indicator for binary options. This is a reliable assistant to you in the future! - No redrawing on the chart -Works great on EUR/USD currency pairs! -Indicator accuracy up to 90% (Especially at night) -No long setup required (Perfectly set up for Binary Options) - Not late signals - The appearance of a signal on the current candle -Perfect for M1 period (No More!) - Eye-friendly candle color (Red and Blue) -Installed Alert Working with it: - Blue arrow shows signa
Indicador Taurus All4
Fabio Oliveira Magalhaes
Taurus All4 Taurus All4 is a high-performance indicator, it will tell you the strength of the trend, and you will be able to observe the strength of the candle. Our indicator has more than 4 trend confirmations. It is very simple and easy to use. Confirmation Modes Candle Trend Confirmations: When the candle switches to light green the trend is high. When the candle switches to light red the trend is reverting down. When the candle changes to dark red the trend is low. Trendline Trend Confirm
Super Reversal Pattern
Parfait Mujinga Ndalika
Super Reversal Pattern Indicator Unlock the power of advanced pattern recognition with our Super Reversal Pattern Indicator. Designed for traders seeking precision and reliability, this indicator identifies one of the most effective reversal patterns in technical analysis, offering a significant edge in your trading strategy. Key Features: Non-Repainting Accuracy: Enjoy the confidence of non-repainting technology. Once a Super Reversal Pattern is detected, it remains static, providing consiste
"Dynamic Flow Oscillator" - is an advanced custom Crypto_Forex indicator - efficient Trading tool for MT4!  - New generation of Oscillators - see pictures to check how to use it. - Dynamic Flow Oscillator has adaptive Oversold/Overbought zones. - Indicator uses   price and volume data   for identifying oversold and overbought zones. - Oscillator is an auxiliary tool to find exact entry points from OverSold/OverBought areas. - Oversold values: below Green line, Overbought values: over Red line .
"Dynamic Scalping Oscillator" - is an advanced custom Crypto_Forex indicator - efficient Trading tool for MT4!  - New generation of Oscillators - see pictures to check how to use it. - Dynamic Scalping Oscillator has adaptive Oversold/Overbought zones. - Oscillator is an auxiliary tool to find exact entry points from dynamic OverSold/OverBought areas. - Oversold values: below Green line, Overbought values: over Orange line . - This indicator is great to combine with Price Action patterns as wel
Trend Monitor
Pavel Zamoshnikov
4 (4)
The indicator generates early signals basing on ADX reading data combined with elements of price patterns. Works on all symbols and timeframes. The indicator does not redraw its signals. You see the same things on history and in real time. For better visual perception signals are displayed as arrows (in order not to overload the chart). Features Easy to use. Filter configuration only requires selection of sensitivity in the " Sensitivity of the indicator " input. Signals can be filtered using
Trend Oscillator - is an advanced custom  Crypto_Forex indicator, efficient trading tool! Advanced new calculation method is used - 20 options for parameter "Price for calculation". Smoothest oscillator ever developed. Green color for upward trends,  Red color for downward trends. Oversold values: below 5, O verbought values: over 95. There are plenty of opportunities to upgrade even standard strategies with this indicator. With PC and Mobile alerts. Click here to see high quality Trading Robot
Fibonacci retracement and extension line drawing tool Fibonacci retracement and extended line drawing tool for MT4 platform is suitable for traders who use  golden section trading Advantages: There is no extra line, no too long line, and it is easy to observe and find trading opportunities Trial version: https://www.mql5.com/zh/market/product/35884 Main functions: 1. Multiple groups of Fibonacci turns can be drawn directly, and the relationship between important turning points can be seen
Trend PA
Mikhail Nazarenko
5 (3)
The Trend PA indicator uses   Price Action   and its own filtering algorithm to determine the trend. This approach helps to accurately determine entry points and the current trend on any timeframe. The indicator uses its own algorithm for analyzing price changes and Price Action. Which gives you the advantage of recognizing, without delay, a new nascent trend with fewer false positives. Trend filtering conditions can be selected in the settings individually for your trading style. The indicator
Cosmic Diviner X Planet
Olena Kondratenko
4 (2)
This unique multi-currency strategy simultaneously determines the strength of trends and market entry points, visualizing this using histograms on the chart. The indicator is optimally adapted for trading on the timeframes М5, М15, М30, Н1. For the convenience of users, the indicator renders the entry point (in the form of an arrow), recommended take profit levels (TP1, TP2 with text labels) and the recommended Stop Loss level. The take profit levels (TP1, TP2) are automatically calculated for
Indicator for determining the trend. The arrows and lines on the chart show the price reversal and the probable current trend or correction. You should always trade in the direction of the arrow. It is best to use the indicator on several time frames at once and enter the market when all time frames have the same arrow. For example, we open a sell trade if there is a red arrow on the M5, M30 and H4 timeframes. Or we open a buy deal if the indicator shows a blue arrow on all timeframes. Advanta
"Dynamic Trading Oscillator" - is an advanced custom Crypto_Forex indicator - efficient Trading tool for MT4!  - New generation of Oscillators - see pictures to check how to use it. - Dynamic Trading Oscillator has adaptive Oversold/Overbought zones. - Oscillator is an auxiliary tool to find exact entry points from dynamic OverSold/OverBought areas. - Oversold values: below Blue line, Overbought values: above Red line . - This indicator is great to combine with Price Action patterns as well. -
Happy Scalping Indicator
Leandro Bernardez Camero
This indicator was designed for aggressive scalping and quick entries in binary options , generating signals on every candle , so you can know exactly what is happening at all times. Join the Happy Scalping channel: MQL5 It does not repaint : the current candle's signal is generated in REAL TIME , which means it may change while the candle is still forming, depending on whether the price rises or falls compared to the previous candle's close. But once the candle closes , the signal color becom
The indicator shows you buy/sell signals and does not repaint. It works well with almost all pairs, while the best ones are GBPUSD, XAUUSD and EURUSD. The product works better on H1 and H4. You can change the parameters in the inputs tab to get the best signals and the best trade results on each pair. You can enable/disable alerts when signal appears. The indicator is easy to use. Parameters barstrip & Sensitive: amount of bars to process the highest and lowest prices (relates to the internal l
Advanced Stochastic Scalper
Evgeny Belyaev
4.56 (16)
Advanced Stochastic Scalper - is a professional indicator based on the popular Stochastic Oscillator. Advanced Stochastic Scalper is an oscillator with dynamic overbought and oversold levels, while in the standard Stochastic Oscillator, these levels are static and do not change. This allows Advanced Stochastic Scalper to adapt to the ever-changing market. When a buy or a sell signal appears, an arrow is drawn on the chart and an alert is triggered allowing you to open a position in a timely mann
Magical Arrow
Ranguni Abdulsamir Abdulmajid
Magical Arrow Indicator – Clear & Reliable Signals The Magical Arrow Indicator is a non-repainting, trend-following tool that gives you crystal-clear Buy and Sell signals . It  high-probability reversals and entries . No more guesswork – just follow the arrows on your chart! The Magical Arrow Indicator is a powerful, easy-to-use trading tool that helps you catch the most profitable Buy and Sell opportunities in the Forex market. It is designed for beginners and professional traders , giving you
The King of Forex Trend Cloud Indicator is a trend following indicator based on moving averages. The Indicator is meant to Capture both the beginning and the end of a trend. This indicator can be used to predict both short and long terms market trends.  The king of Forex Trend Cloud if paired together with the King of Forex Trend Indicator can give a broad picture in market analysis and forecasts. I have attached images for both the  The king of Forex Trend Cloud on its own and  The king of Fore
PZ ABCD Retracement
PZ TRADING SLU
4 (5)
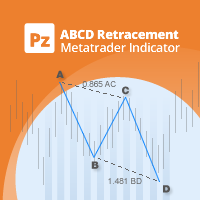
Identify precise entry and exit points with AB=CD patterns This indicator finds AB=CD retracement patterns. The AB=CD Retracement pattern is a 4-point price structure where the initial price segment is partially retraced and followed by an equidistant move from the completion of the pullback, and is the basic foundation for all harmonic patterns. [ Installation Guide | Update Guide | Troubleshooting | FAQ | All Products   ] Customizable pattern sizes Customizable AC and BD ratios Customizable b
Renko, Heiken Ashi, Ticks Bar, Range Bar.    Easy switching, easy setup, all in one window.        Place the Custom Chart indicator and view Renko, Heiken Ashi, Tick bar, Range bar charts in real time at real chart.    Position the offline chart window so that the indicator control panel is visible.    Switch the chart mode by click of a button.    Connect to the output chart any indicator, expert advisor without any restrictions.    No, it doesn't work in the tester.    Yes, you can use an
Crypto_Forex Indicator "CCI with Dynamic OverSold/OverBought zones" for MT4, No Repaint. - Commodity Channel Index (CCI) is excellent for Momentum trading into the trend direction. - It is great to take Sell entries from dynamic OverBought zone and Buy entries from dynamic OverSold zone into the direction of main trend. - This indicator is excellent to combine with Price Action entries as well. - Dynamic OverBought zone - above yellow line. - Dynamic OverSold zone - below blue line. - CCI oscil
The   True Magic Oscillator   indicator is designed for signal trading. This indicator generates trend signals. It uses many algorithms and indicators to generate this signal. It tries to generate signals from the points with the highest trend potential. This indicator is a complete trading product. This indicator does not need any additional indicators. The indicator is never repainted. The point at which the signal is given does not change.         Features and Recommendations Works wit
TPA True Price Action indicator reveals the true price action of the market makers through 100% non-repainting signals (except early signals mode) strictly at the close of a candle! TPA shows entries and re-entries, every time the bulls are definitely stronger than the bears and vice versa. Not to confuse with red/green candles. The shift of power gets confirmed at the earliest stage and is ONE exit strategy of several. There are available now two free parts of the TPA User Guide for our custom
Buy Sell Arrow MT Indicator Buy Sell Arrow MT Indicator is a technical indicator for MetaTrader 5. It uses Pivot Points, Moving Averages, and multi-timeframe data to display Buy and Sell signals on the chart. Description The indicator combines three elements: Pivot Points for support and resistance Moving Averages for trend direction Higher timeframe data for additional confirmation Signals are generated only when the defined conditions are met. Signal Calculation Buy signals are shown when bul
Delta Trigger Indicator
Leandro Bernardez Camero
5 (1)
Delta Trigger Indicator Clear signals. Fast alerts. No repaint. Delta Trigger is a precision-based arrow indicator that instantly reacts to trend shifts using the DI+ and DI– lines from the ADX. It delivers clean Buy/Sell arrows without repainting, without delay, and without disappearing. Best Pair: XAUUSD While Delta Trigger works seamlessly across all Forex pairs and timeframes (from M1 to H4 and beyond), it performs exceptionally well on XAUUSD, where momentum shifts are more aggressive a
Buyers of this product also purchase
Trend SniperX MT4
Sarvarbek Abduvoxobov
5 (5)
Trend Sniper X is a multi-timeframe trend-following indicator for MetaTrader 5 that helps traders identify trend direction and potential reversal points with clarity and precision. For MT5: https://www.mql5.com/en/market/product/181101 Price Information: The current price is promotional and is subject to change as upcoming updates and new features are released. Code2Profit Channel Master the Market with Multi-Timeframe Analysis! How to Maximize Your Win Rate with Trend Sniper X: Key Rules & Sess
AW Prime Oscillator
AW Trading Software Limited
5 (1)
A combination of two oscillators. The first one displays the entry points, the second shows the current trend . The indicator can display oscillator signals by arrows in two modes, all fast oscillator signals or signals only in the direction of the current trend. It has a multi-timeframe panel and three types of signal notifications. Benefits: Suitable for day and scalping trading Trend filtering Simple and sensitive setup Multi-timeframe panel Suitable for integration into an advisor. Works on
Liquidity Scalper System: a liquidity-based trading system in indicator form. Most indicators only show an arrow, and the trader then has to decide where the stop goes, where the target is and whether the signal can be trusted at all. Liquidity Scalper System covers the full trade cycle: it finds liquidity pools, gives a signal when they are broken, immediately calculates Entry, Stop Loss and three targets, and shows statistics and out-of-sample test results on the panel. The system picks its o
Atomic Analyst
Issam Kassas
5 (14)
Atomic Analyst — MetaTrader 4 For product questions, setup guidance, or technical support, message me directly here on MQL5. The indicator turns complex market calculations into simple visual signals, color-coded candles, trend readings, stop-loss levels, and multiple take-profit zones that traders can understand quickly and use in real market conditions. Main Trading Uses: Scalping and intraday trading: Designed for fast decision-making, clear arrows, alerts, candle colors, and structured entry
Smart Trend Trading System is a chart indicator for MetaTrader 4 that brings trend information, entry and exit signals, and price levels into one workspace. It combines 10+ trading tools into one system, including trend detection, reversal zones, smart cloud, trailing stop logic, support and resistance, candle coloring, alerts, and multi-timeframe analysis. The system is designed to help you trade different market conditions: Trending markets: Identify the main trend, detect pullbacks, follow mo
Top Bottom Tracker is an indicator based on sophisticated algorithms that analyse the market trend and can detect the highs and lows of the trend / MT5 version . The price will progressively increase until it reaches 500$. Next price --> $99 Features No repainting This indicator does not change its values when new data arrives Trading pairs All forex pairs Timeframe     All timeframes Parameters ==== Indicator configuration ==== Configuration parameter // 40 (The higher the value, the
Scalper Vault
Oleg Rodin
5 (40)
Scalper Vault is a powerful, fully-equipped trading system designed for traders who want to achieve consistency in intraday trading . This high-precision indicator serves as a complete, standalone trading system that delivers institutional-grade analysis for both Forex and Binary Options traders. PLEASE CONTACT ME AFTER PURCHASE TO GET MY TRADING TIPS PLUS A GREAT BONUS! By eliminating the guesswork and complex manual analysis, Scalper Vault allows you to focus purely on execution using easy t
Neuro Poseidon MT4
Daria Rezueva
4.74 (46)
Neuro Poseidon is a new indicator by Daria Rezueva. It combines precise trading signals with adaptive TP/SL levels - creating best possible trades as a result! Message me and get  Neuro Poseidon Assistant  as a gift to automize your trading process! What makes it stand out? 1. Proven profitability on all assets and timeframes 2. Only confirmed BUY and SELL signals present on the chart 3. Adaptive TP & SL levels generated by the software for each trade 4. Easy to understand - suitable for all
Tokyo mt4 Indicator
Vasiliy Strukov
5 (9)
Tokyo Indicator provides a clear visual overview of trend direction, potential trading signals, and market conditions. Its colour-coded, stepped trend line distinguishes bullish phases in blue from bearish phases in magenta. Matching directional arrows highlight potential buying and selling opportunities when the displayed trend changes. An integrated dashboard brings together the current signal, market bias, momentum, volatility, and signal quality in one convenient view. This allows traders t
Trading Special – 30% OFF Best Solution for any Newbie or Expert Trader! This dashboard software is working on 28 currency pairs plus one. It is based on 2 of our main indicators (Advanced Currency Strength 28 and Advanced Currency Impulse). It gives a great overview of the entire Forex market plus Gold or 1 indices. It shows Advanced Currency Strength values, currency speed of movement and signals for 28 Forex pairs in all (9) timeframes. Imagine how your trading will improve when you can watch
SR Liquidity
Oleg Rodin
5 (2)
SR Liquidity is a trading indicator designed to reveal the hidden zones where market liquidity concentrates and price reacts most strongly. These special liquidity areas act as powerful support and resistance levels, giving you a clear map of where the market is most likely to reverse. Instead of drawing ordinary Support/Resistance lines, SR Liquidity analyzes real price behavior to detect the zones where buying and selling pressure accumulate. These are actually the pools of liquidity that driv
M1 Sniper
Oleg Rodin
4.97 (30)
M1 SNIPER  is an easy to use trading indicator system. It is an arrow indicator which is designed for M1 time frame. The indicator can be used as a standalone system for scalping on M1 time frame and it can be used as a part of your existing trading system. Though this trading system was designed specifically for short-term trading, it still can be helpful for all traders. This trading system can be used with any forex pair and time frame, though lower time frames are recommended from M1 up to M
CRT Candle Range Theory HTF MT4 - Ultimate CRT Indicator: Advanced ICT Concepts and Malaysian SnR Trading System Master the Market Maker's Footprints with the Most Advanced Candle Range Theory Indicator. Unlock the true power of Smart Money Concepts (SMC) and trade precisely like the institutions with the Ultimate CRT Indicator. Built exclusively for serious traders, this indicator automates the highly effective Candle Range Theory (CRT), a core pillar of ICT Concepts (Inner Circle Trader), and
Advanced Supply Demand
Bernhard Schweigert
4.91 (302)
Trading Special – 30% OFF Best Solution for any Newbie or Expert Trader! This indicator is a unique, high quality and affordable trading tool because we have incorporated a number of proprietary features and a new formula. With this update, you will be able to show double timeframe zones. You will not only be able to show a higher TF but to show both, the chart TF, PLUS the higher TF: SHOWING NESTED ZONES. All Supply Demand traders will love it. :) Important Information Revealed Maximize the pot
Cycles Predictor Indicator This indicator uses past market cycles to predict future price movements. The indicator scans through past data and considers  combinations  of cycles. When cycles  coincide  at the same future date/time then it is considered a valid future prediction. The predictions are drawn as vertical lines on the right side of the chart in the future. A prediction will often result in type of candle (ex. bull or bear) and/or a reversal point (ex. bottom or top) forming at this ex
GoldRush Trend Arrow Signal V1.6 The GoldRush Trend Arrow Signal indicator V1.6 continues to provide precise, real-time trend analysis tailored for high-speed, short-term scalpers in XAU/USD , but it now has additional features and improved efficiency and reliability. Built specifically for the 1-minute time frame, this tool displays directional arrows for clear entry points, allowing scalpers to navigate volatile market conditions with confidence. The indicator consists of PRIMARY and SECONDARY
Break and Retest Hunter MT4 is a powerful MetaTrader 5 indicator designed to automatically identify support and resistance levels, breakout structures, and potential retest opportunities in real time. Bonus Indicator: After purchasing Break and Retest Hunter , contact me to receive Trade Indicator Assistant EA completely free as a bonus utility. $65 for the next 10 copies . Next price is $120.  Combining adaptive market analysis, clear BUY/SELL signals, Fibonacci-based profit targets, and a pre
PRO Renko System
Oleg Rodin
5 (31)
PRO Renko System is a highly accurate trading system specially designed for trading RENKO charts. The ARROWS and Trend Indicators DO NOT REPAINT! The system effectively neutralizes so called market noise giving you access to accurate reversal signals. The indicator is very easy to use and has only one parameter responsible for signal generation. You can easily adapt the tool to any trading instrument of your choice and the size of the renko bar. I am always ready to provide extra support to help
ForexTrendMT4
Andriy Sydoruk
5 (1)
ForexTrendMT4 Indicator: A Reliable Tool for Market Tracking The ForexTrendMT4 indicator offers reliable market trend tracking, filtering out sudden fluctuations and market noise. This tool helps identify trends and signals favorable entry points into the market using arrows. It is suitable for both scalping on shorter timeframes and long-term trading strategies. Based on the principles of technical analysis, ForexTrendMT4 takes into account the cyclical nature of the market. Key Features and A
CRT Multi-Timeframe Market Structure & Liquidity Sweep Indicator Non-Repainting | Multi-Asset | MT5 Version Available MT5 Version:   https://www.mql5.com/en/market/product/162075 Full User Guide — explains what each feature does and why:   https://www.mql5.com/en/blogs/post/767525 Quick Start User Guide  — explains how to configure and in what order:  https://www.mql5.com/en/blogs/post/767540 Indicator Overview CRT Ghost Candle HTF Fractal is a complete institutional-grade market structure too
Super Signal – Skyblade Edition Professional No-Repaint / No-Lag Trend Signal System with Exceptional Win Rate | For MT4 / MT5 It works best on lower timeframes, such as 1-minute, 5-minute, and 15-minute charts. Core Features: Super Signal – Skyblade Edition is a smart signal system designed specifically for trend trading. It applies a multi-layered confirmation mechanism to detect only strong, directional moves supported by real momentum. This system does not attempt to predict tops or bottoms
Currency Strength Wizard is a very powerful indicator that provides you with all-in-one solution for successful trading. The indicator calculates the power of this or that forex pair using the data of all currencies on multiple time frames. This data is represented in a form of easy to use currency index and currency power lines which you can use to see the power of this or that currency. All you need is attach the indicator to the chart you want to trade and the indicator will show you real str
Trading Special –40% OFF Best Solution for any Newbie or Expert Trader! This Indicator is a unique, high quality and affordable trading tool because we have incorporated a number of proprietary features and a new formula. With only ONE chart you can read Currency Strength for 28 Forex pairs! Imagine how your trading will improve because you are able to pinpoint the exact trigger point of a new trend or scalping opportunity? User manual: click here Looking for the MT5 version? Click here: https:/
Volume Orderflow Profile
Suvashish Halder
5 (2)
Introducing Volume Orderflow Profile , a versatile tool designed to help traders visualize and understand the dynamics of buying and selling pressure within a specified lookback period. Perfect for those looking to gain deeper insights into volume-based market behavior! MT5 Version -  https://www.mql5.com/en/market/product/122657 The indicator gathers data on high and low prices, along with buy and sell volumes, over a user-defined period. It calculates the maximum and minimum prices during this
An arrow tells you to buy. Obsidian Scalper Pro tells you where to buy, where the stop goes, where the three targets are, how big the position should be for your risk, and how good the setup is out of 100. Every signal arrives as a finished trade plan drawn on the chart, and a built in statistics window shows the honest result of the last hundred of them, win rate with a confidence interval and all. Every decision is made on a closed bar, so the history you are looking at is the history you woul
This indicator works on MT4 and is very easy to use. When you receive a signal from it, you wait for that candle with the signal to close and you enter your trade at the beginning of the next new candle . A red arrow means sell and a green arrow means buy. All arrows comes with Alert  like for easy identification of trade signal. Are you okay with that? 1 minute candle 1 minute expire
Trend Lines PRO
Roman Podpora
5 (2)
TREND LINES PRO    helps understand where the market is truly changing direction. The indicator shows real trend reversals and points where major players re-enter. You see   BOS lines   Trend changes and key levels on higher timeframes — without complex settings or unnecessary noise. Signals don't repaint and remain on the chart after the bar closes. VERSION MT 5     -     Reveals its maximum potential when paired with the   RFI LEVELS PRO  indicator What the indicator shows: Real shifts   tren
Binary Trader Master is an arrow based indicator that predicts the close of the candle. It does its analysis within one candle only. When the candle opens it requires a few moments to make the analysis and predict the close of the candle. Then it generates a signal. The indicator also allows you to apply time limits that it can use for the analysis which means that you can actually tell the indicator how much time it is allowed to have for the analysis within the candle. The indicator monitors s
This is a professional chart indicator designed for traders focused on stability and clear price action. It helps filter market noise and provides clear visual entry and exit zones for your trading decisions. Core Features: Strictly Non-Repainting: The system is built with strict non-repaint logic. What you see on the chart is the true historical performance. Confirmed Signals: Signals are triggered and confirmed only after the candle closes . Once a trading arrow appears on a closed candle, it
Gann Made Easy
Oleg Rodin
4.84 (173)
Gann Made Easy is a professional and easy to use Forex trading system which is based on the best principles of trading using the theory of W.D. Gann. The indicator provides accurate BUY and SELL signals including Stop Loss and Take Profit levels. You can trade even on the go using PUSH notifications. PLEASE CONTACT ME AFTER PURCHASE TO GET TRADING  INSTRUCTIONS   AND GREAT EXTRA INDICATORS  FOR FREE! Probably you already heard about the Gann trading methods before. Usually the Gann theory is a
More from author
An arrow tells you to buy. Obsidian Scalper Pro tells you where to buy, where the stop goes, where the three targets are, how big the position should be for your risk, and how good the setup is out of 100. Every signal arrives as a finished trade plan drawn on the chart, and a built in statistics window shows the honest result of the last hundred of them, win rate with a confidence interval and all. Every decision is made on a closed bar, so the history you are looking at is the history you woul
Which of your symbols are trading above the average price of everyone who bought the last swing, and which have just lost it. Anchored VWAP Scanner runs the anchored VWAP across up to twenty eight symbols on four timeframes, publishes a scale free distance in deviations so that symbols can honestly be compared with one another, and keeps the chart under the board for the entry. The price increases by $10 every 10 purchases. Anchored VWAP Scanner is two products in one file. The first is Anchored
Currency Strength Pro ranks the eight major currencies by relative strength, read from up to 28 pairs, on a multi-timeframe composite, then ranks the basket's own pairs into a graded scanner. Closed bars only, never on a tick. The idea is simple: trade a strong currency against a weak one, instead of the chart that happens to look nice today. The strength table answers "which currency". The scanner and its A/B/C grade answer "which pair, and how clean is the setup". What it does The panel ranks
Half Trend MTF draws a stepped trend line that holds its level until the market takes it out, and flips to the other side when it does. Around it sits an ATR channel. The decision it supports is a simple one, and it is stated plainly: the line says which side the trend is currently held on, the flip says the moment that changed, and the channel says how much room the current volatility gives price before the flip is likely to matter. Because the line only moves when the extremes of the last N ba
FREE
Coral Trend
Evgenii Sutulov
A trend line smooth enough to be worth acting on when it finally changes colour. Coral Trend MTF runs a six stage exponential cascade of the T3 family and takes its signal from the colour of the finished line changing, which is one signal per real move rather than one per wobble. It draws a higher timeframe on any chart, reading closed senior bars only, and redraws on the timer so a quiet market still updates. It is free: no trial, no locked features, no upgrade page. Six exponential averages ar
FREE
A trend line that refuses to wander. Half Trend MTF holds its level while the market pushes at it and flips only when the extremes of the last N bars actually take it out, so it sits still through the chop that makes a moving average look like a signal generator. Around it an ATR channel shows how much room today's volatility gives price before that flip is likely to matter. Free, no trial, no locked features. The decision it supports is a simple one, and it is stated plainly: the line says whic
FREE
Eight Donchian channels reduced to one honest number: how many of them price is above, minus how many it is below. Donchian Trend Ribbon MTF publishes that signed score as a buffer, changes side when the majority does, and draws the slowest channel so you can see the level the score is built around. Any higher timeframe on any chart, closed senior bars only. It is free: no trial, no locked features, no upgrade page. A set of Donchian channels is built with growing windows, the base length and th
FREE
Nadaraya Watson Envelope MTF draws a smooth centre line through price and an envelope around it, then marks the bars where price came back inside that envelope after having traded outside it. The question it answers is narrow and it is the only one it claims to answer: price has stretched away from its own recent centre, and it has just stopped stretching. Whether you treat that as a mean-reversion entry, as a place to take profit on a trend position, or as nothing at all is your decision. The i
FREE
Alpha Trend MTF
Evgenii Sutulov
3 (1)
A trailing stop line that asks where the money is going before it decides which side to hold. Alpha Trend MTF builds its trail from ATR and lets money flow choose the side, then takes its signals from the line crossing its own copy two bars back, which is what keeps it quiet in a chop that shakes ordinary trailing stops out. Signals from a higher timeframe can be drawn on any chart, and only closed senior bars are read. It is free: no trial, no locked features, no upgrade page. Two trail levels
FREE
The average price everyone who entered after the last swing is holding, drawn without you having to click an anchor. Anchored VWAP MTF finds the last confirmed swing itself, runs the volume weighted average from there, and puts deviation bands around it so a retest can be told from a breakaway. There is no calendar in it anywhere, so it behaves the same on any symbol and any broker session. It is free: no trial, no locked features, no upgrade page. The volume weighted average price is accumulate
FREE
UT Bot MTF
Evgenii Sutulov
UT Bot MTF is an ATR trailing stop and the flip signals it produces. The stop follows price at a distance of a chosen multiple of ATR, ratchets in the direction of the move and never gives ground back. When price closes through it, the stop flips to the other side and the indicator marks a BUY or a SELL. That is the whole engine, and it is deliberately simple. What this product adds around it is the part that decides whether you can actually use it: four independent filters, an honest account of
FREE
A trailing stop that never gives ground, and the exact bar it turns. UT Bot MTF draws the ATR stop on your chart, marks every BUY and SELL flip, and then does the part almost no version of it does: it tells you how many signals its filters threw away and which filter threw them, and it warns you, in colour, while the arrow on the current bar can still disappear. Free, no trial, no locked features. The engine is deliberately simple. The stop follows price at a chosen multiple of ATR, ratchets in
FREE
Currency Strength Flux
Evgenii Sutulov
3.5 (2)
Currency Strength Flux ranks the eight major currencies by relative strength, read from up to 28 pairs, on a four-timeframe composite that only ever uses closed bars. The idea is simple: trade a strong currency against a weak one, instead of the chart that happens to look nice today. Everything on the panel serves that one decision. What it does The panel ranks EUR, GBP, AUD, NZD, USD, CAD, CHF and JPY from strongest to weakest. Every reading is built from the pairs your broker actually quotes.
FREE
Currency Strength Pro ranks the eight major currencies by relative strength, read from up to 28 pairs, on a multi-timeframe composite, then ranks the basket's own pairs into a graded scanner. Closed bars only, never on a tick. The idea is simple: trade a strong currency against a weak one, instead of the chart that happens to look nice today. The strength table answers "which currency". The scanner and its A/B/C grade answer "which pair, and how clean is the setup". What it does The panel ranks
Know before you take the trade how much of today's move is already gone. ADR Levels MTF prints the two prices a normal day can still reach, marks the bar where the range was fully spent, and puts the per cent already used on the panel, so a late entry stops looking like a fresh one. It builds its days from the bars of the chart you are on, which means the same numbers on M5 and on H4 and no second data feed to wait for. It is free: no trial, no locked features, no upgrade page. The average daily
FREE
Wave Trend Oscillator MTF is a two-line momentum oscillator in its own sub-window. The fast line measures how far the typical price has run from its own smoothed centre, relative to its recent average deviation, and a slower average of that fast line is drawn beside it. The event is a cross between the two lines inside a zone the market has actually reached. Crosses in the middle of the range are not signals, and that single rule is what separates this product from a plain oscillator. Three thin
FREE
QQE Mod MTF
Evgenii Sutulov
QQE Mod MTF is a momentum oscillator in its own sub-window. It runs two independent QQE blocks over RSI and turns them into one readable histogram. QQE, which stands for Qualitative Quantitative Estimation, smooths RSI and then builds a trailing band around it from the smoothed average of the RSI's own absolute changes. The band does not move against the trend, which is what makes a QQE cross slower and less noisy than an RSI cross. This product runs two of those blocks at once and publishes wha
FREE
Currency Strength Flux ranks the eight major currencies by relative strength, read from up to 28 pairs, on a four-timeframe composite that only ever uses closed bars. The idea is simple: trade a strong currency against a weak one, instead of the chart that happens to look nice today. Everything on the panel serves that one decision. What it does The panel ranks EUR, GBP, AUD, NZD, USD, CAD, CHF and JPY from strongest to weakest. Every reading is built from the pairs your broker actually quotes.
FREE
Momentum you can read at a glance, and a product that tells you when it is not sure. QQE Mod MTF runs two independent QQE blocks over RSI and prints one histogram: bright when both blocks agree on a direction, grey when they do not. That grey is the point. Most oscillators give you a colour on every bar and leave you to guess how much it is worth; this one says out loud when there is no confirmation. Free, no trial, no locked features. QQE, which stands for Qualitative Quantitative Estimation, s
FREE
An oscillator that ignores every cross in the middle of the range. Wave Trend Oscillator MTF publishes a cross only when it happens inside a zone the market has actually reached, grades it by how deep that zone was, finds divergences on the fast line and can draw them on the price chart where you trade, and it can compute all of this on a higher timeframe while you watch your own. Free, no trial, no locked functions. The fast line measures how far the typical price has run from its own smoothed
FREE
Squeeze Momentum MTF answers two questions at once, in one sub-window. The first is whether the market is compressed. Bollinger Bands are compared with a Keltner Channel: when the Bollinger Bands sit entirely inside the Keltner Channel, volatility has contracted and the market is in a squeeze. When they push back outside it, the squeeze has released. The second is which way the compressed energy is pointing. A detrended price series is fitted by linear regression and the endpoint of that fit is
FREE
One line, six weighted averages deep, that changes direction instead of crossing something. Cascade WMA Trend MTF chains six weighted moving averages whose periods grow the way a Fibonacci sequence does, which smooths the result far past what a single average of the same length would do, and takes its signal from the finished line turning. Any higher timeframe can be drawn on any chart, closed senior bars only. It is free: no trial, no locked features, no upgrade page. Six weighted moving averag
FREE
QQE Mod Scanner is two products in one file. The first is the QQE Mod oscillator itself, in this chart's own sub-window: two independent QQE blocks over RSI, reduced to one histogram, a trailing line drawn around zero and a Bollinger filter on that line. The state it publishes is the combination of the two, bright when both blocks agree on a direction and grey when they do not. The second is a board that runs the same calculation across a list of symbols on several timeframes at once. The board
Squeeze Momentum Scanner is two products in one file. The first is Squeeze Momentum MTF itself, in this chart's own sub-window: the momentum histogram coloured by expansion and fading, and the row of squeeze dots that says whether the Bollinger Bands are inside the Keltner Channel, outside it, or have just come out. The second is a board that runs the same calculation across a list of symbols on several timeframes at once. A squeeze release is a short-lived event and it happens on different inst
The market goes quiet before it moves, and this window shows both halves of that sentence. Squeeze Momentum MTF marks the bars where Bollinger Bands sit entirely inside the Keltner Channel, prints the exact bar where that compression releases, and colours a momentum histogram so you see which side the stored energy was on when it let go, on this timeframe or a higher one drawn right here. Free, no trial, no locked functions. The first question it answers is whether the market is compressed. Boll
FREE
A kernel regression that does not repaint, which is the whole point. Nadaraya Watson Envelope MTF draws a smooth centre line through price and an error envelope around it, marks the bars where price came back inside after stretching out, and computes every bar from the bars behind it only, so a closed bar never moves. The usual charting-site version of this line is fitted two-sided and rewrites itself under your feet; this one is causal by construction. Free, no trial, no locked functions. The q
FREE
Exhaustion Count MTF counts. It does not predict direction and it does not tell you which way to trade. It answers one question: has this move been going on long enough that it is running out of participants. Two independent phases run on the chart, a setup and a countdown, each with its own rules, its own cancellation conditions and its own place in the buffers an Expert Advisor can read. The setup Nine consecutive closes on one side of the close four bars back, started by a price flip. A bar t
FREE
Nine closes, thirteen counts, and the discipline most implementations quietly drop. Exhaustion Count MTF runs the classic setup and countdown pair with the full cancellation and recycling rules, marks the perfected nines, leaves the Setup Barrier levels on the chart, and never prints a number on a bar that has not closed, so nothing here repaints, ever. Free, no trial, no locked functions. It counts. It does not predict direction and it does not tell you which way to trade. It answers one questi
FREE
A nine or a thirteen is rare on any one chart, and that is precisely why a watch list beats chart-hopping. Exhaustion Count Scanner runs the full setup and countdown method, cancellation and recycling rules included, across your symbol list on up to eight timeframes at once, prints every running count with the count it is heading for, and marks the rows where the timeframes agree. Out of the box it scans fifteen pairs; one setting raises that to twenty-eight. The counts also draw on the chart in
Twenty-eight symbols, four timeframes, one screen, and the trade already on the chart under it. Half Trend Scanner runs the stepped trend line across your whole watchlist, sorts the board by what flipped most recently, and tells you in one column how many timeframes agree on each symbol. Every cell it could not measure explains itself in words instead of going blank, so an empty board is never a mystery. The price increases by $10 every 10 purchases. It is two products in one file. The first is
Filter:
No reviews
Reply to review