FW Stochastic MTF

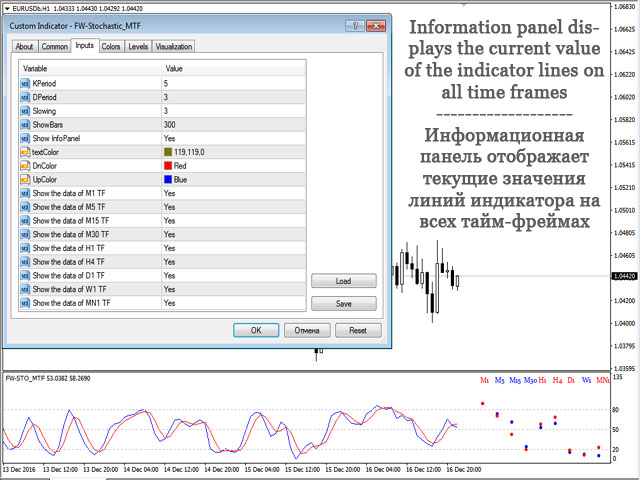
Stochastic is the indicator used by traders the most. This version allows to extract the maximum amount of information without hassle of constantly switching between the timeframes and, thereby, greatly simplifies working with it. This is a standard Stochastic oscillator provided with an info panel displaying the current relative position of %K and %D lines on all timeframes. The info panel is intuitive and easy to use. The oscillator is especially useful in scalping techniques when you need to know its readings both on the current and other timeframes. The colors of the information panel and working timeframes of the indicator can be selected in the settings.

Recommended products
Rainbow Price Visualizer v1.21 See where the market really breathes. Turns your MT4 chart into an ultra-precise heatmap that highlights price zones favored by big players. Why it matters 300 price levels at 0.2‑pip resolution — microscopic detail. 8 visual themes (Rainbow, Fire, Ocean…) for instant readibility. Smart opacity: low noise fades, real zones pop. Lightweight rendering with automatic cleanup. Fully customizable: saturation, opacity, resolution, history depth. Bands project into the f
Crypto_Forex   Indicator HTF Ichimoku for MT4. Ichimoku indicator is   one of the most powerful trend indicators . H TF means -   H igher TimeFrame. This indicator is excellent for Trend Traders as well as combination with Price Action entries. HTF Ichimoku  Indicator allows you to attach Ichimoku from higher timeframe to your current chart. Up trend   - red line above blue one (and both lines are above cloud) /  Down trend   - red line below blue one  (and both lines are below cloud). Open BUY
The Four Moving Averages Message indicator ( please see the description and video ), a version of Four Moving Averages , concurrently displays four Moving Averages with default settings in the main chart window: Green and Red ones represent a short-term trend, Red and Blue ones - mid-term trend, while Blue and Yellow ones - long-term trend. You can change the moving average settings and colors. However, these parameters have been configured so that to allow trading on all time frames. The built-
PABT Pattern Indicator - it's classical system one of the signal patterns. Indicator logic - the Hi & Lo of the bar is fully within the range of the preceding bar, look to trade them as pullback in trend. In the way if indicator found PABT pattern it's drawing two lines and arrow what showing trend way.  - First line - it's entry point and drawing at: 1. On the high of signal bar or on middle of the signal bar (depending from indicator mode) for buy; 2. On the low of signal bar or on middle of t
Delta Fusion Pro
Francesco Secchi
5 (2)
Delta Fusion Pro – Advanced Order Flow Analysis for Intraday Trading Delta Fusion Pro is a professional indicator for MetaTrader 4 that reveals aggressive order flow, showing the intensity and direction of institutional pressure in real time. Unlike traditional volume indicators, it analyzes the delta between Ask and Bid volumes to anticipate reversals, confirm trends, and identify professional interest zones. Key Features Intelligent Auto-Tuning System Automatically adjusts all parameters ba
Nice Trade Point
Muhammed Emin Ugur
This    Nice Trade Point     indicator is designed for signal trading. This indicator generates trend signals. It uses many algorithms and indicators to generate this signal. It tries to generate a signal from the points with the highest trend potential. This indicator is a complete trading product. This indicator does not need any additional indicators. The indicator certainly does not repaint. The point at which the signal is given does not change.     Features and Suggestions Time Frame
Oscillator The Trend Signal indicator is an indicator designed to generate trend signals. It uses its own set of algorithms and the moving average indicator to find signals. It has the feature of filtering the signals with the channel system. In this way, it tries to improve the quality of the signals. Features and Trade strategy There are two channels in the indicator. These channels are 70 and -70 channels. You will reach the signals without losing time thanks to the alarm features found on t
The indicator builds current quotes, which can be compared with historical ones and on this basis make a price movement forecast. The indicator has a text field for quick navigation to the desired date. Options: Symbol - selection of the symbol that the indicator will display; SymbolPeriod - selection of the period from which the indicator will take data; IndicatorColor - indicator color; Inverse - true reverses quotes, false - original view; Next are the settings of the text field, in w
ADX Pointer
Dominik Mandok
ADX Pointer is an indicator which is based on "Average Directional Index" and draws three numbers in chart window depending on the value of ADX. In ADX Pointer you can set "ADX_Period" which is of course period of Average Directional Index and you can also set 3 levels. When ADX value exceed first level ("ADX_Level1") in chart window appears number "1", when ADX exceed second level ("ADX_Level2") appears "2" and when ADX exceed third level ("ADX_Level3") appears "3". Simple. ADX Pointer works on
Crypto_Forex Indicator "Relative Drawdown Display" for MT4, useful trading tool. This is MUST HAVE indicator for traders who use grid trading systems!!! - Relative Drawdown Display indicator shows   current Relative DD   or   Floating Profit in %   on your account.  - PC and Mobile Alerts are built-in with adjustable Trigger level. - Indicator also indicates account   Balance and Equity. - It is possible to locate indicator values in   any corner of the chart . - It   is possible to set up colo
The Magic MA Moving Average Indicator is a market analysis tool that has more than 30 types of moving averages that the trader can use to gauge the market trend. Among the types of moving averages that the trader can visualize are the most common MAs (SMA, EMA and SMMA), adaptive moving averages such as FRAMA and KAMA and other MAs based on innovative calculation and analysis methods such as LSMA, ZLEMA and others. The indicator is designed to display all these moving averages on a single cha
The Two Moving Averages indicator concurrently displays two Moving Averages with default settings in the main chart window: Green and Red lines that represent a short-term trend. You can change the moving average settings and colors. However, these parameters have been configured so that to allow trading on all timeframes. Take a look at how the Moving Averages lines can be used in a profitable multi-currency Trading Strategy on all time frames, that is also suitable for trading in your mobile t
The indicator analyzes the change in the minimum and maximum prices of the previous bars fixing the entrance of the big players. If the change (delta) increases, a signal is displayed on the graph in the form of an arrow. At the same time, virtual trade on history is carried out. In case of a repeat of the signal, the positions are increased (refilling). Thus the lot of positions can differ. The results of virtual trading in the form of losses / losses, profitability, drawdown and transaction li
BW Alligator
Bohdan Kasyanenko
An improved version of the classic Alligator indicator by Bill Williams. Description The Alligator technical indicator is a combination of moving averages (balance lines). Blue line (Alligator Jaw) is a 13-period smoothed moving average, shifted by 8 bars into the future; Red line (Alligator Teeth) is an 8-period smoothed moving average, shifted by 5 bars into the future; Green line (Alligator Lips) is a 5-period smoothed moving average, shifted by 3 bars into the future; Purple line (Fast Gato
SuperTrend V
Muhammad Hassaan
*This is TradingView indicator converted to mql4* The SuperTrend V indicator is a popular technical analysis tool used to identify trends and potential trend reversals in financial markets. It is based on the concept of the SuperTrend indicator but incorporates additional features and variations. The SuperTrend V indicator uses a combination of price action and volatility to determine the trend direction and generate trading signals. Here are the key components and features of the indicator: Ca
Heiken Ashi Smoothed Strategy is a very simple but powerful system to get forex market trend direction. This indicator is actually 2 indicators in 1 pack, Heiken Ashi and Heiken Ashi Smoothed Moving Average both included. Because HA (Heiken Ashi) and HAS (Heiken Ashi Smoothed) are calculated in the same one system event with necessary buffers and loop only, so it is the FAST, OPTIMIZED and EFFICIENT HA having the combined indicator of MetaTrader 4. You can choose to display HA and HAS in the sam
This   indicator is intended for professionals assessing fundamental market trends.  This indicator calculates the index of any instrument and analyzes it.              The index of the state currency shows the real purchasing power of this currency, and the dynamics of this index shows the dynamics of the economic state of the corresponding state. An analysis of the indices of both currencies included in a currency pair makes it much more reliable to identify the trend of this cur
Infinity Trend Pro
Yaroslav Varankin
1 (1)
This is a trend indicator without redrawing Developed instead of the binary options strategy (by the color of the Martingale candlestick) Also works well in forex trading When to open trades (binary options) A signal will appear in the place with a candle signaling the current candle It is recommended to open a deal for one candle of the current timeframe M1 and M5 When a blue dot appears, open a deal up When a red dot appears, open a trade down. How to open trades on Forex. When a signal is rec
The most effective signals generated by Ichimoku strategies. Ichimoku Trade Alarm is a supplement for Ichimoku Trade Panel and it shows the signals that Expert Advisor reacts to. Visualization of signals:  Price / Kijun sen cross - the candle body must be between Min_Candlestick_Body and Max_Candlestick_Body. The candle must close above / below Kijun sen, minimum in 1/3 of its body. Open candle must be located above / below Kijun sen. Chinkou span must be under the price of 26 periods in advanc
Dynamic Forex28 Navigator
Bernhard Schweigert
4.43 (7)
Specials Discount now. The Next Generation Forex Trading Tool. Dynamic Forex28 Navigator is the evolution of our long-time, popular indicators, combining the power of three into one: Advanced Currency Strength28 Indicator (695 reviews) + Advanced Currency IMPULSE with ALERT (520 reviews) + CS28 Combo Signals (recent Bonus) Details about the indicator  https://www.mql5.com/en/blogs/post/758844 What Does The Next-Generation Strength Indicator Offer? Everything you loved about the originals, now
Mastodon
Yvan Musatov
Mastodon - displays potential market entry points. According to the wave theory, Mastodon displays the course of a large wave, while the oscillator can specify the entry point, that is, catch the price movement inside it, i.e. small “subwaves”. By correctly understanding the wave nature of price movements and using the Mastodon indicator in conjunction with an oscillator, you can create your own trading system, for example, entering the market after a large wave has formed and then exiting whe
Alpha Trend sign has been a very popular trading tool in our company for a long time. It can verify our trading system and clearly indicate trading signals, and the signals will not drift. Main functions: Based on the market display of active areas, indicators can be used to intuitively determine whether the current market trend belongs to a trend market or a volatile market. And enter the market according to the indicator arrows, with green arrows indicating buy and red arrows indicating se
Indicador Taurus All4
Fabio Oliveira Magalhaes
Taurus All4 Taurus All4 is a high-performance indicator, it will tell you the strength of the trend, and you will be able to observe the strength of the candle. Our indicator has more than 4 trend confirmations. It is very simple and easy to use. Confirmation Modes Candle Trend Confirmations: When the candle switches to light green the trend is high. When the candle switches to light red the trend is reverting down. When the candle changes to dark red the trend is low. Trendline Trend Confirm
This indicator is the undisputed leader among the indicators. And for this statement there is a good reason. The indicator builds a very high quality channel in which it generates signals to enter! What is the ideal strategy for the trader, since the trader always hesitates when choosing a strategy for the job. That is, this indicator will allow you to solve the dilemma of choosing a job by trend or to the channel, since it combines these two basic concepts. Working with the indicator is very
Great Indicator
Ruben David Santana Rodriguez
Les presento un indicador que funciona como estrategia por si solo , trabaja muy bien en periodos de 4 horas pero puedes aplicarlo a cualquier timeframe , las señales son muy faciles de interpretar , en momento en que la linea naranja pasa hacia arriba las media azul y roja , se entra en largos , la operativa se mantiene abierta hasta que la linea naranja cruce la media mas cercana ya sea la azul o la roja , si la operacion era long y la linea azul cruza hacia arriba la linea roja y la naranja c
StarTrend
Gabriele Tedeschi
StarTrend è un indicatore a freccia che identifica, con alta probabilità, l'inizio di un nuovo trend.  La sua versatilità, però, permette di utilizzarlo anche in strategia in cui cerchiamo operazioni a favore di trend. StarTrend può essere la base del proprio sistema di trading oppure può integrare, per dare conferme o suggerimenti di astensione, il tuo sistema già collaudato. StarTrend invia segnali di preallarme quando c'è un probabile rallentamento della forza del trend e poi disegna una stel
Trend PA
Mikhail Nazarenko
5 (3)
The Trend PA indicator uses   Price Action   and its own filtering algorithm to determine the trend. This approach helps to accurately determine entry points and the current trend on any timeframe. The indicator uses its own algorithm for analyzing price changes and Price Action. Which gives you the advantage of recognizing, without delay, a new nascent trend with fewer false positives. Trend filtering conditions can be selected in the settings individually for your trading style. The indicator
KijunSen vs Price Ichimoku Strategy MM Description in English and Italian = This Indicator is based on one of the Strategies with Ichimoku Indicator, in particular is the cross of the KijunSen with the Current Price; it will give you of Buy and Sell when they Cross, with Arrows and Alerts. When you attach the indicator on the chart , a window will open where , in the INPUT section, you can also choose to change the main Ichimoku values. SIGNAL INPUT =    · BUY = when Price cross above the K
VR Grid
Vladimir Pastushak
5 (3)
The VR Grid indicator is designed to create a graphical grid with user-defined settings. Unlike the standard grid , VR Grid is used to build circular levels . Depending on the user's choice, the step between the round levels can be arbitrary. In addition, unlike other indicators and utilities, VR Grid maintains the position of the grid even when the time period changes or the terminal is rebooted. You can find settings, set files, demo versions, instructions, problem solving, at [blog] You can
FREE
The Vortex Indicator was inspired by the work of an Austrian inventor, Viktor Schauberger, who studied the flow of water in rivers and turbines. Etienne Botes and Douglas Siepman developed the idea that movements and flows within financial markets are similar to the vortex motions found in water. The Vortex Indicator was also partly inspired by J. Welles Wilder's concept of directional movement, which assumes the relationship between price bars gives clues as to the direction of a market. This i
Buyers of this product also purchase
Gann Made Easy
Oleg Rodin
4.83 (162)
Gann Made Easy is a professional and easy to use Forex trading system which is based on the best principles of trading using the theory of W.D. Gann. The indicator provides accurate BUY and SELL signals including Stop Loss and Take Profit levels. You can trade even on the go using PUSH notifications. PLEASE CONTACT ME AFTER PURCHASE TO GET TRADING  INSTRUCTIONS AND GREAT EXTRA INDICATORS   FOR FREE! Probably you already heard about the Gann trading methods before. Usually the Gann theory is a ve
Genesis Matrix Pro is a professional multi-timeframe trend detection indicator designed to help traders identify high-quality market alignment with clarity and structure. It combines 12 different technical indicators into one visual alignment matrix, allowing traders to quickly see when market conditions are bullish, bearish, or neutral. A signal is generated only when the selected strategies are aligned, helping reduce noise and improve decision-making. PLEASE CONTACT ME AFTER PURCHASE TO GET
The Propfolio Master Suite is the ultimate all-in-one analytical workstation for professional traders. Combining the power of the Beat The Market Maker (BTMM) methodology, Smart Money Concepts (SND/Liquidity), and Advanced Volume Profile, this suite replaces multiple different indicators with one optimized engine. Monitor up to 14 pairs simultaneously from a single chart, instantly identify market cycles, and seamlessly map institutional footprints with the click of a button. The Command Center
Scalper Inside PRO
Alexey Minkov
4.74 (69)
Scalper Inside PRO Scalper Inside PRO is an intraday trend and scalping indicator for MetaTrader 4 that uses an exclusive algorithm to quickly detect market direction and key target levels. It automatically calculates entry, exit and multiple profit targets, and shows detailed performance statistics so you can see how different instruments and strategies performed. This helps you choose the most suitable trading instruments for the current market conditions. Additionally, you can easily integrat
M1 Sniper
Oleg Rodin
5 (23)
M1 SNIPER is an easy to use trading indicator system. It is an arrow indicator which is designed for M1 time frame. The indicator can be used as a standalone system for scalping on M1 time frame and it can be used as a part of your existing trading system. Though this trading system was designed specifically for trading on M1, it still can be used with other time frames too. Originally I designed this method for trading XAUUSD and BTCUSD. But I find this method helpful in trading other markets a
PZ Harmonacci Patterns
PZ TRADING SLU
3.17 (6)
Trade smarter, not harder: Empower your trading with Harmonacci Patterns This is arguably the most complete harmonic price formation auto-recognition indicator you can find for the MetaTrader Platform. It detects 19 different patterns, takes fibonacci projections as seriously as you do, displays the Potential Reversal Zone (PRZ) and finds suitable stop-loss and take-profit levels. [ Installation Guide | Update Guide | Troubleshooting | FAQ | All Products  ] It detects 19 different harmonic pric
PRO Renko System
Oleg Rodin
5 (30)
PRO Renko System is a highly accurate trading system specially designed for trading RENKO charts. The ARROWS and Trend Indicators DO NOT REPAINT! The system effectively neutralizes so called market noise giving you access to accurate reversal signals. The indicator is very easy to use and has only one parameter responsible for signal generation. You can easily adapt the tool to any trading instrument of your choice and the size of the renko bar. I am always ready to provide extra support to help
Auto Optimized Parabolic RSI: Advanced 3D Momentum Engine Most retail indicators fail because they rely on static inputs that break the moment market volatility shifts. Auto Optimized Parabolic RSI solves the problem of "indicator decay" by continuously recalculating its own mathematical edge, bringing institutional-grade quantitative adaptation directly to your MT5 terminal. The Core Advantage: Custom In-Memory 3D Optimization   Standard auto-optimizers often freeze the MT5 platform because the
NAM Order Blocks
NAM TECH GROUP, CORP.
3.67 (3)
MT4 Multi-timeframe Order Blocks detection indicator. Features - Fully customizable on chart control panel, provides complete interaction. - Hide and show control panel wherever you want. - Detect OBs on multiple timeframes. - Select OBs quantity to display. - Different OBs user interface. - Different filters on OBs. - OB proximity alert. - ADR High and Low lines. - Notification service (Screen alerts | Push notifications). Summary Order block is a market behavior that indicates order collection
Quants HL Break
Ferhat Mutlu
5 (2)
Advanced calculation made by pure price action to find LH and HL breakouts. It will give you a great reversal points in the market. LH and HL signals can used for the traingle breakouts as well. Once breakout happens its indicate strong reversal. Nice filter for Moving Averages. I highly suggest to use that with trend indicators. Can be used as an extra confirmation for support and resistance , supply demand indicators. The indicator is not repainting. Buffers :   SetIndexBuffer ( 0 ,UpBar);
RFI levels PRO
Roman Podpora
5 (1)
The indicator accurately shows the reversal points and price return zones where the   Major players . You see where new trends are forming and make decisions with maximum precision, maintaining control over every trade. VERSION MT5     -     Reveals its maximum potential when combined with the   TREND LINES PRO   indicator What the indicator shows: Reversal structures and reversal levels with activation at the beginning of a new trend. Display of   TAKE PROFIT   and   STOP LOSS   levels with mi
Trend Catcher ind
Ramil Minniakhmetov
TREND CATCHER INDICATOR Trend Catcher Indicator analyzes market price movements, using a combination of the author’s proprietary and customized adaptive trend-analysis indicators.  It identifies the true market direction by filtering out short-term noise and focusing on underlying momentum strength, volatility expansion, and price structure behavior.  It also uses a combination of smoothing and trend-filtering customized indicators such as moving averages, RSI, and volatility filters.   Real ope
Apollo SR Master is a Support/Resistance indicator with special features which make trading with Support/Resistance zones easier and more reliable. The indicator calculates Support/Resistance zones in real-time without any time lag by detecting local price tops and bottoms. Then to confirm the newly formed SR area, the indicator shows special signal which signalizes that the SR zone can be taken into consideration and used as an actual SELL or BUY signal. In this case the strength of the SR zone
New Update of Smart Trend Trading System MT5 For  2026 Market: If You Buy this Indicator you will Get my Professional   Trade Manager + EA  for   FREE . First of all Its worth emphasizing here that this Trading System is   Non-Repainting   , Non Redrawing and Non Lagging Indicator   Which makes it ideal from both manual and robot trading .  [Online course] ,   [manual]   and   [download presets] . The Smart Trend Trading System MT5 is a comprehensive trading solution tailored for   new   and   e
GoldRush Trend Arrow Signal V1.6 The GoldRush Trend Arrow Signal indicator V1.6 continues to provide precise, real-time trend analysis tailored for high-speed, short-term scalpers in XAU/USD , but it now has additional features and improved efficiency and reliability. Built specifically for the 1-minute time frame, this tool displays directional arrows for clear entry points, allowing scalpers to navigate volatile market conditions with confidence. The indicator consists of PRIMARY and SECONDARY
Introduction to Fractal Pattern Scanner Fractal Indicator refers to the technical indicator that makes use of the fractal geometry found in the financial market. Fractal Pattern Scanner is the advanced Fractal Indicator that brings the latest trading technology after the extensive research and development work in the fractal geometry in the financial market. The most important feature in Fractal Pattern Scanner is the ability to measure the turning point probability as well as the trend probabi
Trading Special –40% OFF Best Solution for any Newbie or Expert Trader! This Indicator is a unique, high quality and affordable trading tool because we have incorporated a number of proprietary features and a new formula. With only ONE chart you can read Currency Strength for 28 Forex pairs! Imagine how your trading will improve because you are able to pinpoint the exact trigger point of a new trend or scalping opportunity? User manual: click here That's the first one, the original! Don't buy a
Market Structure Patterns MT4
Samuel Manoel De Souza
5 (18)
Market Structure Patterns   is an indicator based on   smart money concepts   that displays   SMC/ICT   elements that can take your trading decisions to the next level. Take advantage of the   alerts ,   push notifications   and   email messages   to keep informed from when an element is formed on the chart, the price crosses a level and/or enters in a box/zone. Developers can access the values of the elements of the indicator using the   global variables  what allows the automation of trading d
Advanced Supply Demand
Bernhard Schweigert
4.91 (300)
Trading Special – 40% OFF Best Solution for any Newbie or Expert Trader! This indicator is a unique, high quality and affordable trading tool because we have incorporated a number of proprietary features and a new formula. With this update, you will be able to show double timeframe zones. You will not only be able to show a higher TF but to show both, the chart TF, PLUS the higher TF: SHOWING NESTED ZONES. All Supply Demand traders will love it. :) Important Information Revealed Maximize the pot
Contact me after purchase to get Bonus EA based on this indicator. The Self Optimizing Double MA Strategy is a professional-grade trading tool designed to eliminate parameter guesswork. Powered by a built-in auto-optimization engine, it continuously adapts to shifting market conditions by simulating thousands of parameter combinations in the background to maintain a statistical edge. Instead of relying on static, outdated settings, the indicator dynamically updates its own logic to find the mos
If you trade Forex, having detailed information about the currency strength and currency pairs correlation can take your trading to new heights. The correlation will help to cut your risk in half, and strength analysis will help to maximize the profits. This indicator provides a hybrid approach for selecting the most appropriate currency pairs using the strength analysis and currency pairs correlation. How to use the Currency Strength Analysis Suppose your trading strategy provides a buying opp
CRT Candle Range Theory HTF MT4.   Ultimate CRT Indicator: Advanced ICT Concepts and Malaysian SnR Trading System Discounted   Price   $50  !!     Secure your lifetime access   now   before it switches to   subscription-only ! Master the Market Maker's Footprints with the Most Advanced Candle Range Theory Indicator Unlock the true power of   Smart Money Concepts (SMC)   and trade precisely like the institutions with the   Ultimate CRT Indicator . Built exclusively for serious traders, this indic
Day Trader Master is a complete trading system for traders who prefer intraday trading. The system consists of two indicators. The main indicator is the one which is represented by arrows of two colors for BUY and SELL signals. This is the indicator which you actually pay for. I provide the second indicator to my clients absolutely for free. This second indicator is actually a good trend filter indicator which works with any time frame. THE INDICATORS DO NOT REPAINT AND DO NOT LAG! The system is
KURAMA GOLD SIGNAL PRO (MT4) — Complete XAUUSD Trading System with 7-Layer Filter, Auto TP/SL, and Quality Scoring NON-REPAINTING. NON-REDRAWING. NON-LAGGING. Every signal is permanent. What you see is what you get. BONUS: Buy the lifetime license and receive AI Zone Radar ($59 value) + full PDF manual FREE. Message me after purchase. AI Zone Radar: https://www.mql5.com/en/market/product/175834 TRUSTED BY TRADERS: Already used by an active community of Gold traders. Praised for accuracy and
The " Dynamic Scalper System " indicator is designed for the scalping method of trading within trend waves. Tested on major currency pairs and gold, compatibility with other trading instruments is possible. Provides signals for short-term opening of positions along the trend with additional price movement support. The principle of the indicator. Large arrows determine the trend direction. An algorithm for generating signals for scalping in the form of small arrows operates within trend waves.
Master head and shoulders patterns for better trading decisions A head and shoulders pattern is a chart formation that resembles a baseline with three peaks, the outside two are close in height and the middle is highest. It predicts a bullish-to-bearish trend reversal and is believed to be one of the most reliable trend reversal patterns. It is one of several top patterns that signal, with varying degrees of accuracy, that a trend is nearing its end. [ Installation Guide | Update Guide | Trouble
PZ Double Top Bottom
PZ TRADING SLU
5 (1)
Trade double tops and bottoms effectively The PZ Double Top/Bottom Indicator is a technical analysis tool that helps traders identify potential price reversal patterns in the market. These patterns, known as double tops and bottoms, are characterized by two consecutive peaks or valleys in the price of an asset. Double tops and bottoms are often seen as potential reversal patterns because they can signal a change in the direction of the current trend. [ Installation Guide | Update Guide | Troubl
Special offer : ALL TOOLS , just $35 each! New tools   will be   $30   for the   first week   or the   first 3 purchases !  Trading Tools Channel on MQL5 : Join my MQL5 channel to update the latest news from me The Three Bar Reversal Pattern Indicator offers a powerful tool for traders, automatically identifying and highlighting three-bar reversal patterns directly on the price chart. This indicator serves as a valuable resource for detecting potential trend reversals and enables users to refin
Technical indicator that structures charts and identifies cyclical price movements. Can work on any charts. Several types of alerts. There are additional arrows on the chart itself. Without redrawing on history, works on closing a candle. Recommended TF from M5 and higher. Easy to use and configure parameters. When using 2 indicators with different parameters, you can use without other indicators. Has 2 input parameters Cyclicality and Signal duration These 2 parameters work with the processin
KuKl
IGOR KIRIANEN
The indicator is built on a non-standard Zig Zag, it draws accumulations after which if the price leaves this zone and a test of this zone occurs, then a sound signal is given and an arrow appears - after the test candle closes.The indicator does not redraw its signals, it is very easy to use, there are only three settings 1- this is the zig zag parameter 2- this is the minimum price exit from the zone 3- this is the maximum price exit from the zone. The lower the parameter for Zig Zag, the more
More from author
Volume Ticks ResSup
Sergey Zhukov
4.57 (7)
The market price is moved by the market makers with large amounts of equity. The only way to understand intentions of big players is to track their activity by concentration of volumes on one level or another. Volume Ticks ResSup draws a level with the maximum concentration of a tick volume since the beginning of a day. In most cases, such level is an actual support or resistance level. Parameters ColorLevelSupport - support line color; ColorLevelResistance - resistance line color; BarsDayCount
Hummingbird
Sergey Zhukov
1.5 (2)
The Expert Advisor is based on the momentum of the price rate of change. When the speed of the price begins to increase sharply, the EA opens an order in the direction of its movement. Rate of Change is defined as the distance of StepPrice ticks that the price has moved for the period of TimePrice seconds. In contrast to the standard algorithm, virtual levels are modified not only after the TimePrice time, but also after the change of direction of the price movement—momentum. The built-in filter
The main rule of the profitable trading is opening trades in the direction of a trend. You can define the current trend using fractal analysis. Important Levels ResSup displays important price levels on the chart. The breakthrough of those levels shows the price direction. The data panel allows you to track the current trends on all timeframes. The current timeframe's important level values are shown in the comments. The indicator can be useful for traders working by levels. It can also be a par
The ProfileVolumesMarket indicator calculates tick volume on each price level in a selected range. Volume is vital when determining strength and therefore significance of price levels. The calculation range is set by a trader by means of moving two vertical lines. Thus the indicator allows to track important levels on different steps of a symbol price formation. A histogram of volume profile can be displayed on the chart (or removed from the chart) if you press "ON" ("OFF") button. When you chan
The indicator is created for professional trading by Fibonacci levels. AutoFiboLevels plots Fibonacci retracement and extension levels on impulse and corrective wave. The indicator unambiguously interprets a market situation. Points of extremum for level plotting are calculated using fractal analysis. A trader can independently set retracement and extension levels and calculation time frame adjusting the indicator for various strategies. Parameters: WorkTF - time frame for indicator calculation
The indicator calculation is based on the analysis of the price characteristics of bars and is adjusted by the ATR value. The degree of the ATR influence is determined by the ratio. The color scheme of the indicator depends on the direction of the current trend. A change in the trend is displayed by an arrow and a corresponding message. Depending on the strategy chosen by the trader, this indicator can be used to generate market entry signals, to place stop loss or close trades, and can also be
OnlyTrend
Sergey Zhukov
The indicator has been developed as a trading system component. It has proven to be an efficient technical tool when following a trend. The indicator shows the most suitable market entry points. It can be especially useful to those who add to positions after corrections in the trend direction. When a signal appears, the indicator generates an alert. The settings contain the depth of the indicator display history and ability to disable alerts. The signal is generated upon closing of the current
The main rule of the profitable trading is opening trades in the direction of a trend. You can define the current trend using fractal analysis. The Important Zone ResSup indicator displays important price support and resistance levels on the chart. The breakthrough or bounce from those levels shows further price direction. The data panel allows you to track the current trends on all timeframes. The current timeframe's important level values are shown in the comments. The indicator can be useful
RBCI hist
Sergey Zhukov
The RBCI hist indicator is an adaptive trend histogram, that eliminates noise using a Low-pass filter, which passes the lower frequencies and cuts off hight frequencies of the price fluctuations. The signal (depending on the strategy chosen by trader) is the intersection of the zero line by the indicator, as well as the change in the histogram color. The change in the histogram color serves as an early signal for opening positions towards the trend. The position of the indicator relative to the
The Volume Impuls VSA indicator paints a histogram of volumes tading into account the bar direction and comparing it with the volume of previous bars. The volume of the rising and falling trend are painted respectively in blue and in red. If the current volume exceeds the volumes of the opposite direction, an impulse is formed. Accordingly, the impulse of the upward and downward trends are painted in blue and orange. Also the indicator displays three levels, based on which you can easily compare
Indicator based trading according to the price analysis of bars, the most popular among traders. The indicators calculated based on larger periods are used for identification of a stable trend on the market, and the ones calculated based on smaller periods are used for entering the market after a correction. The oscillators with overbought and oversold levels have a special place in indicator-based trading. The values of such indicators are subjected to wave structure - the higher waves (chart t
Spring
Sergey Zhukov
This multifunctional Expert Advisor has been created in the form of a designer and is suitable both automatic and manual trading. Its main advantage is the ability to select and adjust the strategy for the current market conditions. To recover from the drawdown, the EA fully utilizes the feature of the currency market - the price cannot remain in a narrow channel for a long time. A breakout of the flat in one direction or another is inevitable. So, by placing orders in the breakout direction, yo
ADX is one of the indicators most commonly used by traders. This version allows to extract the maximum amount of information without hassle of constantly switching between the timeframes and, thereby, greatly simplifies working with it. This is a standard ADX indicator provided with an info panel displaying the current relative position of -DM and +DM lines on all timeframes. Blue circle - uptrend. Red circle - downtrend. Yellow circle - no trend. Blue arrow - (+DM) > (-DM); Red arrow - (-DM) >
Filter:
No reviews
Reply to review