Market Direction
- Indicators
-
Agus Santoso
 DISCLAIMER ON : The author of EA will not be held responsible for your losses or problems of any kind if the EA is directly or indirectly responsible for any losses.
Our software is provided “as is”, without any warranty or condition of any kind, express, implied or statutory. - Version: 1.0
- Activations: 5
MQL5 Blogs : https://www.mql5.com/en/blogs/post/776450
MT4 Version : https://www.mql5.com/en/market/product/198190
MT5 Version : https://www.mql5.com/en/market/product/198191
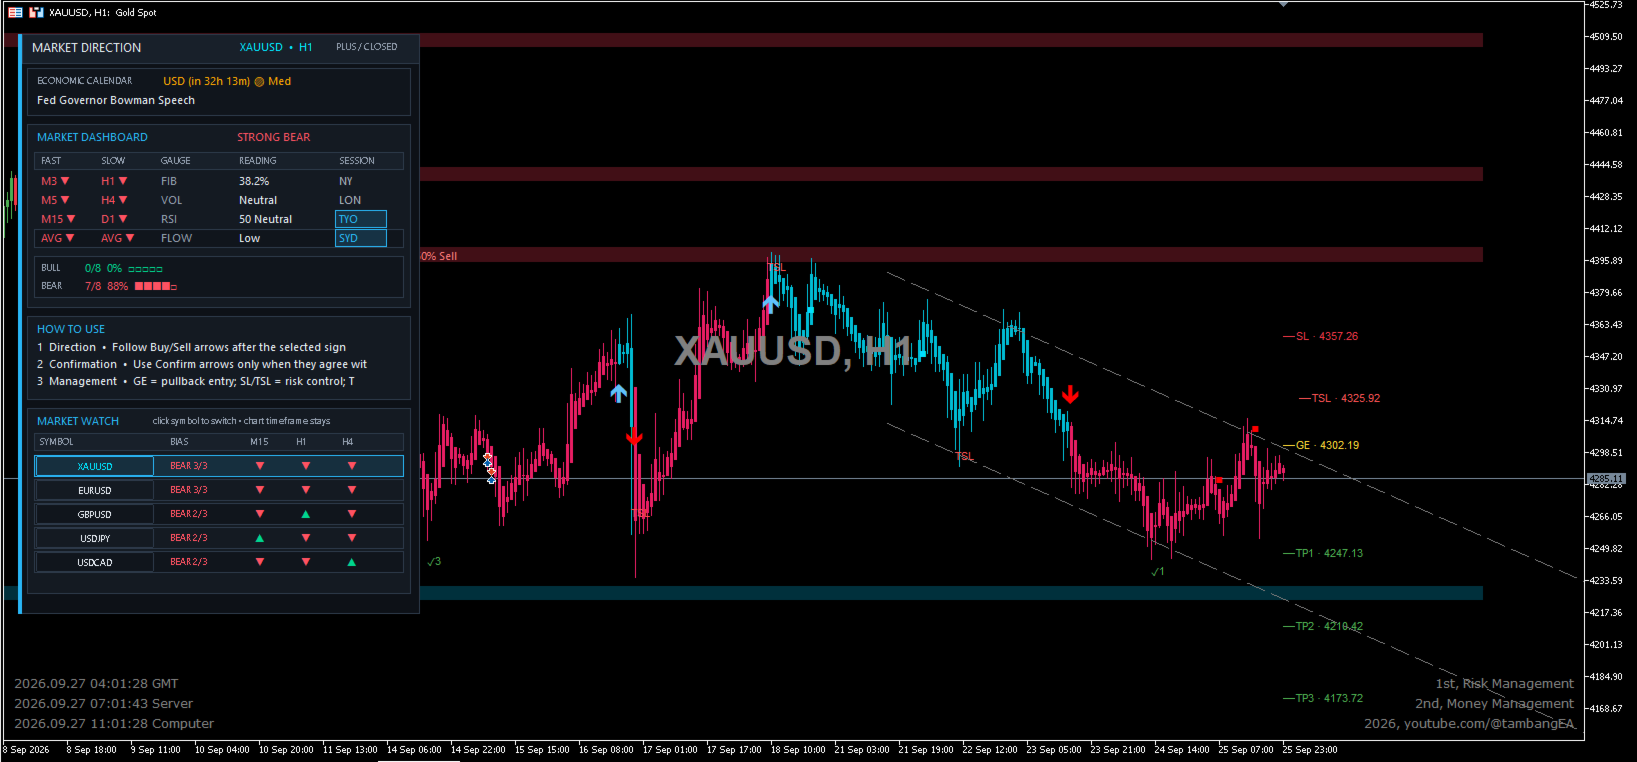
MARKET DIRECTION [tambangEA] is a multi-layer market analysis indicator designed to combine trend direction, momentum, multi-timeframe confirmation, Supply & Demand zones, market structure, risk-management levels, trading sessions, economic news context, and multi-symbol monitoring in one integrated dashboard.
The indicator is built as a structured decision-support environment. Instead of relying on a single signal, MARKET DIRECTION presents several layers of information so traders can evaluate market direction, confirmation, context, and risk from one chart.
It can be used on Forex, Gold, indices, metals, and other instruments supported by MetaTrader.
Main Features
Market Direction Engine
The core directional engine combines:
- Heikin-Ashi based price processing
- ATR volatility normalization
- Dual Supertrend logic
- Fast and slow directional analysis
- Optional breakout filtering
- Closed-bar or live signal mode
Three operating modes are available:
MARKET DIRECTION BASE
A more responsive directional mode based on the faster trend engine.
MARKET DIRECTION PLUS
Uses a slower trend configuration for a more conservative directional assessment.
MARKET DIRECTION FILTER
Combines the trend regime with breakout confirmation to reduce unnecessary signals during sideways conditions.
Buy and Sell Signals
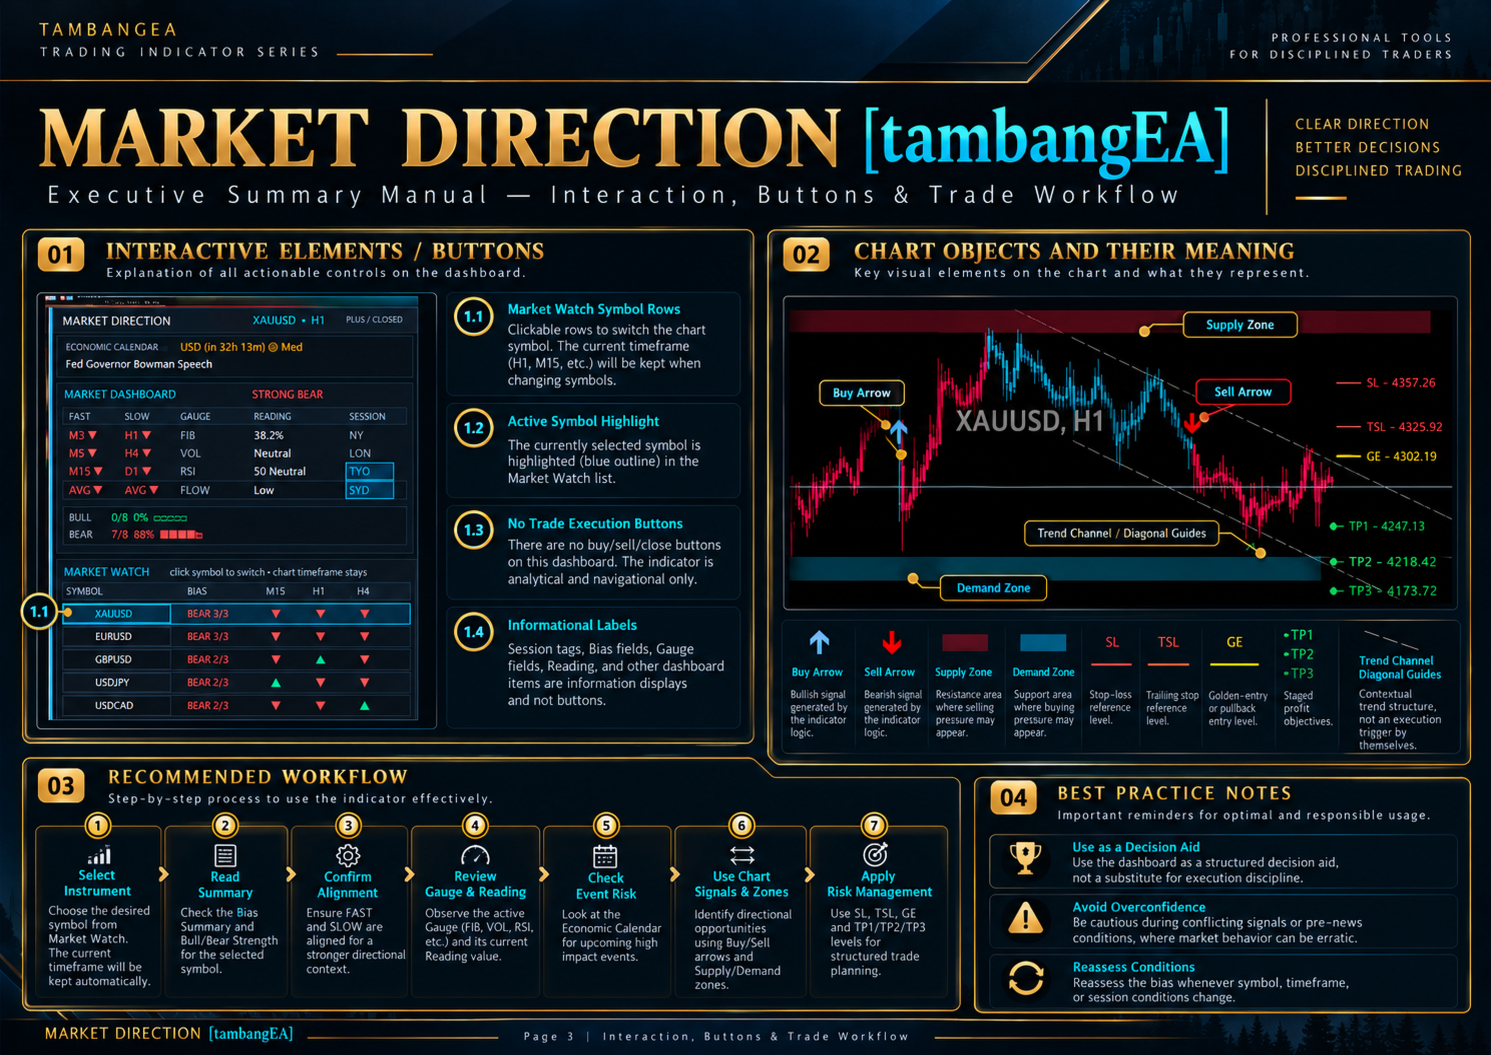
The indicator displays clear directional arrows directly on the chart.
Blue / Cyan Buy Arrow
Indicates a bullish Market Direction signal.
Red Sell Arrow
Indicates a bearish Market Direction signal.
Optional confirmation signals can also be used to identify momentum candles that agree with the prevailing direction.
For more conservative analysis, the indicator can operate using closed-bar confirmation, helping reduce intrabar signal changes.
Multi-Timeframe Dashboard
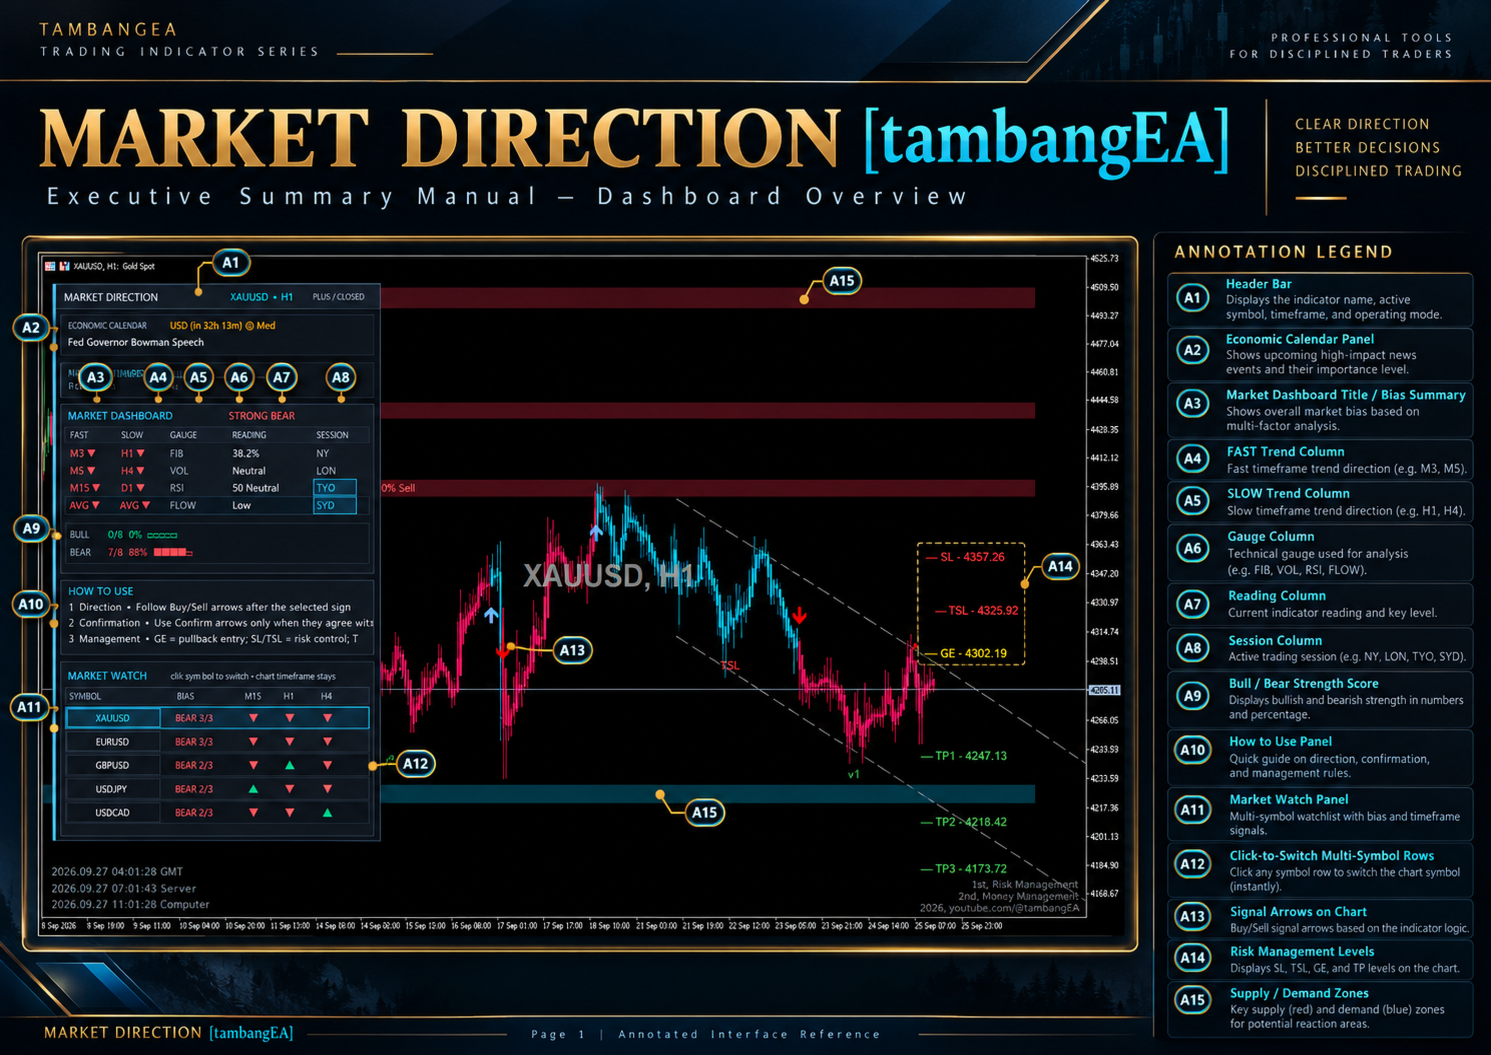
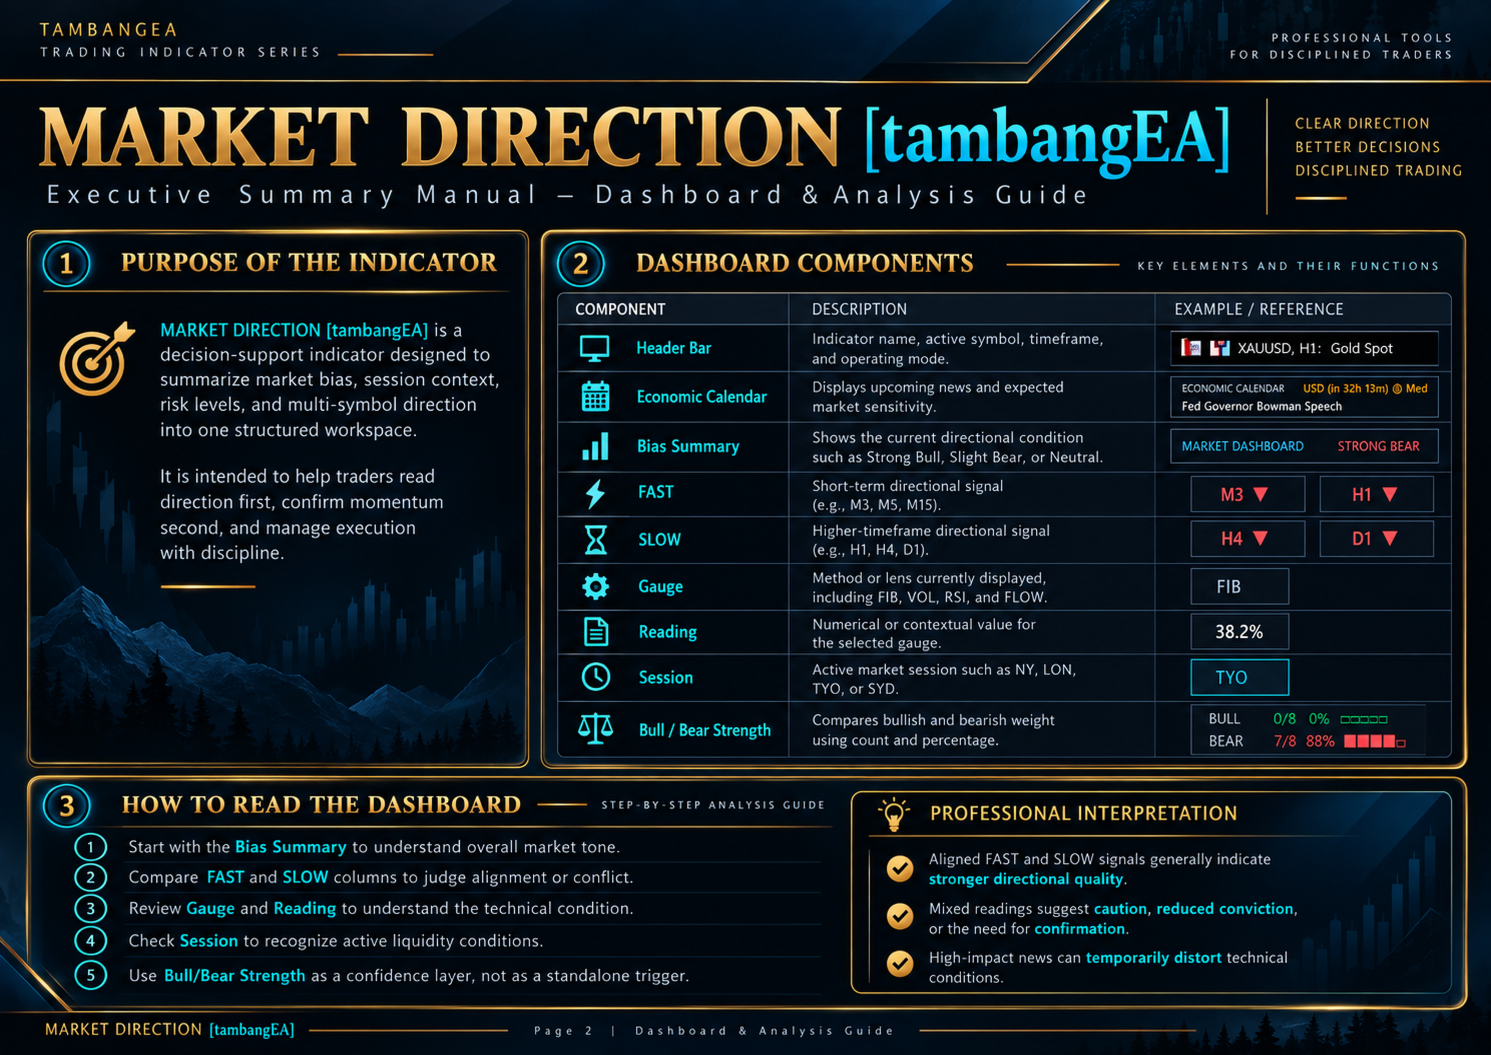
The integrated dashboard provides a quick overview of directional conditions across several timeframes.
The dashboard includes:
- FAST trend group
- SLOW trend group
- Average directional condition
- Fibonacci reading
- Volatility condition
- RSI condition
- Market flow / volume condition
- Active trading sessions
- Bullish strength
- Bearish strength
- Overall directional judgment
Typical dashboard conditions may include:
- STRONG BULL
- MODERATE BULL
- SLIGHT BULL
- NEUTRAL
- SLIGHT BEAR
- MODERATE BEAR
- STRONG BEAR
The dashboard is designed to provide context rather than act as a standalone entry trigger.
Bull / Bear Strength Meter
MARKET DIRECTION calculates the relative alignment of several directional components.
The panel displays:
- Bullish vote count
- Bearish vote count
- Bullish percentage
- Bearish percentage
- Visual strength blocks
This makes it easier to see whether multiple analytical components are aligned or conflicting.
Multi-Symbol Market Watch
The built-in Market Watch panel allows several symbols to be monitored directly from the chart.
For each symbol, the panel displays:
- Composite bullish / bearish bias
- Strength score
- Direction on three configurable timeframes
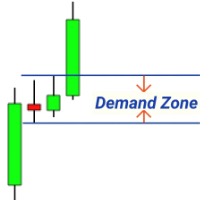
Supply and Demand Zones
The indicator automatically identifies potential:
- Supply zones
- Demand zones
Zones are derived from confirmed swing structures and volume information.
Volume statistics can also be displayed inside the zones to provide additional market context.
Interactive Zone Hover
When using the supported candle display mode, moving the mouse over a Supply or Demand zone can temporarily reveal the corresponding Heikin-Ashi directional coloring within the zone.
This makes it easier to inspect the price behavior associated with the area without permanently changing the entire chart display.
Market Structure
Optional market structure analysis includes:
- Internal structure
- External structure
- Break of Structure — BoS
- Change of Character — CHoCH
Internal and external structures are calculated independently.
This allows traders to examine short-term structural changes while maintaining awareness of the broader market swing structure.