MARKET DIRECTION

MQL5 Blogs : https://www.mql5.com/en/blogs/post/776450
MT4 Version : https://www.mql5.com/en/market/product/198190
MT5 Version : https://www.mql5.com/en/market/product/198191
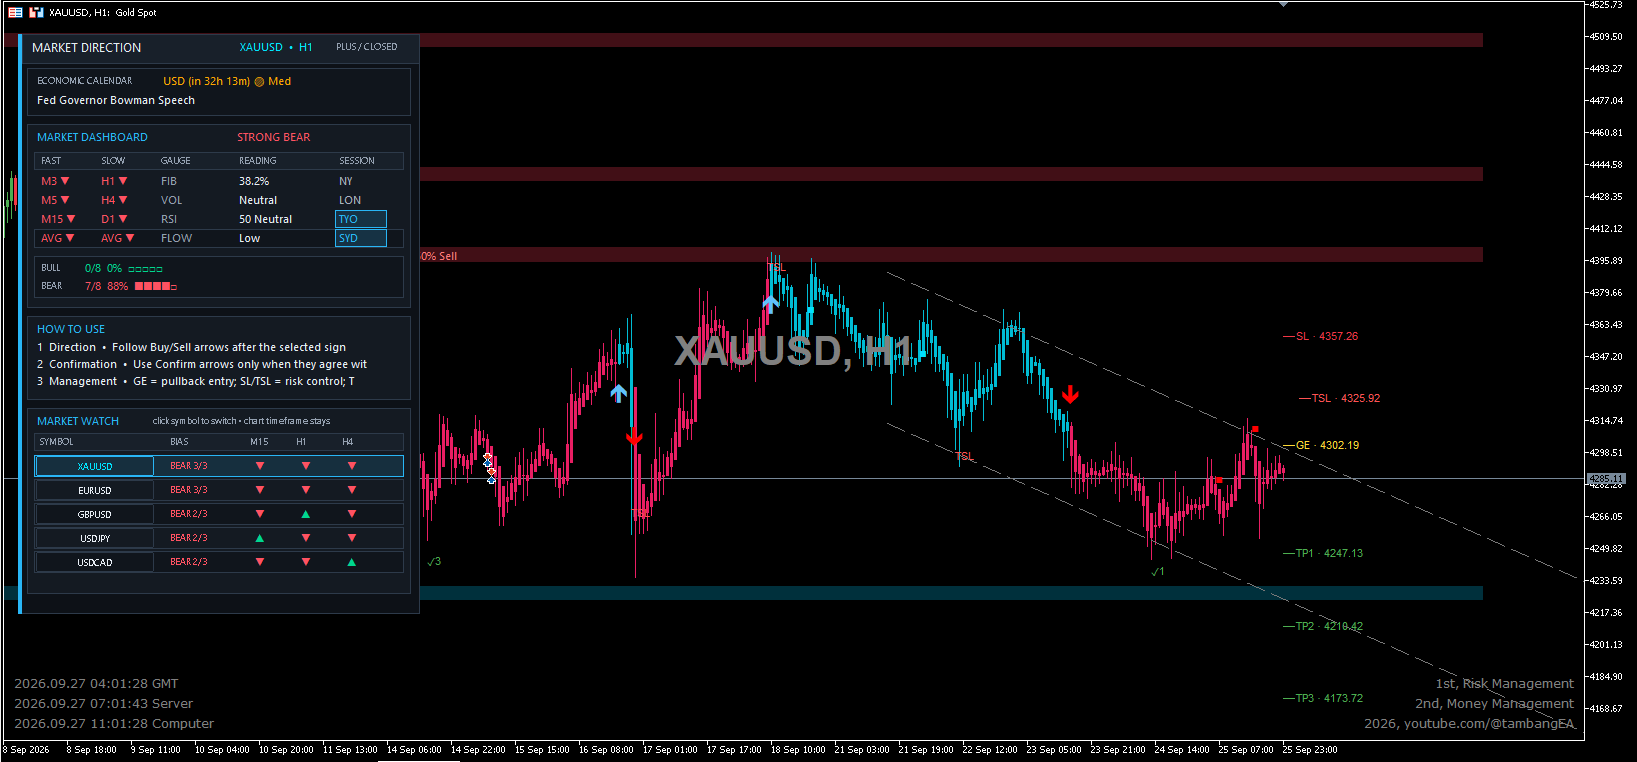
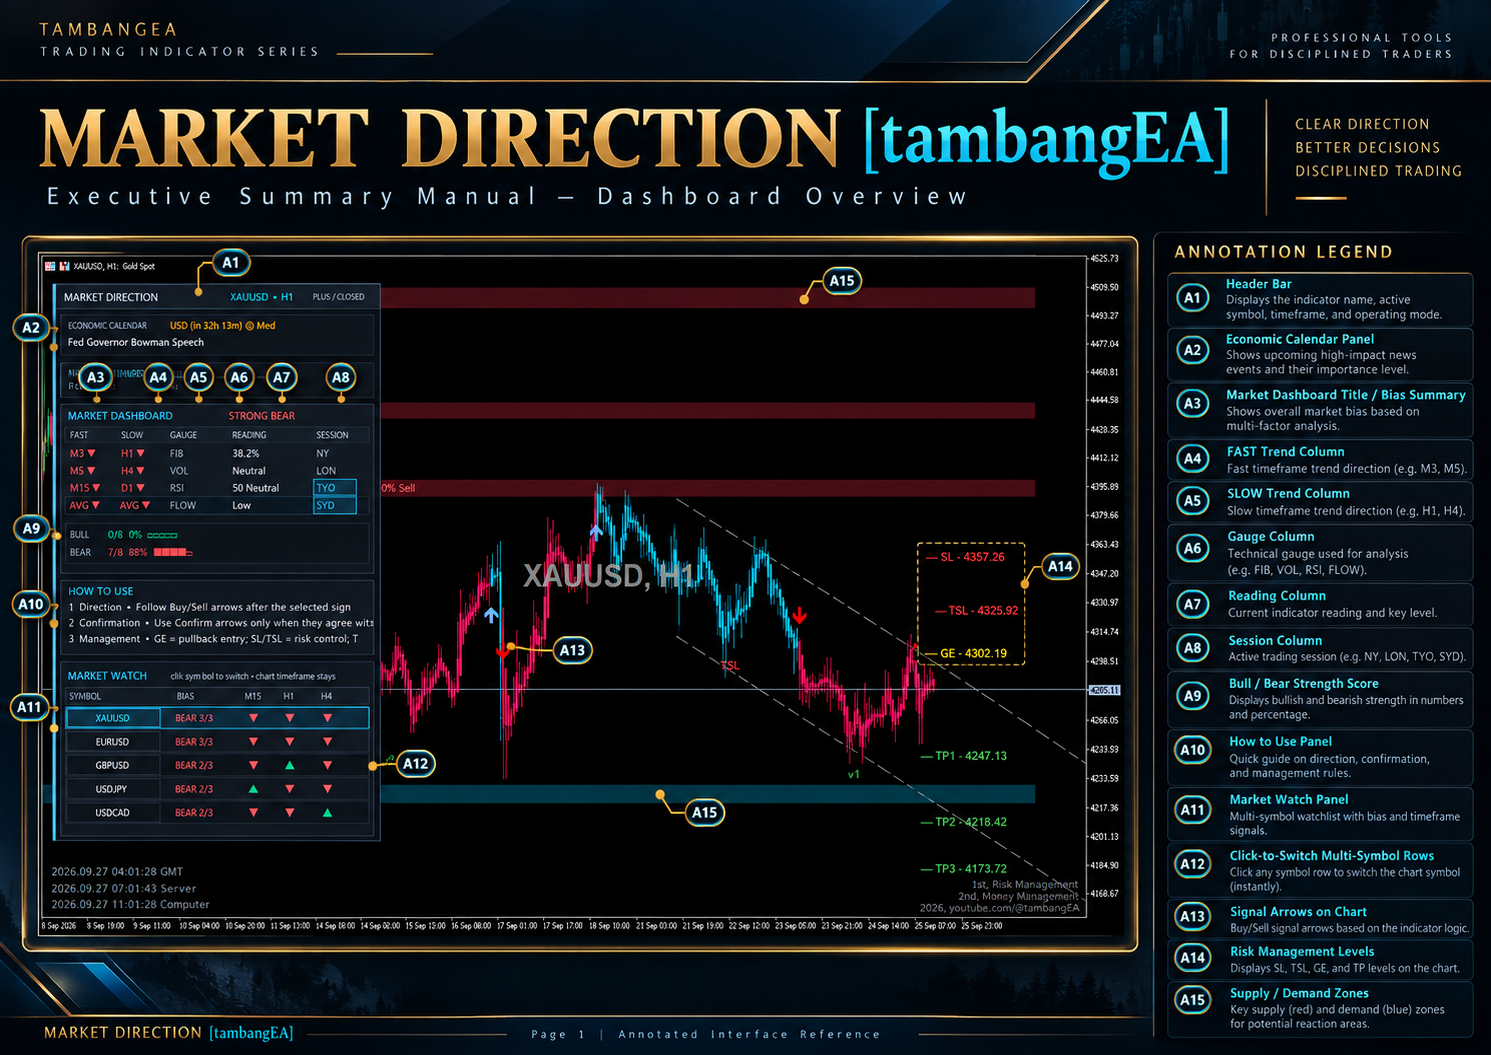
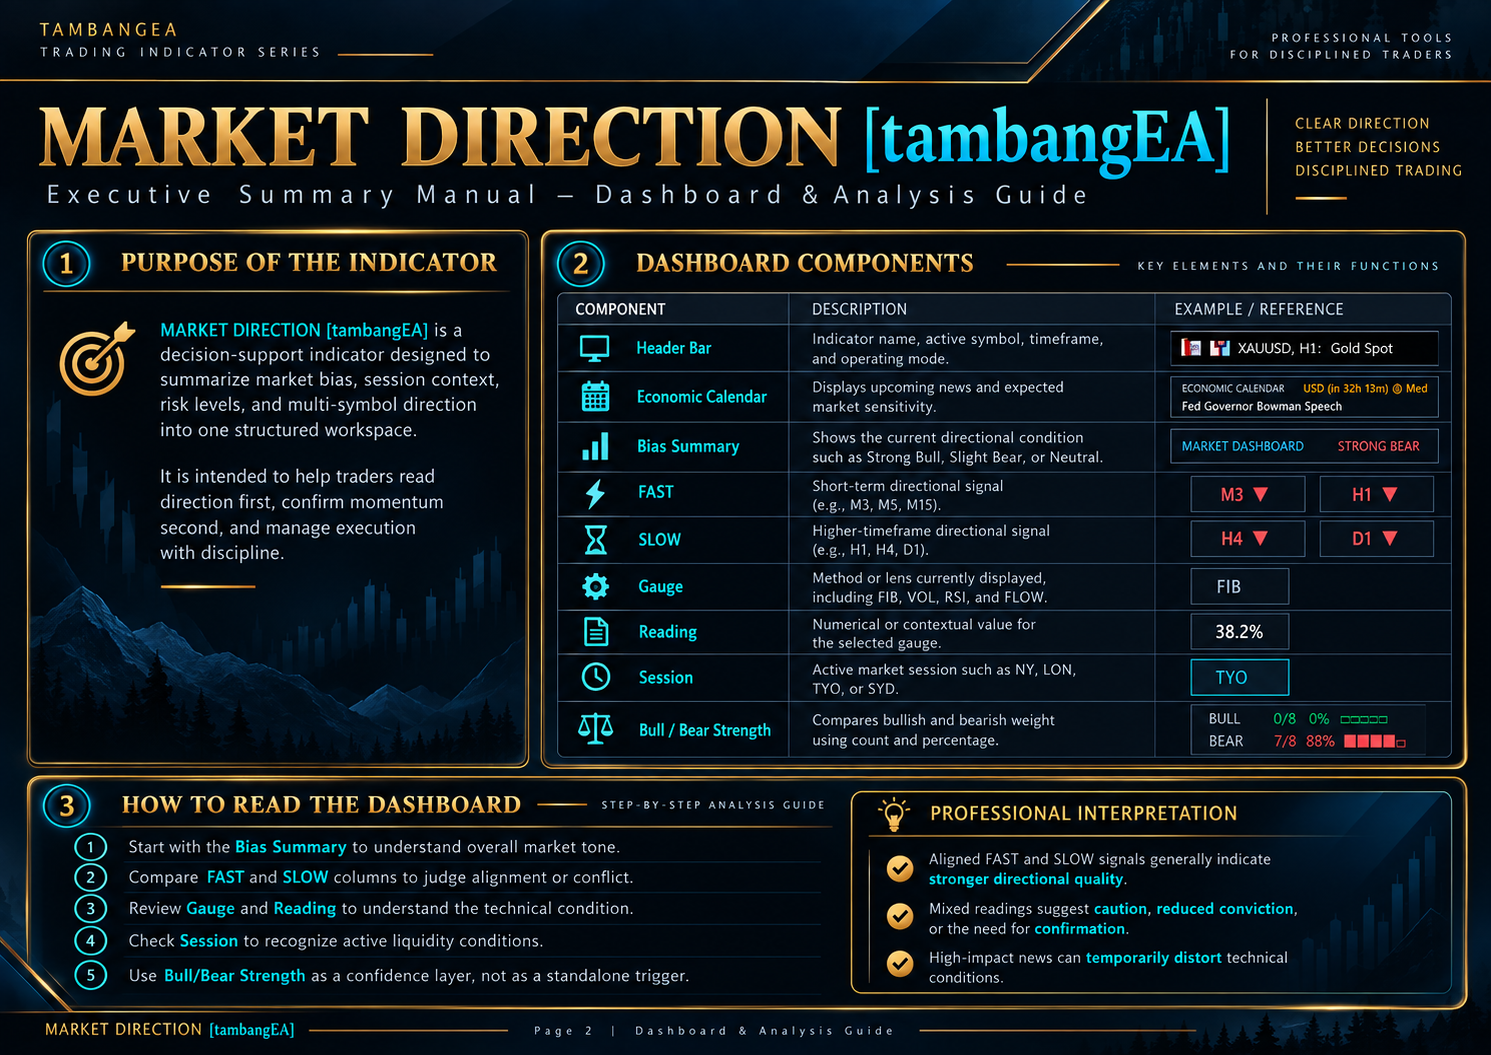
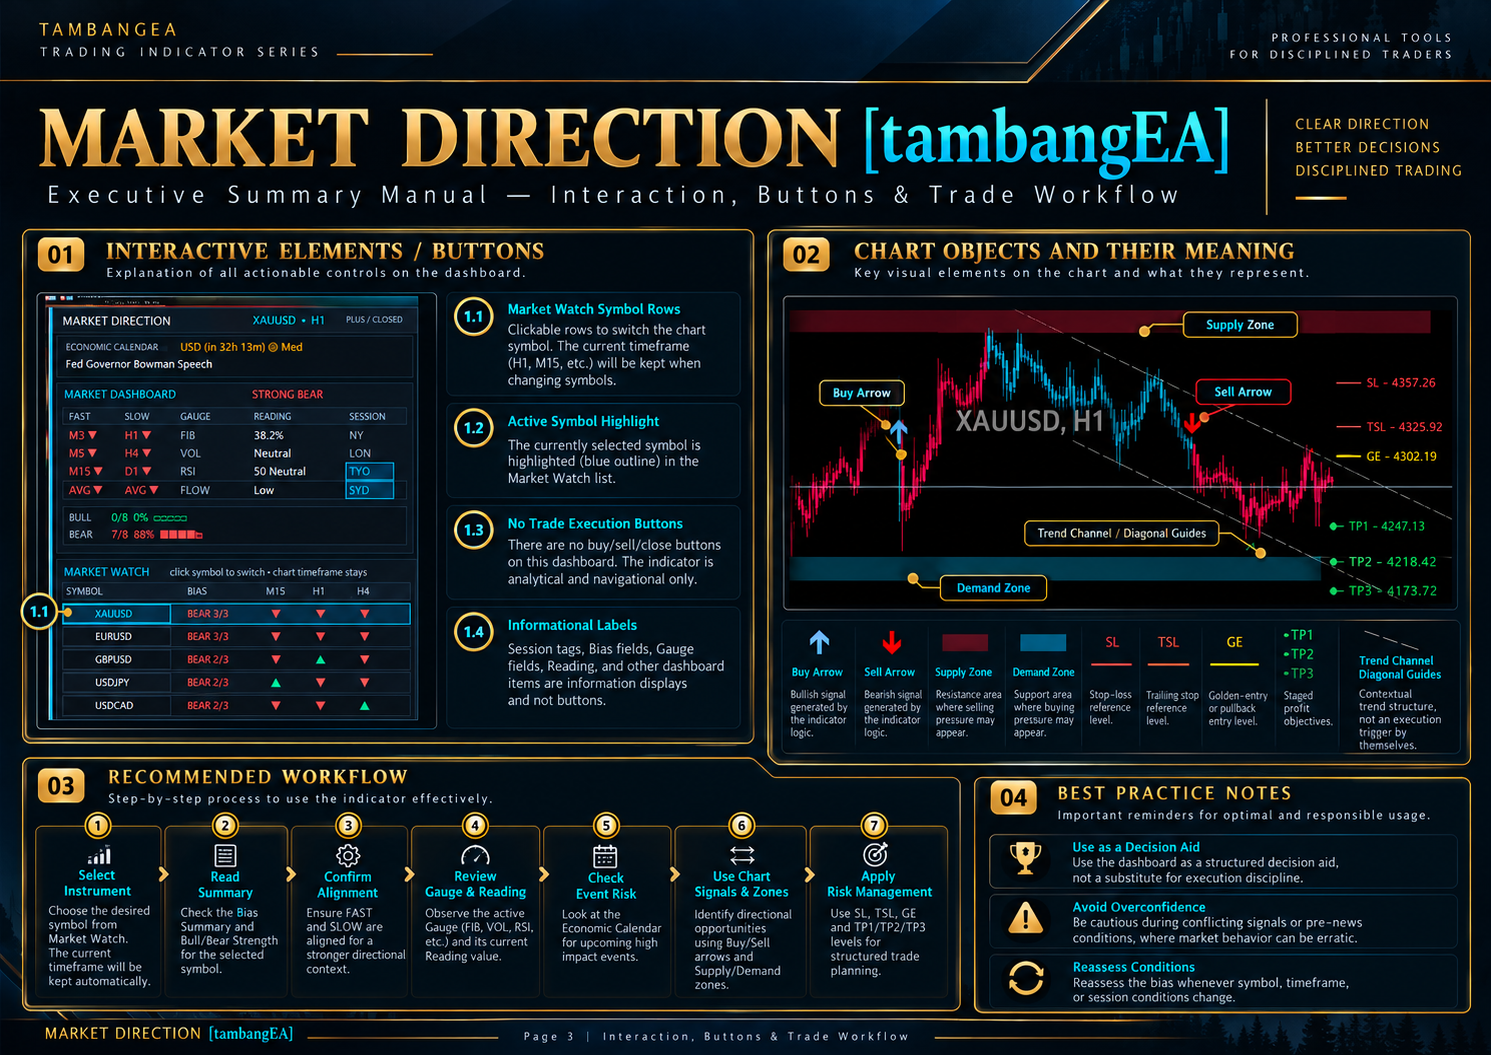
MARKET DIRECTION [tambangEA] is a multi-layer market analysis indicator designed to combine trend direction, momentum, multi-timeframe confirmation, Supply & Demand zones, market structure, risk-management levels, trading sessions, economic news context, and multi-symbol monitoring in one integrated dashboard.
The indicator is built as a structured decision-support environment. Instead of relying on a single signal, MARKET DIRECTION presents several layers of information so traders can evaluate market direction, confirmation, context, and risk from one chart.
It can be used on Forex, Gold, indices, metals, and other instruments supported by MetaTrader.
Main Features
Market Direction Engine
The core directional engine combines:
- Heikin-Ashi based price processing
- ATR volatility normalization
- Dual Supertrend logic
- Fast and slow directional analysis
- Optional breakout filtering
- Closed-bar or live signal mode
Three operating modes are available:
MARKET DIRECTION BASE
A more responsive directional mode based on the faster trend engine.
MARKET DIRECTION PLUS
Uses a slower trend configuration for a more conservative directional assessment.
MARKET DIRECTION FILTER
Combines the trend regime with breakout confirmation to reduce unnecessary signals during sideways conditions.
Buy and Sell Signals
The indicator displays clear directional arrows directly on the chart.
Blue / Cyan Buy Arrow
Indicates a bullish Market Direction signal.
Red Sell Arrow
Indicates a bearish Market Direction signal.
Optional confirmation signals can also be used to identify momentum candles that agree with the prevailing direction.
For more conservative analysis, the indicator can operate using closed-bar confirmation, helping reduce intrabar signal changes.
Multi-Timeframe Dashboard
The integrated dashboard provides a quick overview of directional conditions across several timeframes.
The dashboard includes:
- FAST trend group
- SLOW trend group
- Average directional condition
- Fibonacci reading
- Volatility condition
- RSI condition
- Market flow / volume condition
- Active trading sessions
- Bullish strength
- Bearish strength
- Overall directional judgment
Typical dashboard conditions may include:
- STRONG BULL
- MODERATE BULL
- SLIGHT BULL
- NEUTRAL
- SLIGHT BEAR
- MODERATE BEAR
- STRONG BEAR
The dashboard is designed to provide context rather than act as a standalone entry trigger.
Bull / Bear Strength Meter
MARKET DIRECTION calculates the relative alignment of several directional components.
The panel displays:
- Bullish vote count
- Bearish vote count
- Bullish percentage
- Bearish percentage
- Visual strength blocks
This makes it easier to see whether multiple analytical components are aligned or conflicting.
Multi-Symbol Market Watch
The built-in Market Watch panel allows several symbols to be monitored directly from the chart.
For each symbol, the panel displays:
- Composite bullish / bearish bias
- Strength score
- Direction on three configurable timeframes
Example:
SYMBOL BIAS M15 H1 H4 XAUUSD BEAR 3/3 ▼ ▼ ▼ EURUSD BULL 2/3 ▲ ▼ ▲ GBPUSD BEAR 2/3 ▼ ▲ ▼
Click-to-Switch
The symbol rows are interactive.
Click a symbol in the Market Watch panel and the current chart switches to that instrument while preserving the current timeframe.
The indicator also attempts to recognize broker symbol prefixes and suffixes where possible.
Supply and Demand Zones
The indicator automatically identifies potential:
- Supply zones
- Demand zones
Zones are derived from confirmed swing structures and volume information.
Volume statistics can also be displayed inside the zones to provide additional market context.
Interactive Zone Hover
When using the supported candle display mode, moving the mouse over a Supply or Demand zone can temporarily reveal the corresponding Heikin-Ashi directional coloring within the zone.
This makes it easier to inspect the price behavior associated with the area without permanently changing the entire chart display.
Market Structure
Optional market structure analysis includes:
- Internal structure
- External structure
- Break of Structure — BoS
- Change of Character — CHoCH
Internal and external structures are calculated independently.
This allows traders to examine short-term structural changes while maintaining awareness of the broader market swing structure.
Fibonacci Context
MARKET DIRECTION can display directional Fibonacci retracement levels based on detected market swings.
Supported structure references include:
- Internal Fibonacci
- External Fibonacci
- Both structures
The dashboard can also show the nearest relevant Fibonacci retracement area.
Regression Trend Channel
An optional Linear Regression Channel provides additional directional context.
The channel uses statistical regression and deviation calculations to display:
- Upper trend boundary
- Lower trend boundary
- Optional regression midpoint
The channel should be treated as a contextual trend tool rather than an independent trading signal.
Risk Management Levels
When a Market Direction signal is generated, the indicator can display structured reference levels based on volatility.
Available levels include:
SL — Stop Loss
ATR-based protective reference.
TSL — Trailing Stop
Dynamic trailing reference based on the slower trend engine.
GE — Golden Entry
Potential retracement / pullback reference.
TP1 — Target 1
TP2 — Target 2
TP3 — Target 3
These levels are designed to assist trade planning and visualization.
They are analytical reference levels and do not automatically open or close trades.
Risk / Reward Visualization
Optional risk/reward boxes can visualize:
- Entry area
- Stop-loss distance
- Target areas
- Potential reward relative to risk
This helps users evaluate trade structure before making an execution decision.
Trading Session Monitor
The dashboard displays the major global trading sessions:
- New York
- London
- Tokyo
- Sydney
Active sessions are highlighted directly in the dashboard.
Session calculations include daylight-saving adjustments where applicable.
Economic Calendar
The MetaTrader 5 version integrates the native MT5 Economic Calendar.
The panel can display upcoming events together with:
- Currency
- Remaining time
- Importance level
- Event name
Available impact filters include:
- High impact
- Medium impact
- Low impact
- Holiday / other events
This feature helps traders identify periods where technical signals may be affected by major economic announcements.
Optional Macro Filter
An optional macro-direction filter can use:
- US Dollar Index / DXY
- US 10-Year Yield
- or both
The feature can be used as an additional directional context layer, particularly for instruments such as Gold.
Because broker symbol names differ, configurable symbol names are provided.
Previous Day and Week Levels
Optional higher-period reference levels include:
- Previous Day High
- Previous Day Low
- Previous Week High
- Previous Week Low
- Daily dividers
- Weekly dividers
These levels can help identify important historical liquidity and reaction areas.
Next Candle Expansion Statistics
An optional statistical panel measures the historical frequency of:
- Higher-high expansion
- Lower-low expansion
This information is intended as statistical context only and should not be interpreted as a guaranteed prediction of the next candle.
Higher-Timeframe Overlay
Optional HTF visualization can display higher-timeframe candles directly on the active chart.
An accompanying volume distribution view can also be enabled for additional price-area context.
Suggested Analysis Workflow
A practical workflow with MARKET DIRECTION is:
- Check the overall Bias Summary.
- Compare FAST and SLOW trend directions.
- Review Bull / Bear Strength.
- Check RSI, volatility, Fibonacci and flow readings.
- Identify the active trading session.
- Review upcoming economic events.
- Observe Supply / Demand and market structure.
- Wait for a Buy or Sell signal with suitable confirmation.
- Use GE, SL, TSL and TP1–TP3 to structure the trade plan.
- Reassess the analysis whenever symbol, timeframe or market conditions change.