UT Bot Scanner
- Indicators
-
Evgenii Sutulov
 Premium components
1. https://www.mql5.com/en/market/product/201632 - Rotation Manager Console - Version: 1.3
- Updated: 2 September 2026
- Activations: 20
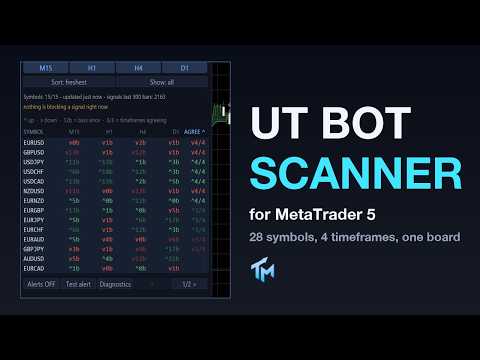
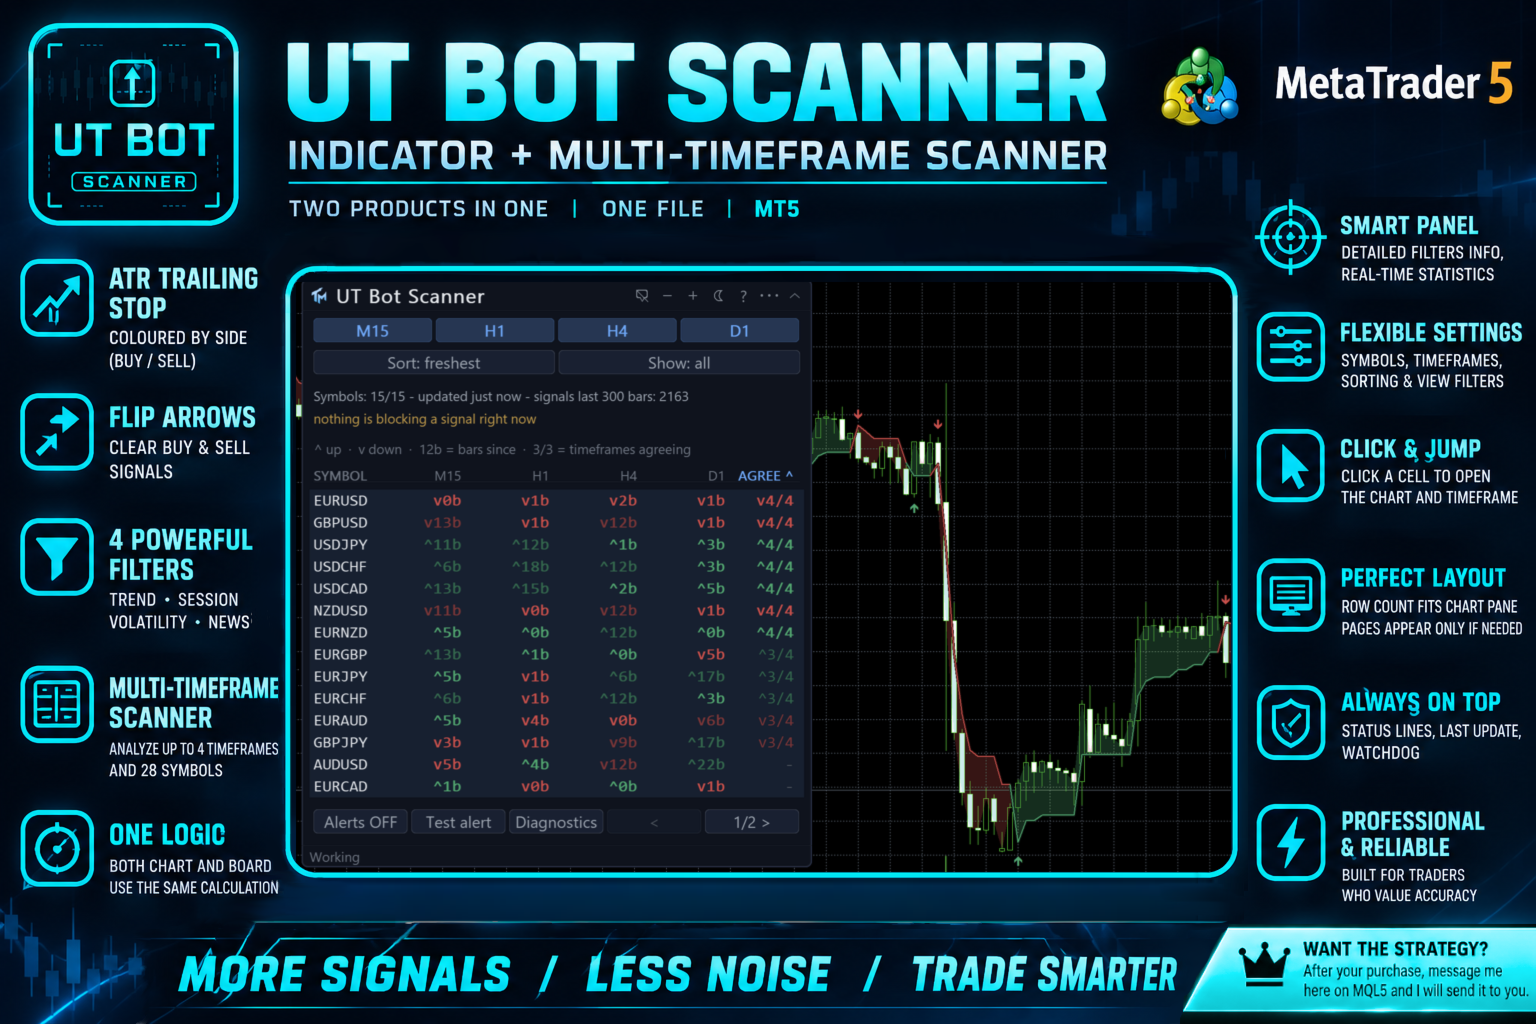
UT Bot Scanner is two products in one file. The first is UT Bot MTF itself, drawn on the chart in front of you: the ATR trailing stop coloured by the side it is on, and the flip arrows, with the same four optional filters the single-chart product carries.
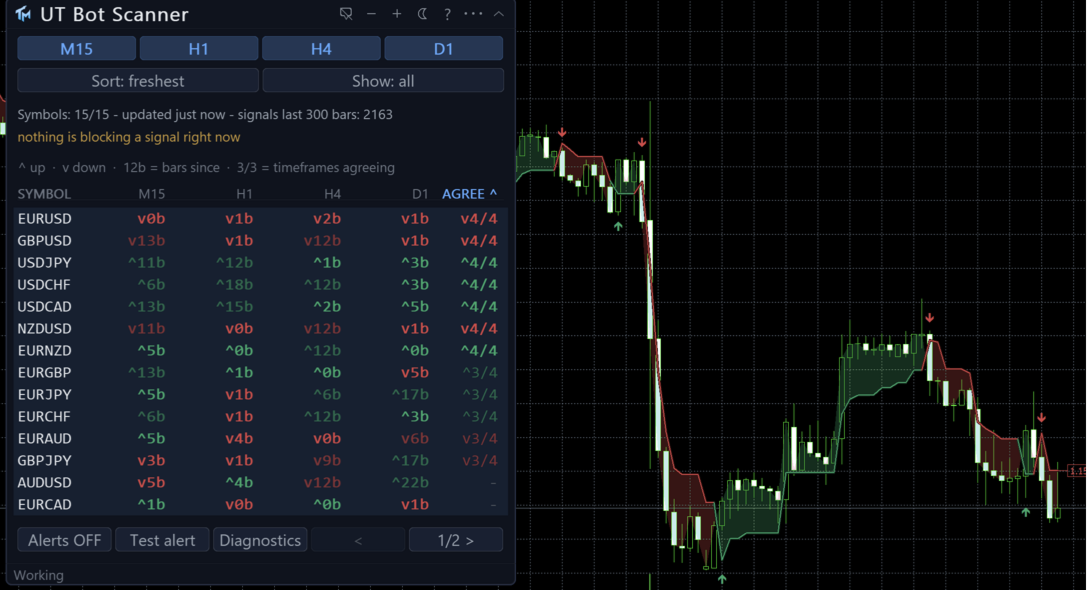
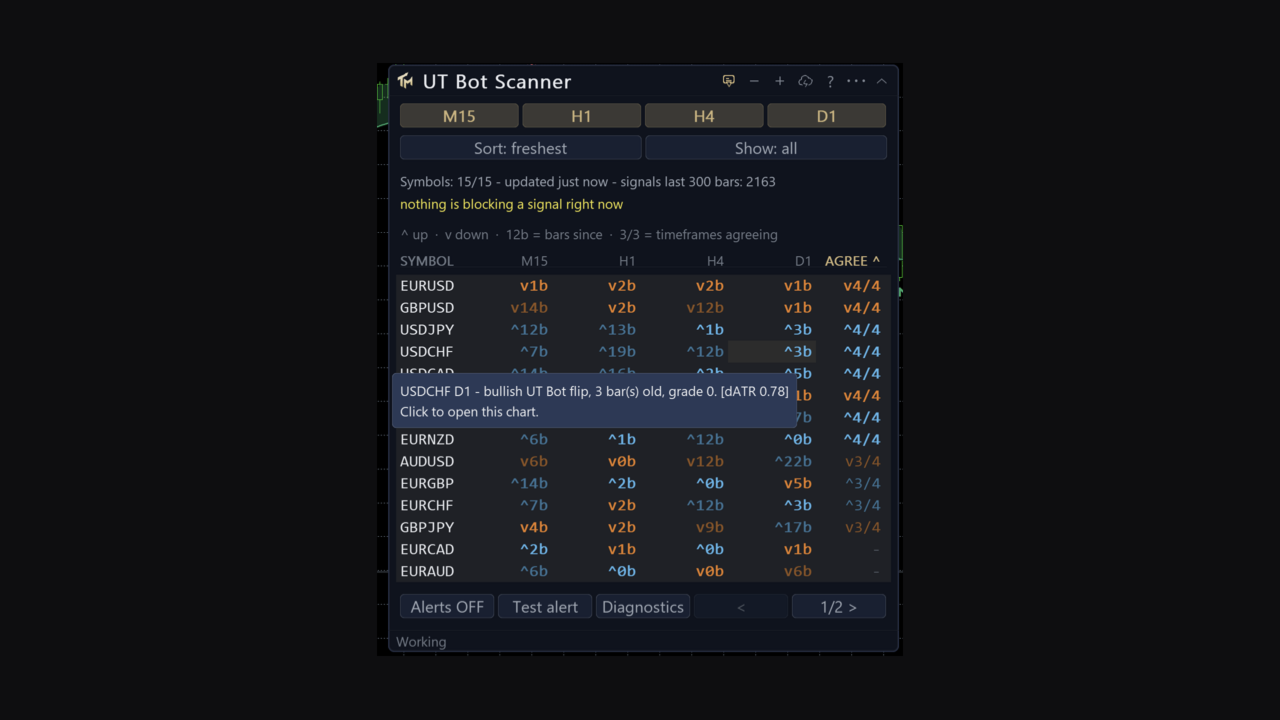
The second is a board that runs the same calculation across a list of symbols on several timeframes at once. The board says which instruments have flipped and how recently; the chart under it shows you the trailing stop, so you do not have to attach a second indicator to act on what the table found.
Both halves run the same filters, so the board and the chart can never disagree about what counts as a signal.
The filters
Every filter ships switched off. Each one is a separate hypothesis about the market and each can be turned on alone. The trend filter keeps only the signals that agree with a moving average on a higher timeframe, and the timeframe, the period and the method are all yours to choose. A signal older than the filter's own data is left alone rather than judged, and the panel counts those.
The session filter keeps only the signals inside a window given as HH:MM in GMT, with the broker's GMT offset given by hand or detected from the server clock. The volatility filter drops signals taken while ATR is under a floor in points; a floor of zero never rejects anything, and the panel says so rather than pretending the filter is working. The news filter drops signals within a chosen number of minutes before and after an economic calendar event of at least a chosen importance, read from the terminal's own calendar. If the calendar is unavailable, the panel names the error.
The panel prints, permanently, which filters are on and with what settings, and one line saying how many signals were kept of how many raw ones, broken down by which filter rejected the rest. A filter that is switched on but cannot do its job says so in its own line.
The board
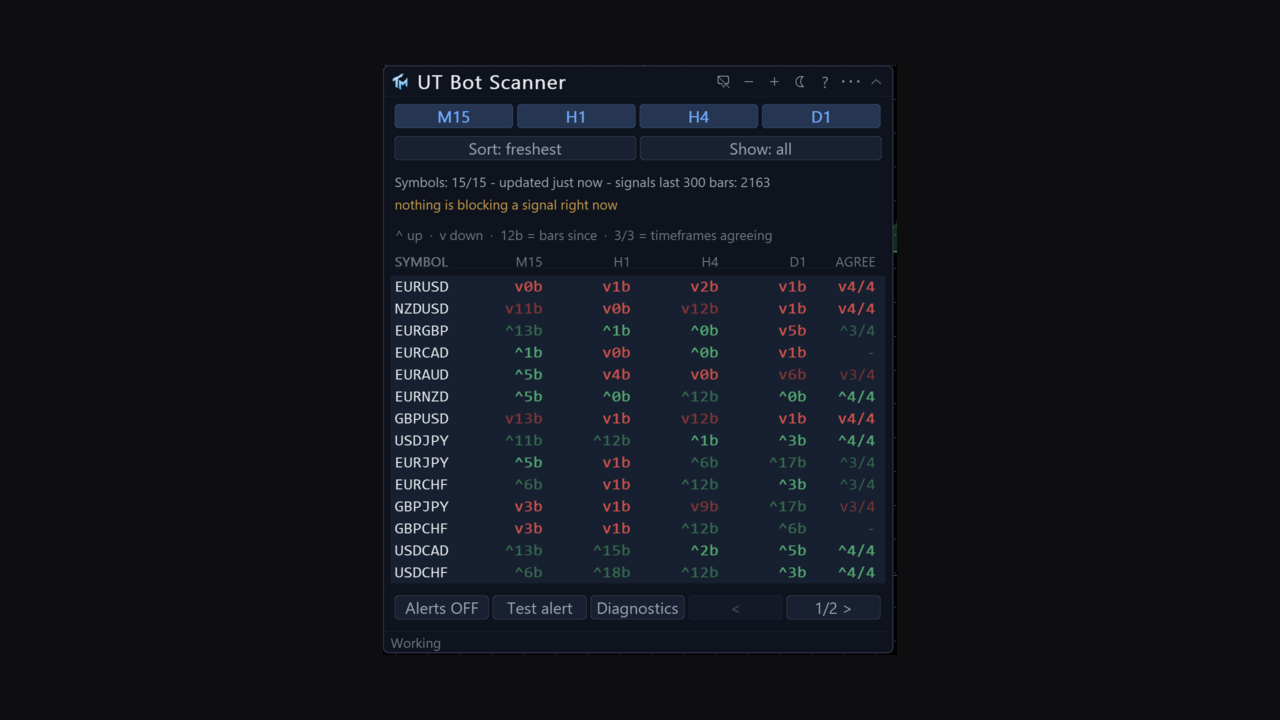
A row per symbol, a column per scanned timeframe, up to four columns and up to twenty-eight symbols. The symbol list is comma separated, or the board can take the Market Watch list instead. Broker prefix and suffix are detected from the chart you are on, or given by hand. Out of the box the board scans four timeframes: M15, H1, H4 and D1.
A cell reads like ^14b: which side the trailing stop is on, and how many bars ago it flipped there. The word flat means the calculation ran and found no flip in the window. Three dots mean the cell has not been measured, and hovering it says why in words, along with the ATR distance. A flip older than the freshness threshold keeps its hue and loses its weight. A row with a fresh flip anywhere in it gets a wash of the accent colour.
The AGREE column takes the visible timeframe columns for that symbol, finds the majority side and prints something like v3/4: the direction, and how many of the visible timeframes stand on it. Full agreement is drawn bold in that side's colour, because that is the row the board exists to surface. A tie prints a dash and is deliberately not a verdict. With one timeframe visible the column is dropped entirely rather than printing a 1/1 that only restates its neighbour.
Column headers are buttons. Click a timeframe header to sort by that column, freshest first, rows with nothing at the bottom; click again to reverse. Click AGREE to sort by agreement, full agreement first, with a full house outranking a partial one of the same count. The active header carries the accent colour and a caret. A separate Sort button cycles freshest, grade and name.
A Show button cycles all, buys, sells and fresh. Buys and sells follow the AGREE verdict and not any single cell, so a row shown under buys always reads an up glyph in AGREE, and a tie shows under neither. This is a filter on the view and not on the calculation: a hidden row is still measured and can still alert.
The legend above the table decodes the notation and can be switched off. Timeframe buttons show and hide a column without stopping the measurement behind it. Clicking a cell switches this chart to that symbol and that timeframe rather than opening a window per click.
The visible row count is fitted to the chart pane and the row setting is a maximum. Page buttons appear only when the rows do not fit; when they do fit, no dead controls are drawn. Because the board never draws more rows than the pane holds, the page buttons are always on screen and always reachable, however tall the row setting is.
Two status lines are always on show: symbols ready of total, time since the last update, signals in the lookback window; then either the watchdog line or a sentence explaining why nothing is showing.
Diagnostics
A second panel, off by default, answers the question "why is there no signal": symbol coverage, which series are short of bars and by how much, how many signals were found in the window, and how many symbols this indicator switched on in Market Watch. A cell that could not be measured is explained rather than left blank.
The chart indicator
Drawn in the price window: the trailing stop coloured by its side, and BUY and SELL arrows. It can be switched off from the Styles tab if you only want the board. Its timeframe is set separately from the timeframes the board scans, and separately again from the trend filter's timeframe, which is a filter rather than a display setting.
The settings sheet
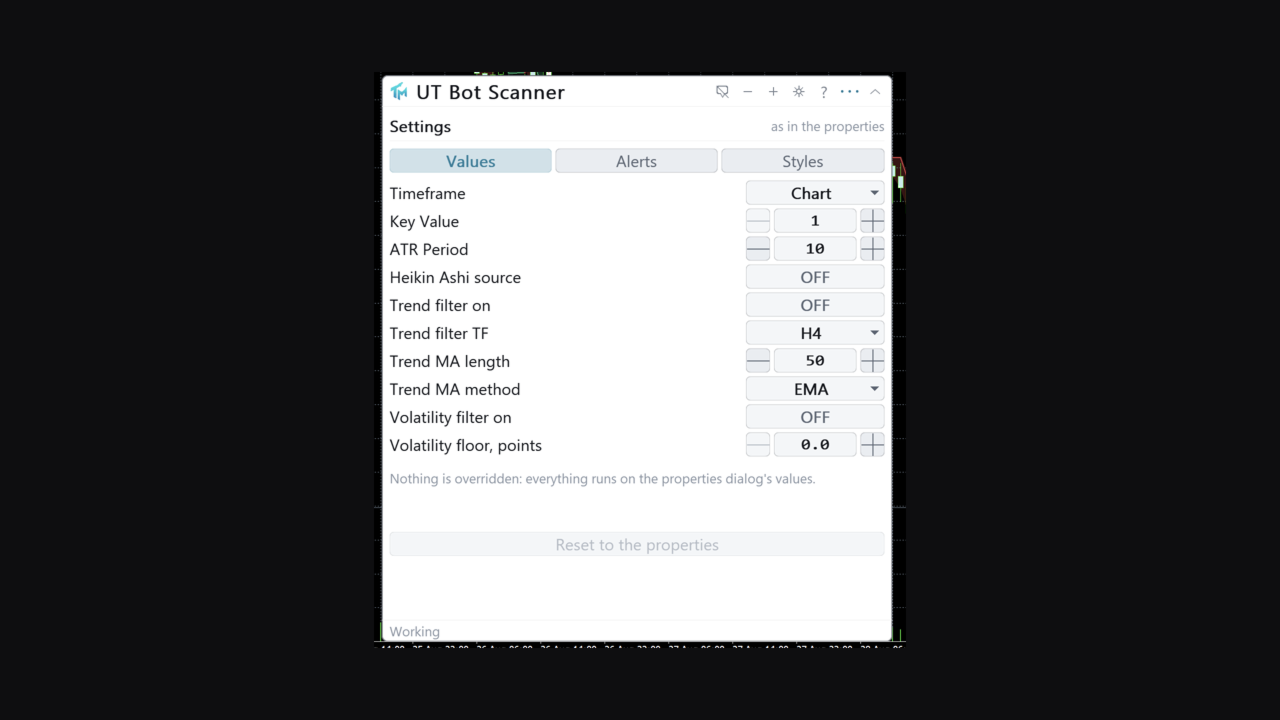
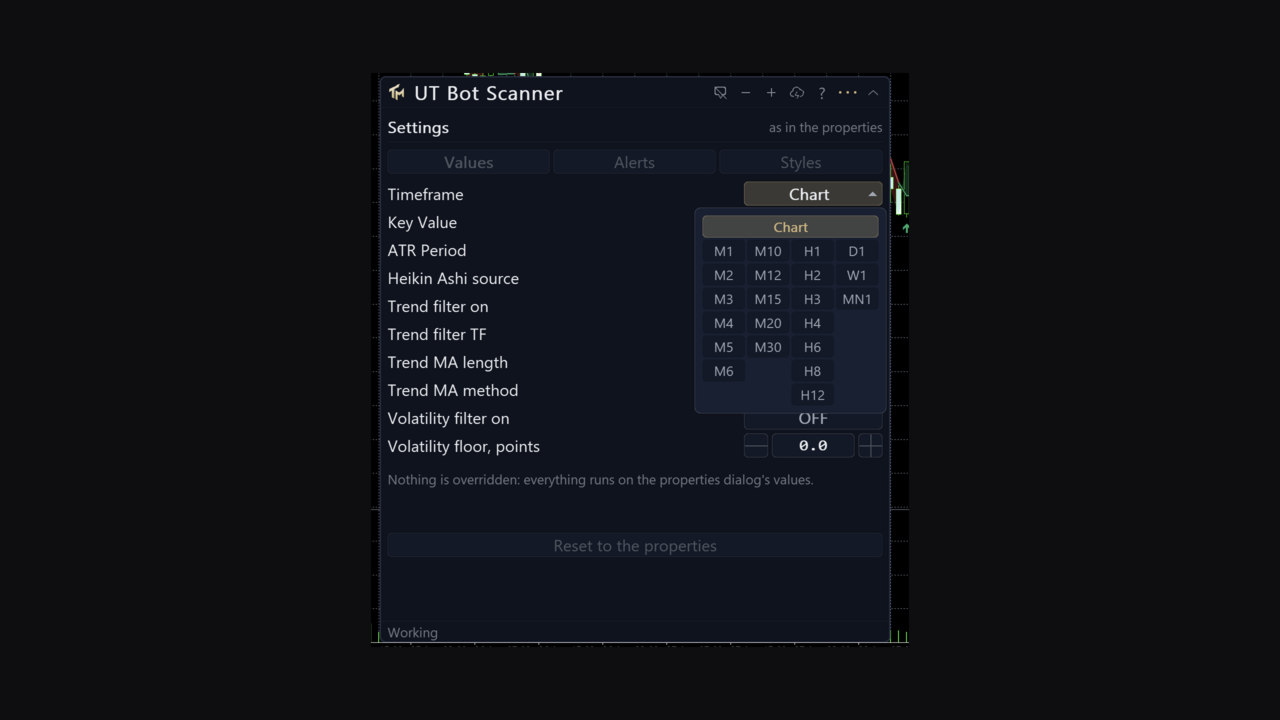
The gear opens three tabs. Values covers the timeframe, key value, ATR period, Heikin Ashi source, the trend filter with its timeframe, MA length and MA method, and the volatility filter with its ATR floor. Every row has steppers, a range and a sentence of help. Changing one recalculates the whole board, and the panel reports progress while it does.
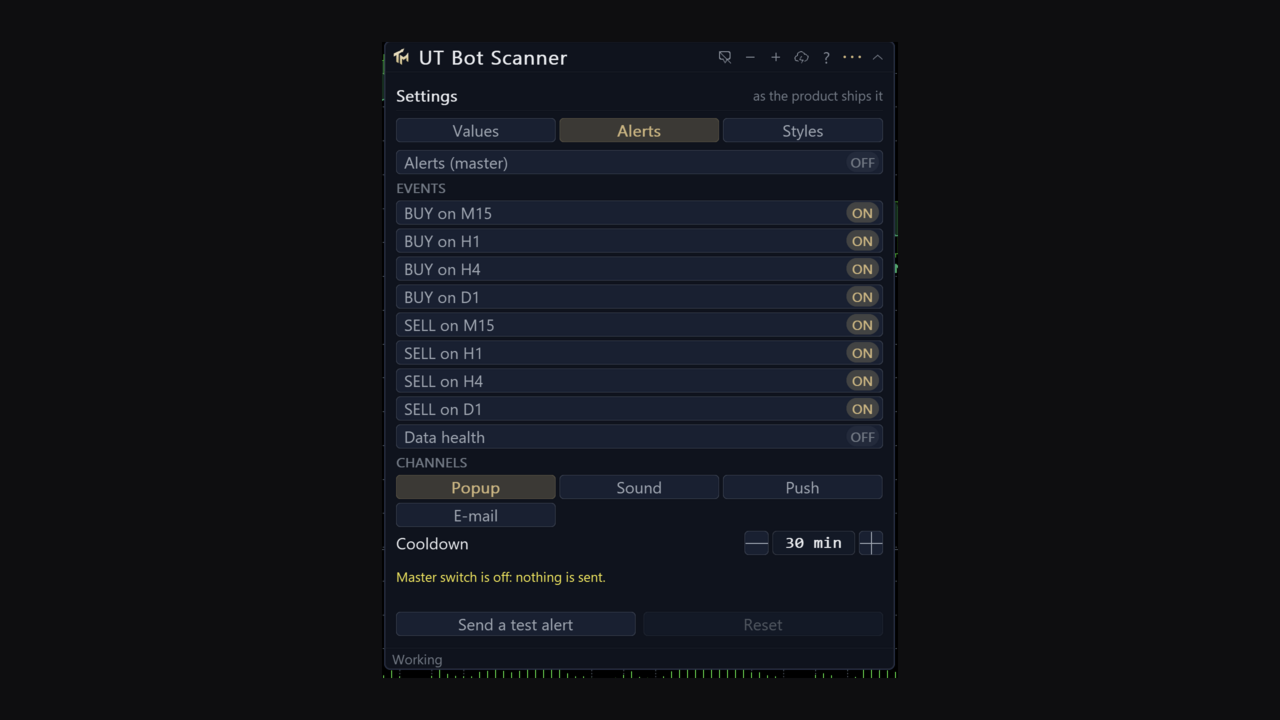
Alerts covers the master switch, the per-event switches, the four channels, the cooldown and a test button.
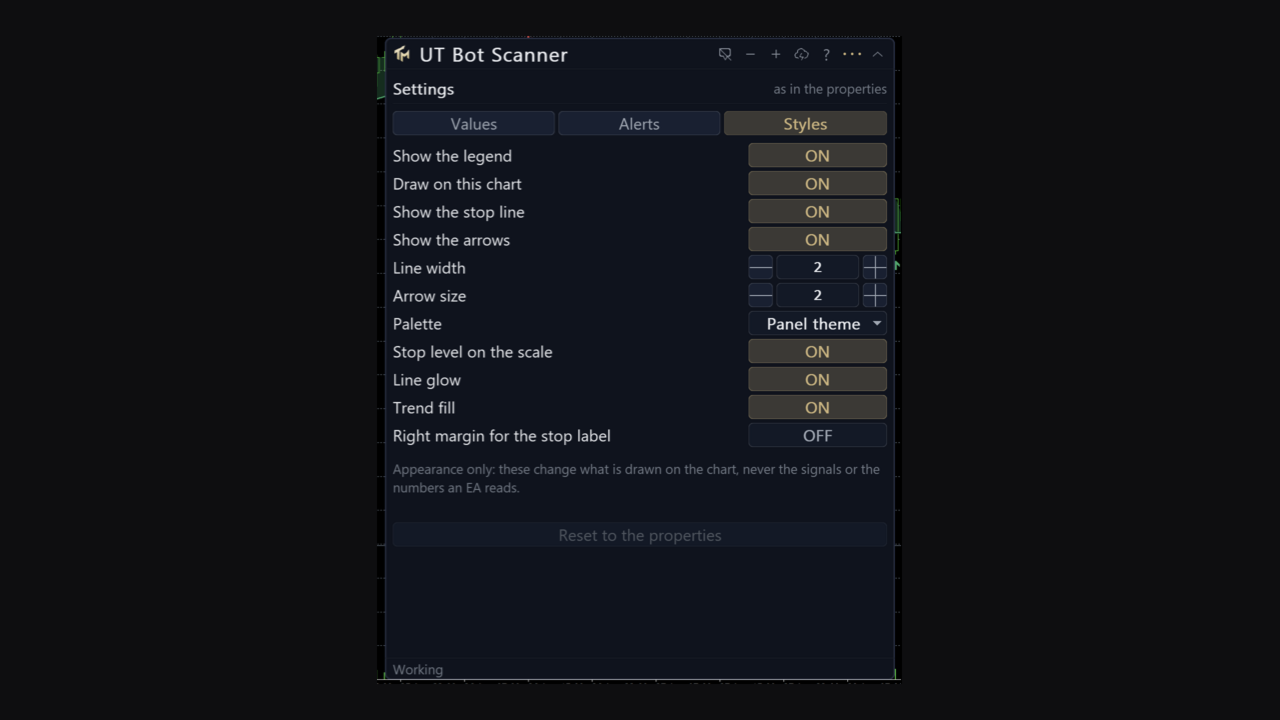
Styles covers the legend, whether the indicator is drawn on this chart, the palette, the stop line, the arrows, line width, arrow size, the trend fill, the line glow, the stop level on the price scale, and a right margin for the stop label. These are the same display controls the matching single-chart indicator carries, under the same names, so a chart set up one way can be reproduced on the other.
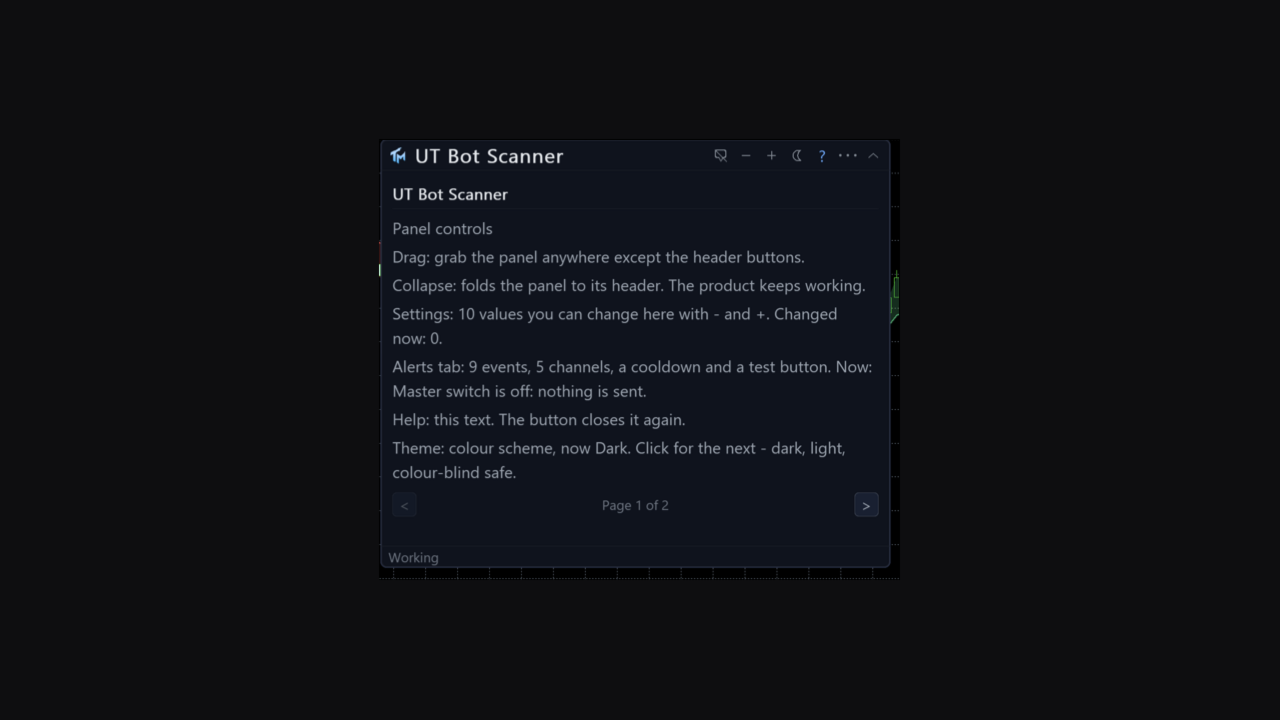
Three colour schemes, including a colour-blind safe one that uses blue and orange rather than red and green. Panel position, scheme, the sort, the filter, the visible columns and every value changed on the sheet persist per chart across a timeframe change and a terminal restart. The interface is English.
Alerts
Off out of the box, with a master switch on the panel and a Test alert button beside it that fires through every channel currently on.
The events are a fresh BUY and a fresh SELL, declared separately for each scanned timeframe, plus data health, which speaks when a symbol loses or regains its data. There is a minimum grade setting; this port does not grade, so every signal counts as grade one for it.
The channels are a popup window, a sound, a push to the mobile terminal and e-mail. The cooldown is kept per cell and per event, thirty minutes by default, because a board watching many symbols has many more chances to repeat itself than one chart does. Telegram is not part of this product.
Cost
The work is budgeted: a set number of symbols is refreshed per timer tick, so a long list spreads its load rather than stalling the terminal. The first pass is progressive and the panel reports the percentage measured.
Reading it from an EA
The chart indicator publishes twelve buffers, all readable through iCustom and CopyBuffer. Buffer 0, Buy, carries the arrow price on a BUY flip bar and EMPTY_VALUE otherwise, and is not drawn; buffer 1, Sell, is the same for a SELL flip. Buffers 2 and 3 are the two edges of the trend fill. Buffer 4, Glow, is the wider and dimmer copy under the stop line, and buffer 5 is its colour index. Buffer 6, Stop, is the trailing stop level, and buffer 7 is its colour index. Buffer 8, BuyMark, and buffer 9, SellMark, are the drawn copies of buffers 0 and 1. Buffer 10, Signal, is +1 on a BUY flip, -1 on a SELL flip and 0 when there is no flip. Buffer 11, Atr, is the ATR behind the stop.
The filters are already applied to what these buffers report, so an EA sees what a person sees.
Buffers 0 and 1 are the EA contract. They are never painted, and they are filled on every pass whatever the Styles tab is set to, so nothing on the display side can starve a strategy of a signal. What you see on the chart is the drawn copy, kept in step with the contract. Hiding is done by changing how a plot is drawn, never by emptying a buffer, so every index listed above stays readable through iCustom and CopyBuffer and stays visible in the Data Window with the display switches off.
This map is the scanner's own and it is not the same as the single-chart UT Bot MTF, which carries the fill, the glow and the stop in different slots and publishes fifteen buffers. Read the list above.
The board itself is a panel and not a buffer. It is read by eye and by alert.
Provenance
This is a port of "UT Bot Alerts" from TradingView, an idea by HPotter with the alert variant published by QuantNomad and Yo_adriiiiaan. The script is openly published, which makes a port by formula admissible, and this implementation was reconstructed from the formulas as a working specification rather than translated line by line.
The product carries the method's name because that is what it implements. The original work belongs to its authors and no authorship of it is claimed here.
Honest limits
The board reads closed bars and counts a cell's age in closed bars. The chart indicator does not: it computes the forming bar too, so an arrow and a stop flip on the unfinished bar can appear and then disappear before that bar closes. Once a bar has closed, its arrow and its stop level do not change afterwards.
The trailing stop is a trailing stop. In a range it gets taken out repeatedly, and on a board that means several pairs will light up during the same quiet hour, each flip real and each of them a poor trade. The filters exist because of this, and none of them removes the problem.
The news filter depends on the terminal's economic calendar. If it is unavailable on your account or at your broker, the filter is idle and the panel names the error rather than silently passing everything. A session window given in anything other than HH:MM leaves the session filter idle, and the panel says so rather than dropping signals invisibly. The trend filter cannot judge signals older than the higher-timeframe data it holds; those are left alone and counted.
AGREE counts timeframes, it does not estimate probability. Four correlated readings of one instrument agreeing is not four independent confirmations. A tie deliberately produces no verdict and is hidden by both the buys filter and the sells filter.
Scanning costs. Twenty-eight symbols on four timeframes is a hundred and twelve cells, and the trend filter adds a higher-timeframe series per symbol on top of that. The budget setting is what you turn down.
No profit figure, win rate or backtest result is claimed here.