Price Context Map
- Indicators
- Version: 1.0

See Price in Context
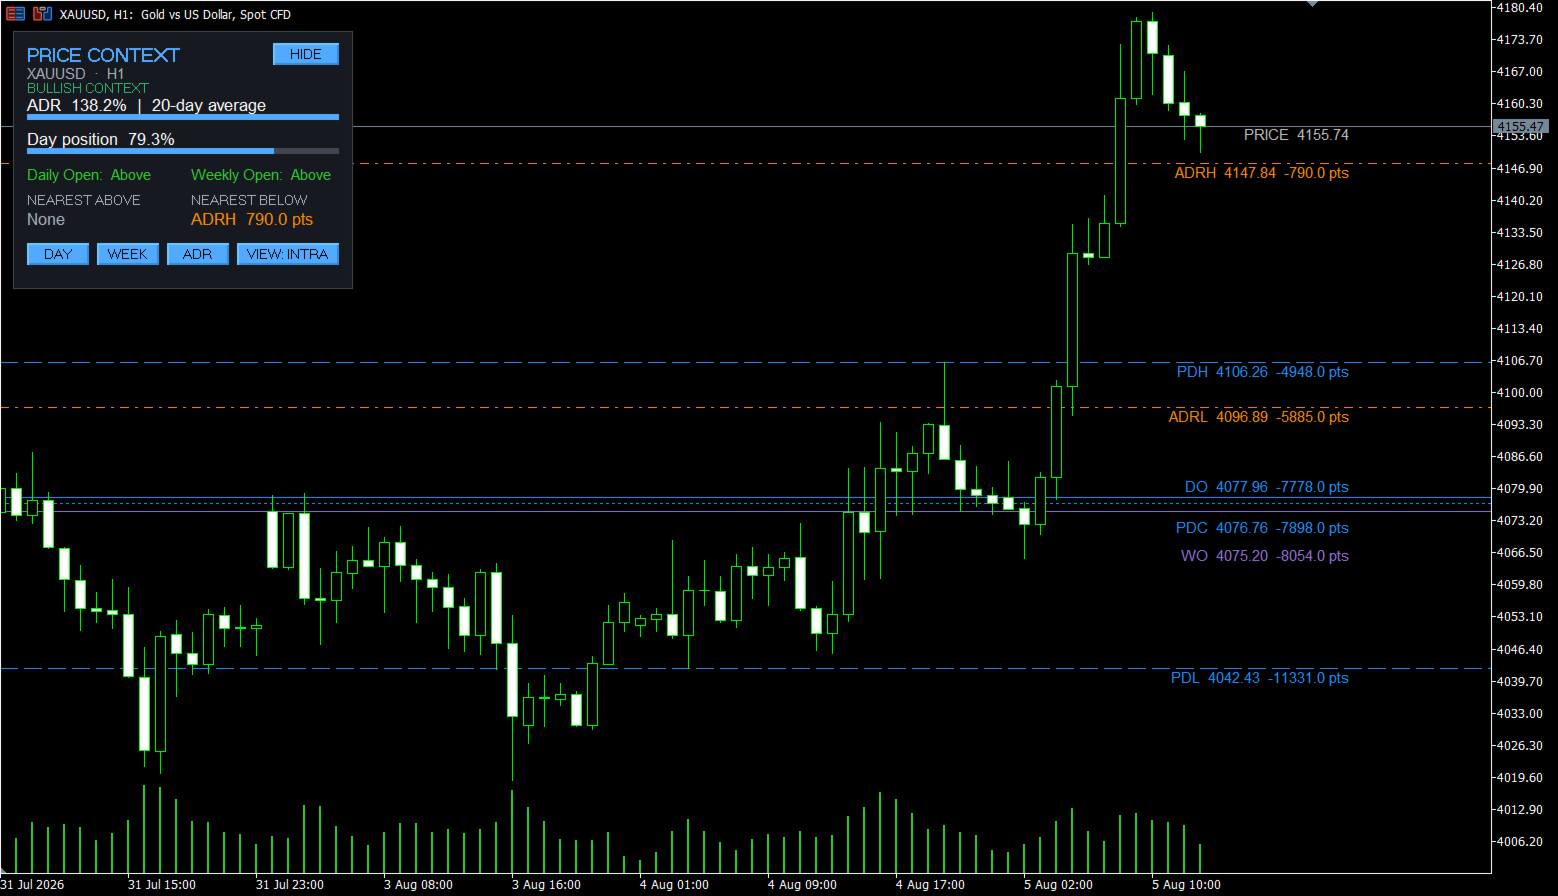
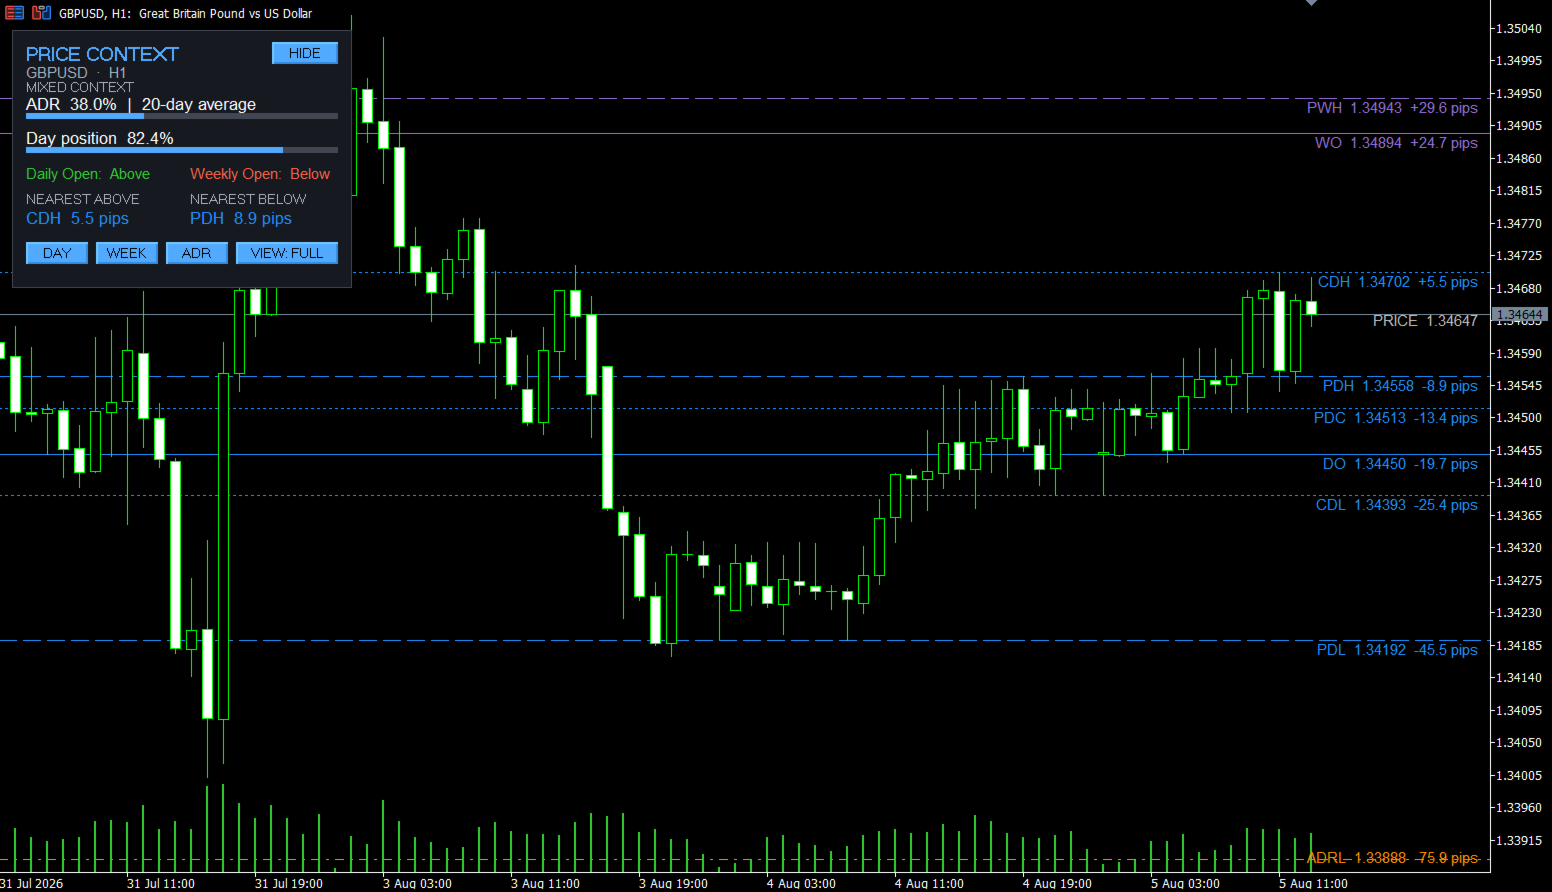
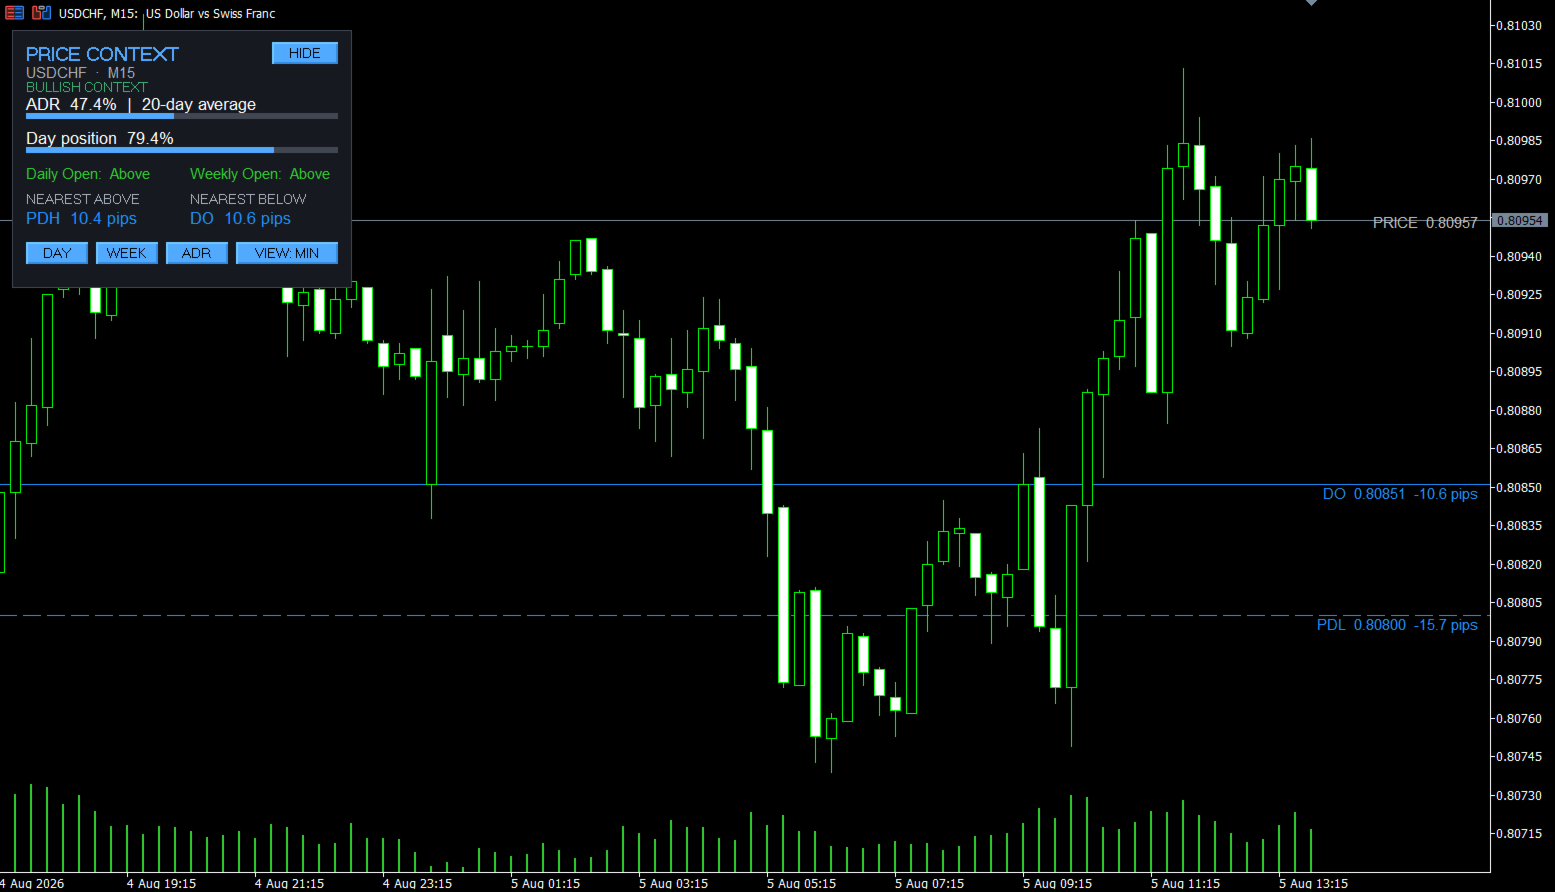
Price Context Map is a free MetaTrader 5 indicator for Daily, Weekly, and ADR (Average Daily Range) levels. It keeps the reference prices most relevant to the current session visible on one clean chart.
Instead of manually marking opens, previous-session extremes, and range boundaries each day, you get a structured map of where price is now, what it is approaching, and how much of its typical daily range has already been used.
Built for clarity, not clutter. The indicator is designed for traders who want essential context without filling the chart with unnecessary tools. Levels are color-coded by category, labels are placed in a dedicated area on the right side of the chart, and nearby labels are automatically spaced to remain readable.
Designed for discretionary intraday and price-action traders who want daily, weekly, and ADR context without chart clutter.
Key levels at a glance
- Daily Open
- Previous Day High, Low, and Close
- Current Day High and Low
- Weekly Open
- Previous Week High and Low
- ADR High and ADR Low
Each visible level can display its short name, exact price, and signed distance from the current price. Distance can be shown automatically in pips for Forex symbols and points for other instruments, or selected manually.
Understand the current session
The compact dashboard summarizes the information that matters most while you trade:
- ADR used: how much of the selected average daily range has been covered today
- Day position: where current price sits inside today's high-low range
- Daily Open and Weekly Open status: whether price is above or below each opening price
- Nearest Above and Nearest Below: the closest visible reference levels around current price
The dashboard context is descriptive: Bullish Context means price is above both the current Daily Open and Weekly Open, Bearish Context means it is below both, and Mixed Context means price is on different sides of the two opens. It is not a trading signal.
Flexible views, fast control
Choose the amount of information you want to see:
- Minimal: the essential Daily Open, previous-day range, Weekly Open, and ADR levels
- Intraday: the default view, adding the Previous Day Close for more session context
- Full: all available daily, weekly, and ADR levels
- Custom: your own combination of levels
Use the dashboard buttons to show or hide daily, weekly, and ADR groups instantly. The panel can also be collapsed and restored at any time.
ADR calculation. ADR is calculated from the high-low range of completed daily candles. The default period is 20 days and can be adjusted in the Inputs dialog. ADR High and ADR Low are projected from the current day's low and high, respectively, so the levels adapt as the daily range develops.
Designed for everyday chart work.
- Works on any chart timeframe
- Uses D1 and W1 data from the current symbol
- Supports Dark and Light themes
- Supports multiple independent instances on the same chart
- No external DLLs or additional dependencies
How to use it
- Attach Price Context Map to any chart.
- Start with the default Intraday view.
- Use the map and dashboard to orient price relative to session, weekly, and ADR references.
- Switch to Minimal, Full, or Custom when your workflow requires a different level of detail.
Important note
Price Context Map is an informational charting tool. It does not place trades, provide entry or exit signals, or guarantee any trading result. Daily and weekly levels are based on the broker's D1 and W1 candles, so values can differ between brokers with different server times.
For a detailed explanation of Daily, Weekly, and ADR price context, read the Price Context Map user guide.
If Price Context Map improves your chart workflow, reviews and constructive feedback are appreciated.