How to Read Daily, Weekly, and ADR Price Context in MetaTrader 5

See Price in Context
A chart can show every tick of price movement and still leave one important question unanswered: where is price relative to the references that matter today?
Price Context Map is a free MetaTrader 5 indicator that brings Daily, Weekly, and ADR (Average Daily Range) references together in a clear, organized view. It is built for chart reading: it does not open trades or provide entry signals.
Why context matters
Price is easier to interpret when it is viewed against the current Daily Open, the Weekly Open, previous-session extremes, and the recent average daily range. These references are often useful, but drawing and updating them manually takes time and can make the chart harder to read.
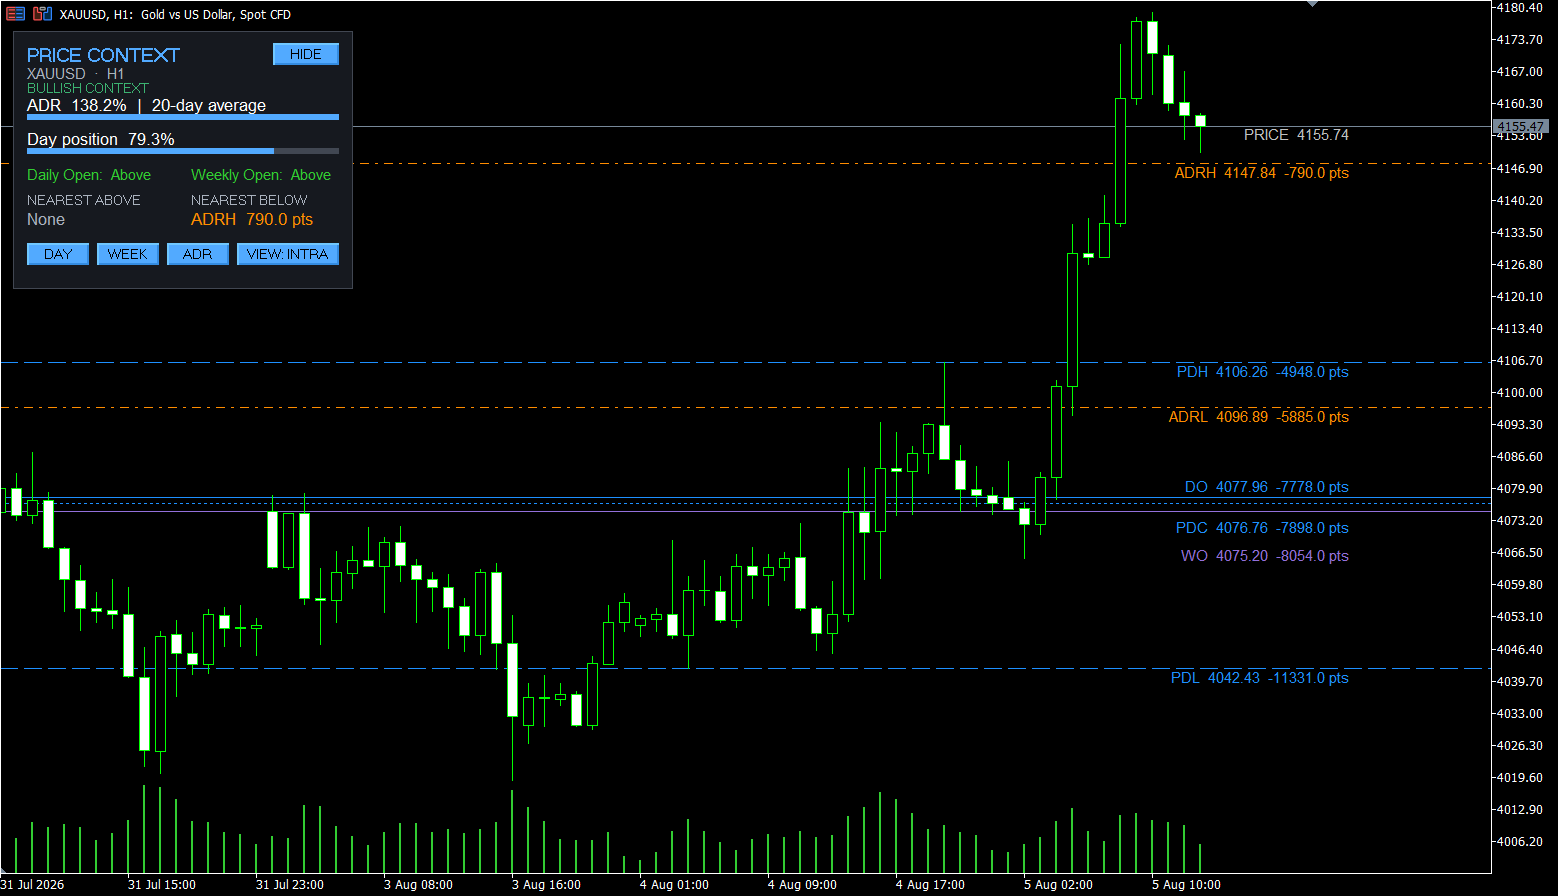
Price Context Map keeps them visible automatically. The map on the right shows the level name, exact price, and signed distance from current price. Positive distance means the level is above price; negative distance means it is below. Labels are designed to remain readable even when important levels are close together.
Three layers of price context
Daily context covers the current broker day and the previous completed daily session: Daily Open, Previous Day High, Previous Day Low, Previous Day Close, and optional current-day extremes.
Weekly context adds Weekly Open, Previous Week High, and Previous Week Low to an intraday chart without requiring a timeframe change.
Volatility context comes from ADR. By default, ADR is the average high-low range of the last 20 completed D1 candles. ADR High is projected from the current day's low, while ADR Low is projected from the current day's high. Together they provide a practical reference for comparing today's developing range with the recent daily average.
ADR Used and Daily Position
ADR Used compares the current day high-low range with the selected ADR. Below 100%, the current day's range is smaller than the selected average. At 100%, it matches the average. Above 100%, it has exceeded it.
Daily Position measures where current price sits between the current day low and high. A value near 0% is near the daily low; a value near 100% is near the daily high.
Dashboard and views
The dashboard provides a compact session summary: ADR Used, Daily Position, Daily Open and Weekly Open status, plus the nearest visible level above and below price.
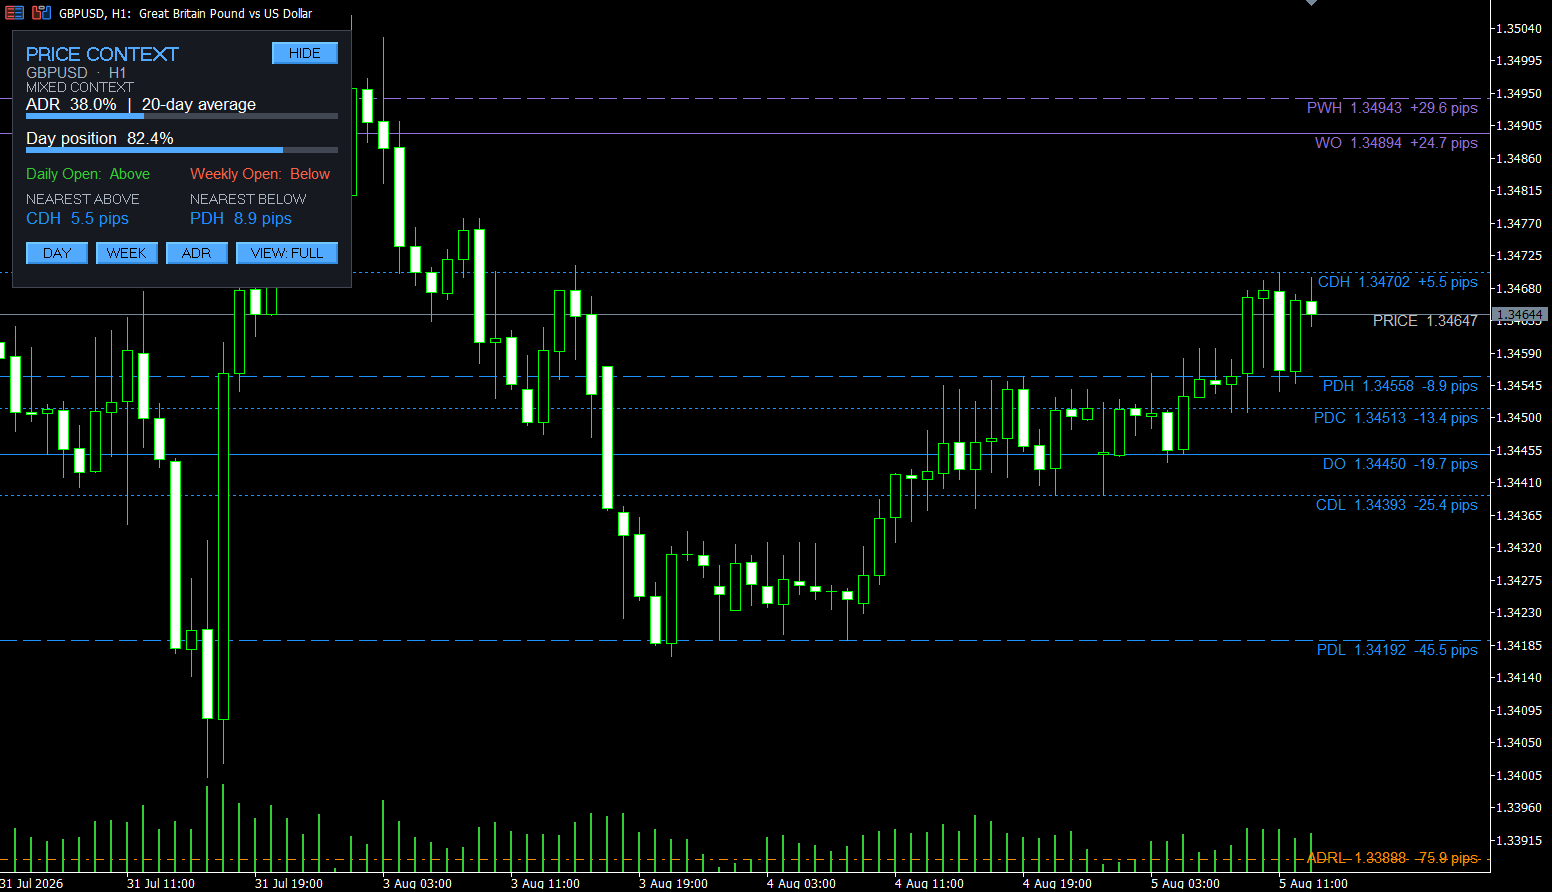
Bullish Context means price is above both the current Daily Open and Weekly Open. Bearish Context means it is below both. Mixed Context means price is on different sides of the two opens. These labels describe price location only.
Use Minimal, Intraday, Full, or Custom view according to the amount of detail you need. The dashboard buttons let you switch views, show or hide the Daily, Weekly, and ADR groups, and hide or restore the panel directly from the chart.
Three quick examples
- If PDH is the nearest level above price, it is immediately visible as the nearest daily reference above the market.
- If price is above both opens, the dashboard summarizes that alignment without replacing your own market-structure analysis.
- If ADR Used is above 100%, the current day range is larger than the selected recent average.
Essential customization
The Inputs dialog lets you control which levels and details appear on the chart: ADR period, view preset, price and distance display, distance unit, Dark or Light theme, and the level selection used by the Custom preset.
The indicator refreshes current-day extremes, ADR projections, labels, and dashboard values while the chart is running. Daily and weekly references use the D1 and W1 candles supplied by the current broker, so values can differ between brokers with different server times.
A clearer starting point for chart analysis
Price Context Map does not try to interpret the market for you. It keeps the main session, weekly, and volatility references organized, so you can spend less time managing chart objects and more time applying your own analysis.
Availability
Price Context Map is available free of charge for MetaTrader 5. You can download it from the MQL5 Market and use it on any chart or timeframe.