Quantitative Divergence Pro MT4

Title: Quantitative Divergence Pro: Auto-Optimizing Divergence Engine

Headline: Stop relying on static parameters. Exploit the market with a self-optimizing, multi-oscillator divergence engine built on walk-forward statistical analysis.

Description: The market is dynamic; your indicators shouldn't be static. Quantitative Divergence Pro (v5.7) bypasses rigid, default settings by running continuous background optimizations directly on your chart. It rapidly tests thousands of Oscillator Period and OB/OS combinations to find the exact parameters that yield the highest Profit Factor for current price action. Because ultimately, statistics is the only thing that works.

Core Features:

  • Self-Optimizing Engine: A proprietary, pre-cached handle system instantly sweeps parameters (for RSI or MFI) to lock in the highest statistical edge without freezing your terminal.

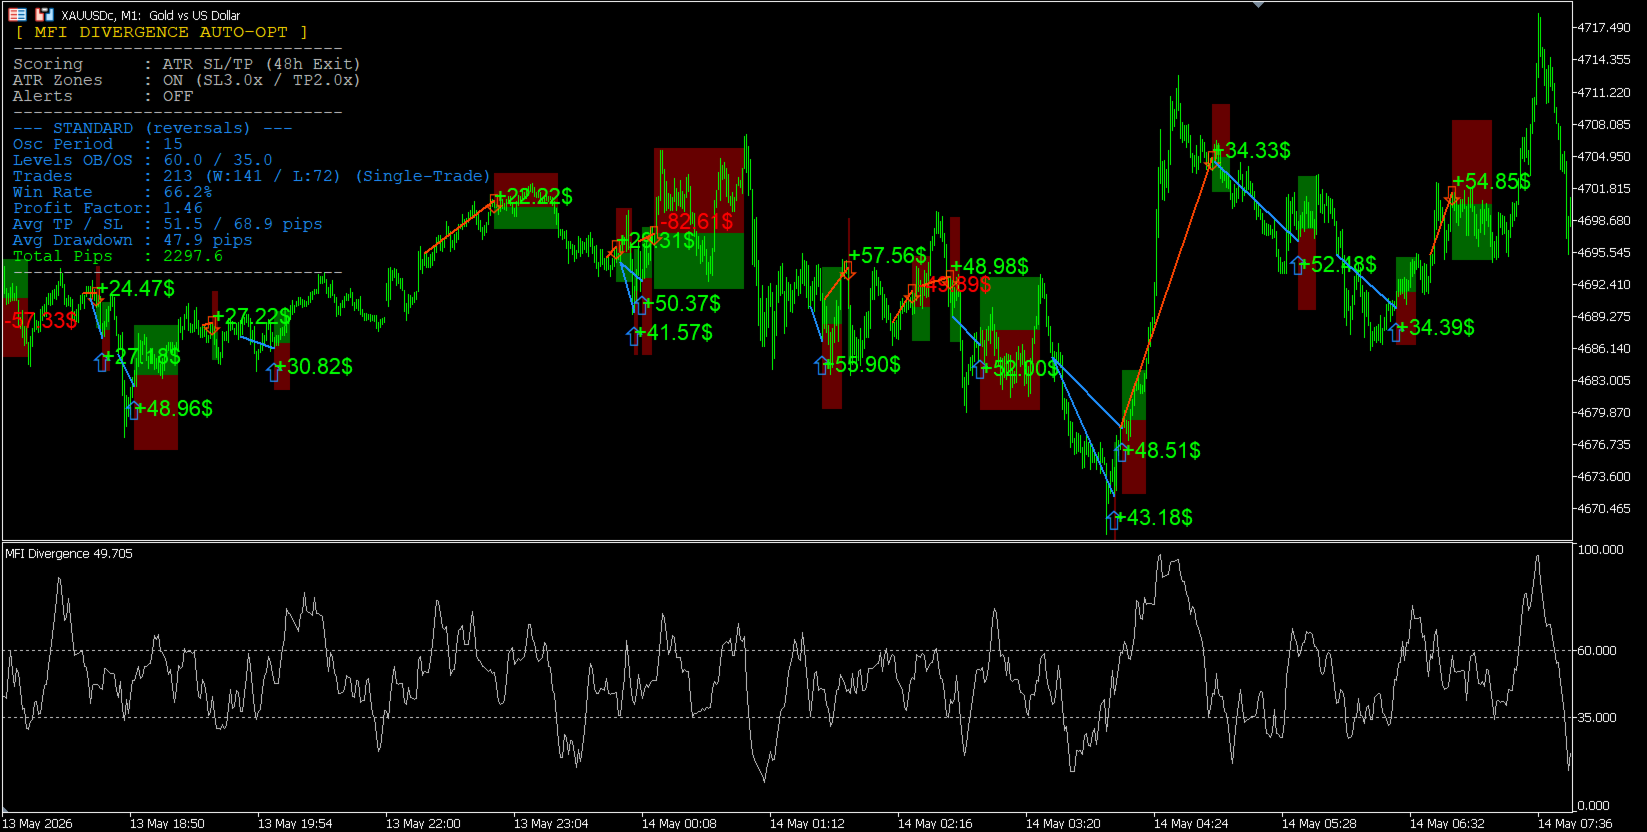
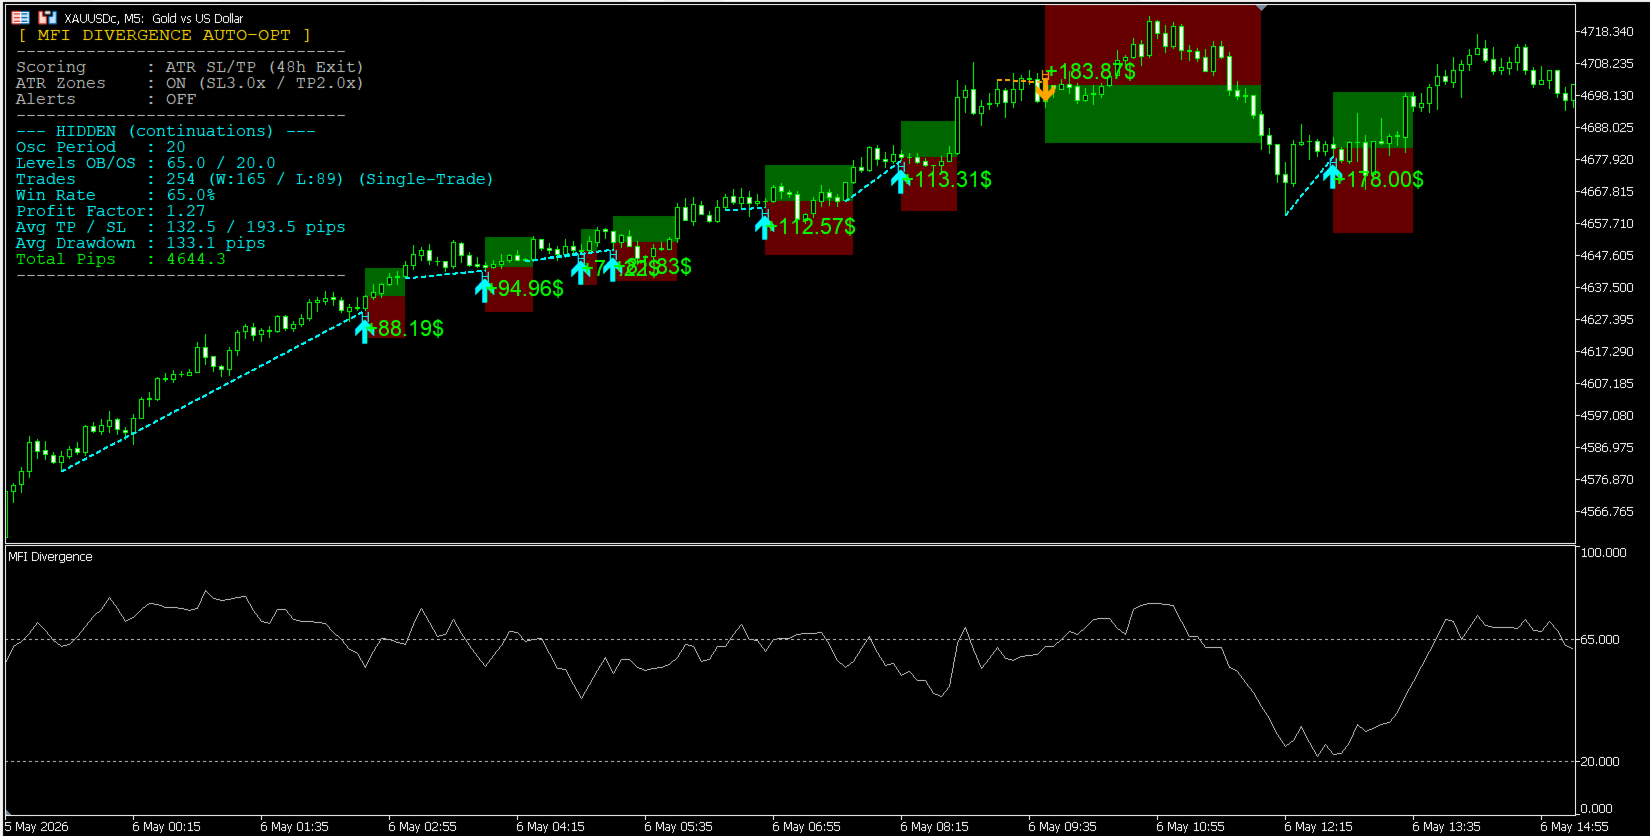
  • Dual-Track Independence: Standard divergences (reversals) and Hidden divergences (continuations) are optimized and tracked completely independently to prevent curve-fitting.

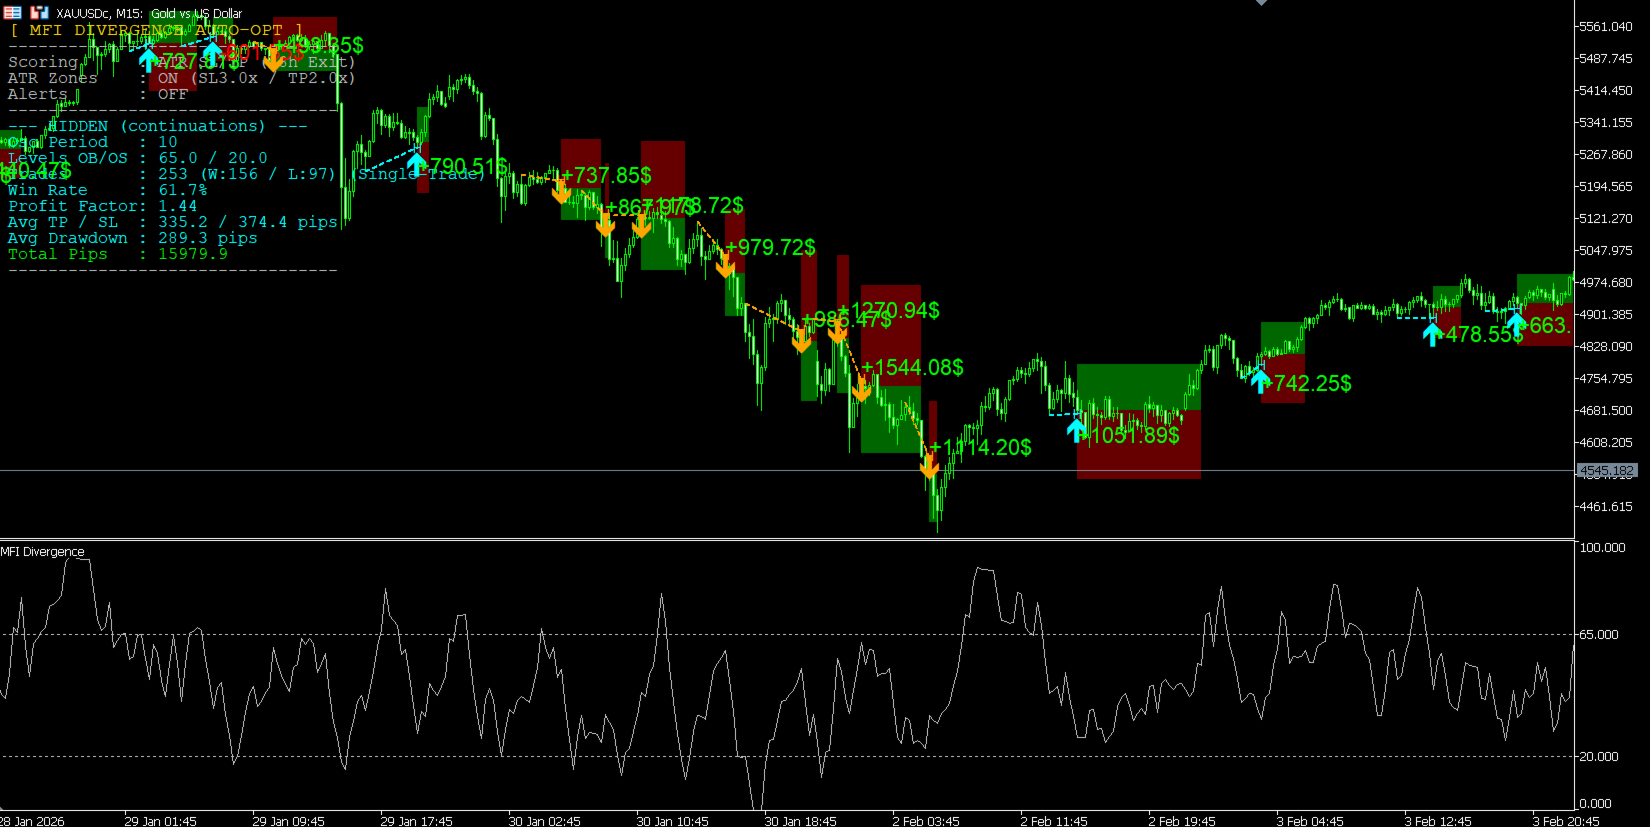
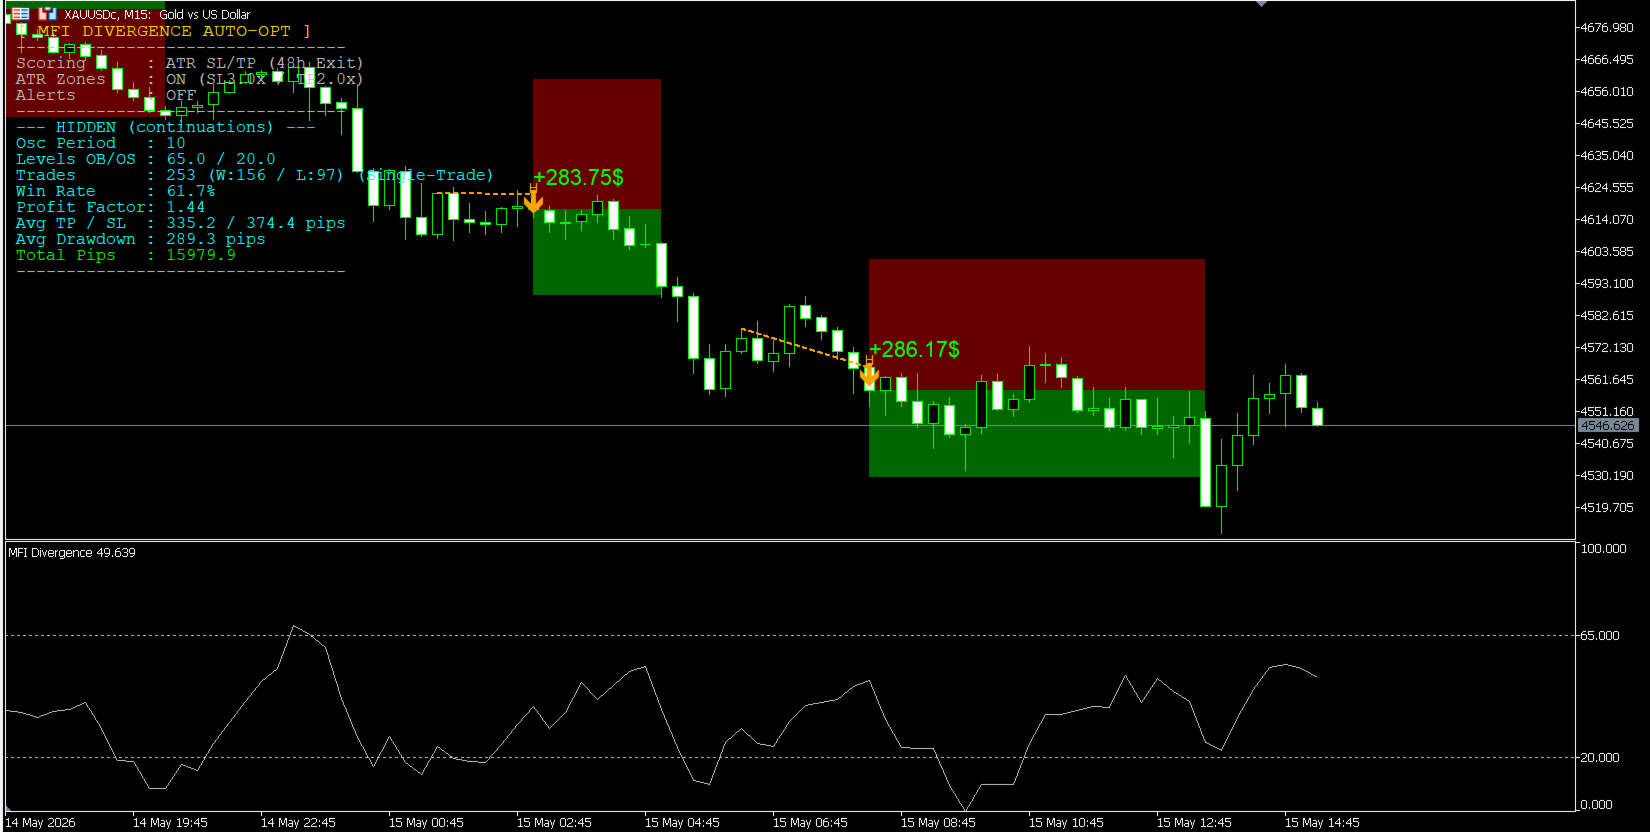
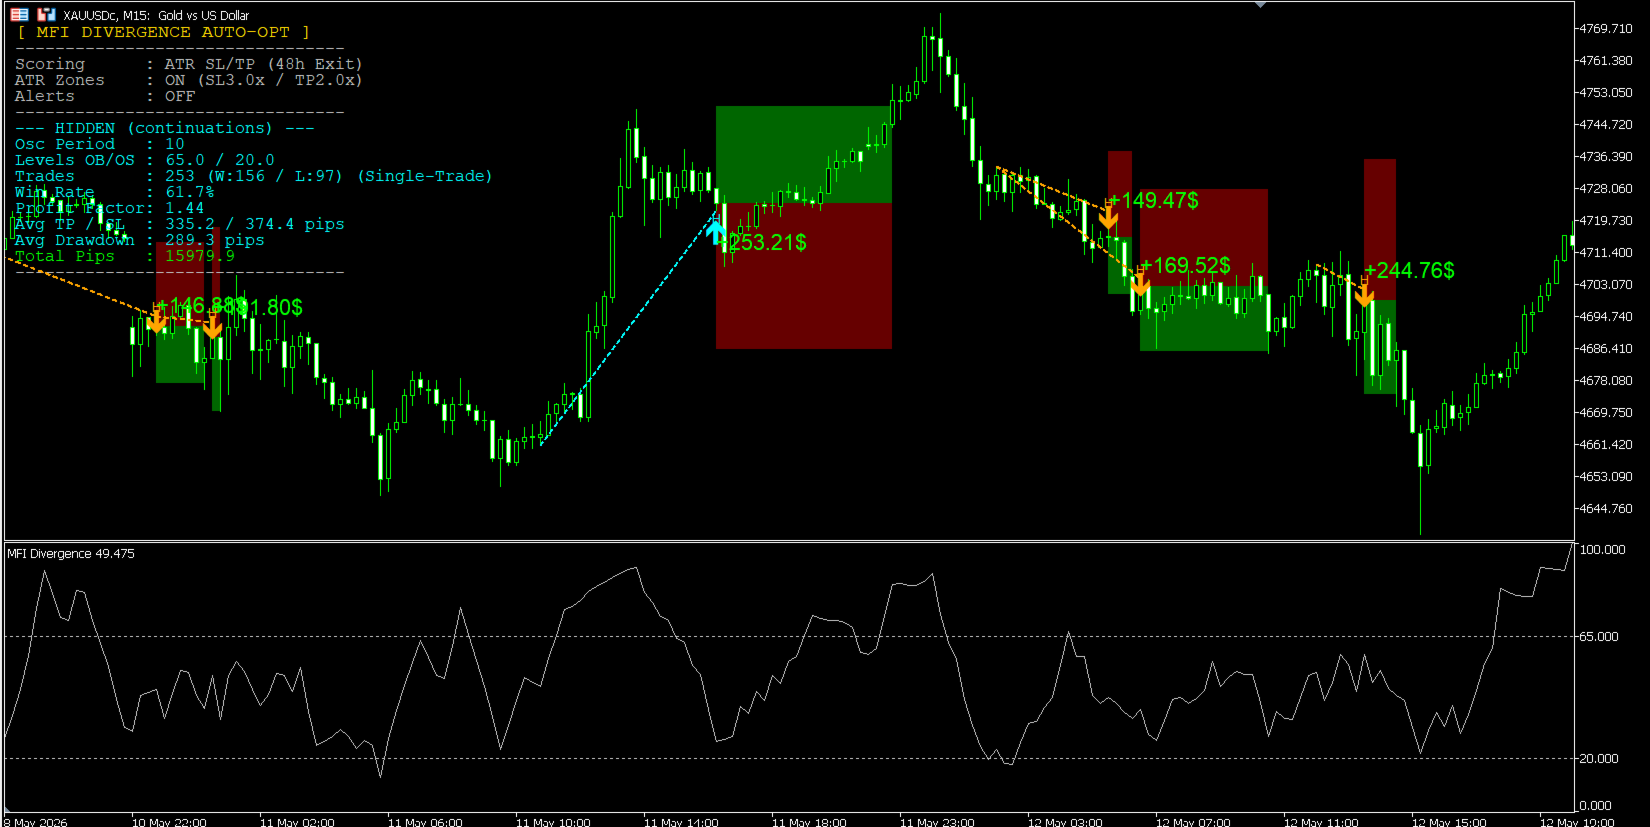
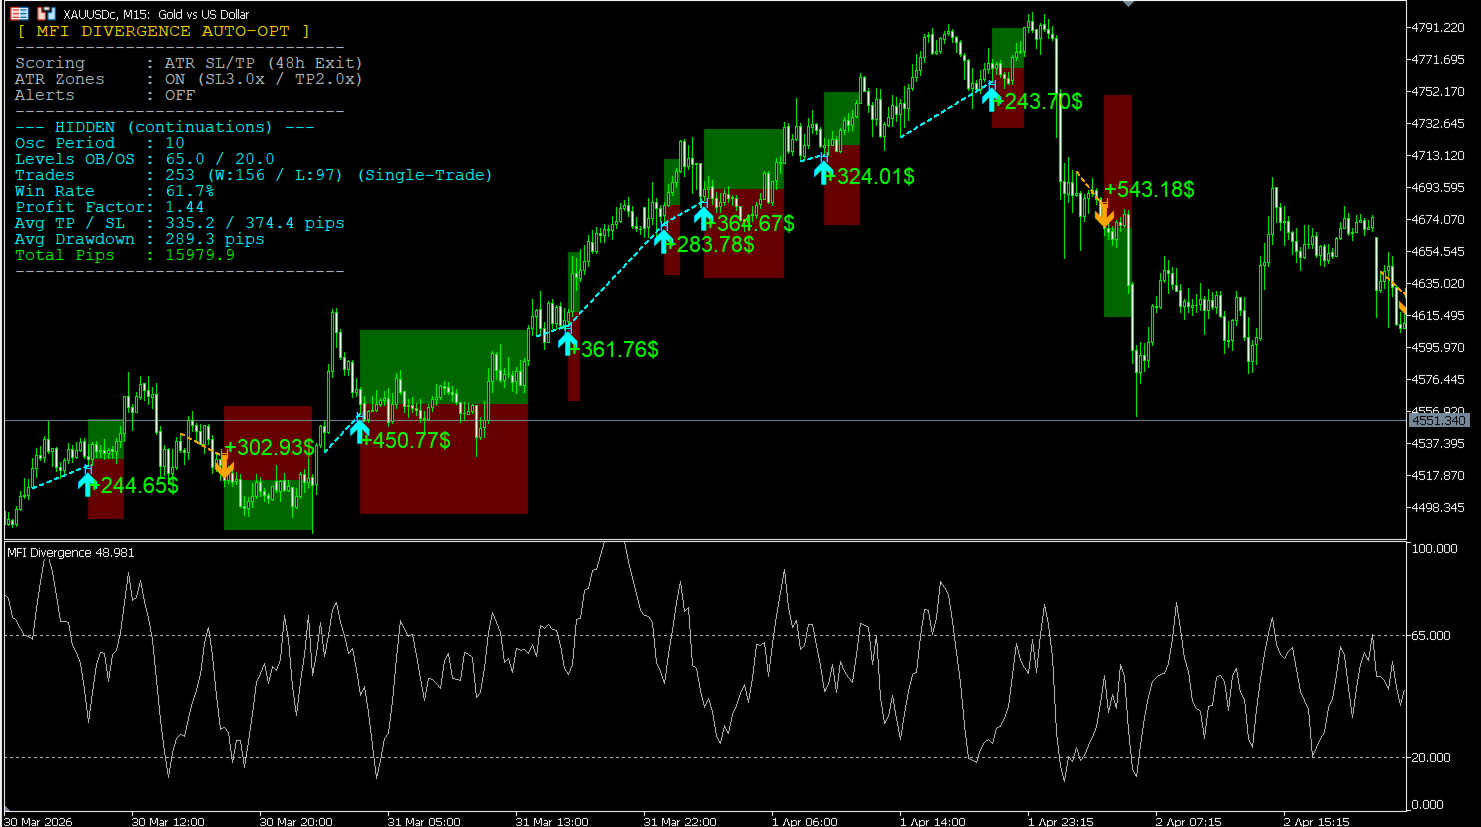
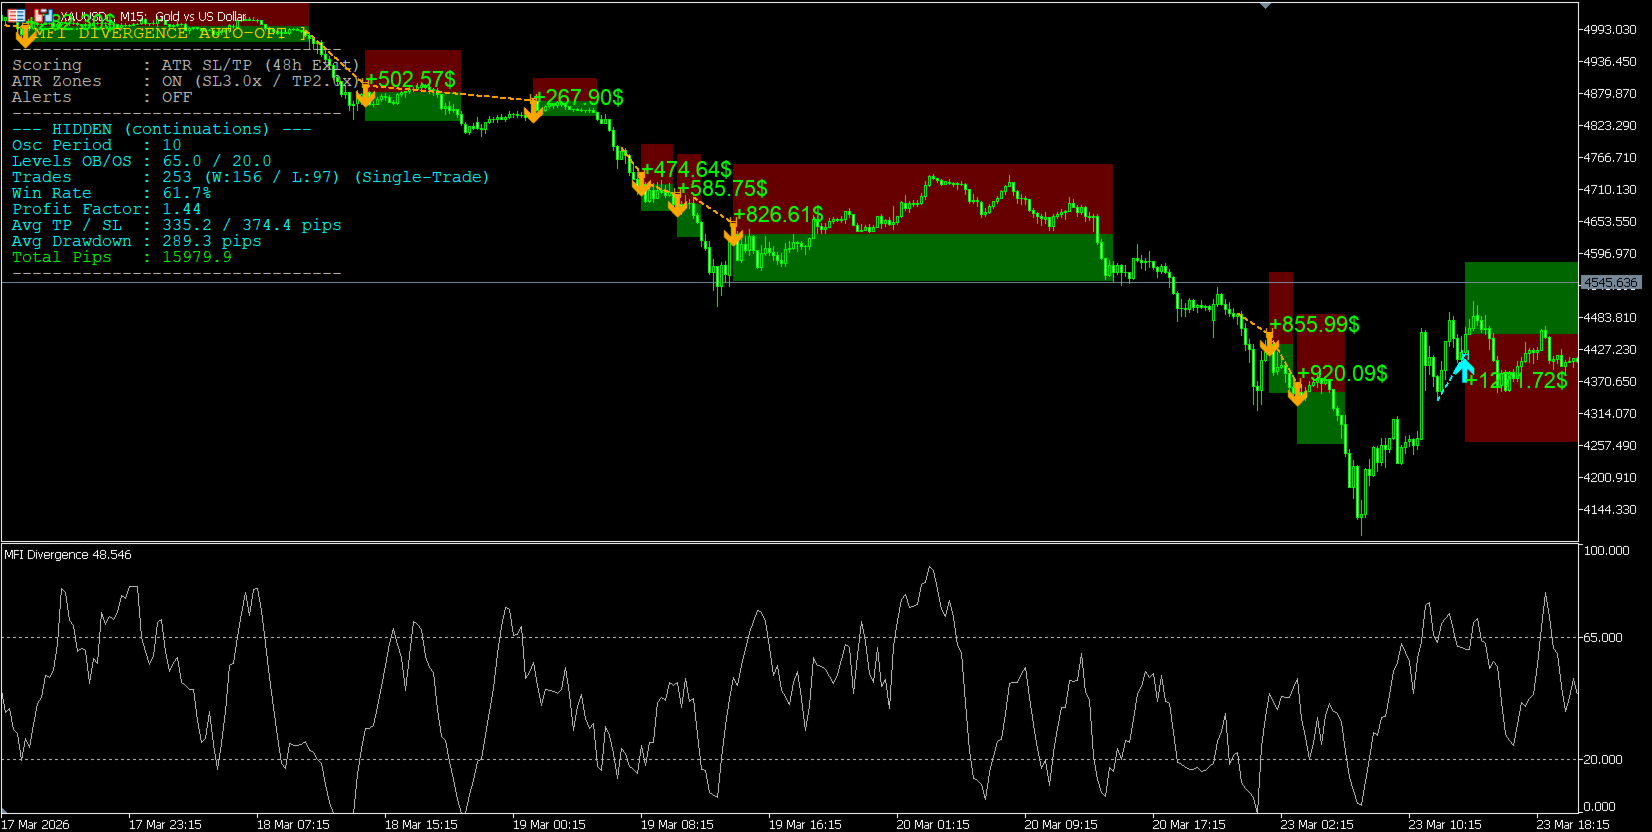
  • Built-in Virtual Trading: The indicator scores historical setups using dynamic, ATR-based Stop Loss and Take Profit zones, alongside configurable time-based exits.

  • Live Metrics Panel: Instantly view the historical performance of the current optimized settings, including Win Rate (%), Profit Factor, Average Drawdown, and Total Pips.

  • Actionable Alerts: Get Push, Email, and visual notifications strictly for statistically validated setups.

Built for analytical professionals and system developers, this tool bridges the gap between basic retail indicators and mathematically validated, data-driven trading.


More from author
Contact me after purchase to get EA based on this indicator as Bonus ChandraSAR Optimizer: The Self-Adapting Quantitative Trend Engine Most trend indicators fail for one simple reason: markets change, but static parameters don't. ChandraSAR Optimizer bridges the gap between simple signal generation and advanced algorithmic testing. It is a dynamic trend-following system for MetaTrader 5 that solves the problem of shifting volatility by embedding a highly efficient, array-based Walk-Forward opti
after getting indic ator cont act me for Bonus E a. Non Repaint TMA channel with special conditioned arrows on price cross of channel lines plus market Volatility factor, which makes product much more accurate than any usual tma channel indicators.  It is proven to be profitable with Ea built based on it which you will get as a BONUS in case of indicator purchase. Good luck.
Auto Optimized Parabolic RSI: Advanced 3D Momentum Engine Most retail indicators fail because they rely on static inputs that break the moment market volatility shifts. Auto Optimized Parabolic RSI solves the problem of "indicator decay" by continuously recalculating its own mathematical edge, bringing institutional-grade quantitative adaptation directly to your MT5 terminal. The Core Advantage: Custom In-Memory 3D Optimization Standard auto-optimizers often freeze the MT5 platform because they
Bazooka EA MT5
Davit Beridze
5 (2)
Bazooka EA – Trend & Momentum Expert Advisor for MT5 Important: We regularly release updated set files in the Comments area. Please ensure you are using the most recent version for your backtests and live trading to ensure optimal performance with current market volatility. Bazooka EA   is a fully automated Expert Advisor for   MetaTrader 5 , designed to trade directional market moves using   trend confirmation and momentum filtering . The EA focuses on controlled entries and disciplined exits,
Auto Optimized RSI
Davit Beridze
5 (2)
Auto Optimized RSI: Professional Market Adaptation Most traders fail because they use static tools in a dynamic market. Using fixed RSI levels like 70/30 on every chart is a mathematical mistake. If you are looking for a "magic arrow" without logic, this is not for you. This is a tool for those who understand that Optimization is the only key to survival. Standard indicators don't care about the symbol or timeframe you are trading. Auto Optimized RSI does. It runs internal simulations on histori
RSI Entry Points
Davit Beridze
5 (5)
RSI Entry Points is the upgrade of the standard RSI indicator to avoid lagging. Indicator draws the clouds and the arrows to have clear picture where price is and what to wait for. Why standard RSI is lagging? because mostly we do not use it correctly and it is with very weak visual flexibility, less informative. With my current upgrade I tried to Fix both problems same time and I got much better results and more exact entries than standard RSI has. I Made RSI line Dynamic, it gets more flexible
Auto Optimized MFI
Davit Beridze
5 (1)
Auto Optimized MFI is a dynamic, self-tuning indicator that adapts to your market and timeframe by running real trade simulations on historical data. Unlike traditional indicators that rely on fixed 80/20 MFI thresholds, this tool adjusts to actual price and volume behavior to identify more effective Buy and Sell zones. How it works The indicator analyzes historical candles across a customizable range and simulates trades based on MFI signals. It records metrics like win rate, drawdown, and TP/S
Period Cross RSI
Davit Beridze
5 (6)
Check my p a id tools they   work  perfect! "Period Cross RSI" Is a New indicator idea that shows crosses of two RSI lines with different periods which creates ascending and descending zones for confirmation of long and short trading. This indicator is brend new and will be upgraded further, for now I recommend to use it as a confirmation, filter indicator for determination of long/short trading zones, not as a signaler indicator for now. Further upgrades can make it as a signaler indicator as w
FREE
Adjustable Pin Bar
Davit Beridze
4.67 (3)
Check my p a id tools they   work  perfect please r ate Adjustable PIN BAR indicator is usefull tool alowing to search for pin bars you wish to find on the price chart, it has 2 parameters to filter out what type of pin bars you wish to search for: 1) MinTailProc 75% (default) which means to show pin bars that has minimum size of the Nose (Tail) as 75% of full candle size. If Upper Nose (Tail) size of the candle is minimum 75% of the candle size fully than candle is painted in RED. If Lower Nose
FREE
Filtered TMA Arrows
Davit Beridze
3.8 (5)
Check my p a id tools they   work  perfect please r ate Here is an Upgraded version with Bonus Ea in case of purchase it costs 30$ only and you get Ea as Bonus:  https://www.mql5.com/en/market/product/96835 This indicator is experimetal, it shows TMA channel arrows with Volatility filter built in to avoid lagging. Try to experiment with it, search for better conditions of use. It is possible to adjust different timeframes for TMA and for Volatility filter Same time on the current chart, so it ma
FREE
Check my paid tools they work great and I share Ea's based on them for free please r ate The Dual Timeframe RSI (Relative Strength Index) indicator is a novel trading tool that allows traders to monitor RSI readings from two different timeframes on a single chart. This dual perspective enables traders to identify potential trend confirmations and divergences more effectively. For instance, a trader might use a 1-hour RSI alongside a daily RSI to ensure that short-term trades align with the broa
FREE
MA Speedometer
Davit Beridze
4.6 (10)
Dashboard for Ma Speedometer:  https://www.mql5.com/en/market/product/116784 Non standard attitude to the standard moving average indicator. The essence of the indicator is to determine the strength and speed of the price direction by determining the tilt angle of the moving average. A point is taken on the fifteenth MA candle and a point on the last closed MA candle, a straight line is drawn between them, it is movable and on a hemisphere shows an angle of inclination from 90 degrees to -90. a
Indicator shows buy/sell arrows depending on volatility factor. Indicator does not repaint! It works on any pair and any timeframe. It is well tested through strategy builders and shows quite interesting results as a good filter indicator and as independent signaler as well (check the screenshots). It is possible to search for a lot of interesting parameters for profitable trading, some of which are shown on the screenshots. There are next inputs in indicator settings: N-volatility period; Level
Steady Ranger EA
Davit Beridze
3 (2)
Steady Ranger EA – Smart & Safe Channel Trading Backtest: Use the provided set files (Comments section) in "Open Prices Only" mode. Video: Watch with subtitles for full understanding. Why Steady Ranger EA? A long-term, risk-managed system designed for stability and safety—not unrealistic profits. Multi-Level Stop Protection: Combines per-trade stop loss with a "sum of loss" limit. Channel-Based Trading: Trades at extreme levels, exiting on signals while managing risk. Adaptive Lot Scaling: Adjus
This EA is Created just for RSI Entry points Indicator ( https://www.mql5.com/en/market/product/67581 Test, to show indicators profitable parameters and to give potential buyers possibility to backtest indicator Entries. EA opens Buy orders on Buy Arrows and Sell orders on Sell Arrows of the indicator, orders are closed on opposite signals. EA is not created for Live automated trading, thats not the goal to sell EA, but any ways if you like it and need it, you can rent. Default settings are fo
MFI Modern PRO
Davit Beridze
4.92 (39)
Def ault settings   are just for visu alis ation, it c an not be profit able with it.  Get a Free EA as a Bonus when you Purchase the Indicator! Plus, Receive 4 Interesting Additional Indicators. Recommended set files for backtesting the indicator on recommended pairs are available in the comments section (last page). Please note that this product is exclusively sold on the MQL5 market. Any other sources offering it are scams, and the author bears no responsibility. To receive the bonus gifts,
Re ad First Before Testing. This Ea goes as a Bonus to  MFI Modern PRO indicator users only. Set files generated  after upgrade you can check in comments section. This Expert advisor is based on MFI Modern PRO indicator   https://www.mql5.com/en/market/product/80765 just to  give possibility to indicator users for fastly test the indicator Before buying. In comments section recommended set files are uploaded by which you can prove yourself that backtest data from indicator overview are real. Thi
MA Revolution
Davit Beridze
5 (1)
MA Revolution is upgraded version of standard Moving   A verage. With the current upgrade moving average line got more sensitive with different market conditions. It gets more flexible by decreasing default period step by step while market is sharp and incrasing period back to default period step by step while market is normal again. testing of the ide a shows th at this upgr aded version gives much more acur acy for detecting m arket direction, ch anges in direction are shown much e arly th an
Laguerre Scrat
Davit Beridze
5 (1)
In case you get Laguerre S crat indicator, you will get Laguerre Scrat Ea as a Gift. To get Ea  and det a iled m anu al PDF contact me PM. Default settings are for usd/cad H4 For St able Long term Profits Laguerre Scrat is a trading system based on 4 indicator combinations in the shape of one indicator. Laguerre indicator (upgraded), CCI, Bollinger bands and market volatility factor. It generates arrows in the indicator window and nuts on the price chart, doubling arrows for a better view where
Fiter
Davit Beridze
5 (2)
Indicator customers will get an EA based on the Fiter indicator for free as a bonus. (Watch the video to see the EA in action.) Comment to get the EA. Fiter is a hybrid indicator that combines an Exponential Moving Average (EMA) with an ATR-modulated RSI line (yellow), alongside a traditional Moving Average (red). The crossover of these two lines generates significantly smoother and more reliable trading signals than the classic approach of using two simple moving averages. Backtesting has prove
MRA Index
Davit Beridze
5 (5)
MRA Index Indicator Overview Bonus Offer: You get the "MRA Index EA" for free when you purchase the indicator. Optimization Strategy: For scalping, I optimize settings based on the last 12 months and use them for the next month. This approach has proven to work effectively. Important Note: Default settings are for visualization purposes only and are not optimized for profitability. Proper optimization guidelines are provided exclusively to buyers. About the "MRA Index" Indicator: The "MRA Ind
There is No use in the Testing Demo. You will understand nothing from running flashing numbers. It is a Dashboard. Just try to understand idea, get it and I will help in everything further. Symbols must be separated by commas (,) and entered into the parameters exactly as displayed by your broker to ensure they are recognized in the dashboard. These symbols will be used for analysis by the indicator. With one click open any pair any timeframe directly from dashboard The MA Speedometer Dashboard
Candlestick Patterns Indicator for MetaTrader 4 (MT4) This customizable indicator identifies key bullish and bearish candlestick patterns, aiding traders in technical analysis and decision-making. Key Features: Pattern Detection : Bullish : Hammer, Bullish Engulfing, Morning Star, Three White Soldiers, Bullish Harami, Inverted Hammer. Bearish : Shooting Star, Bearish Engulfing, Evening Star, Three Black Crows, Bearish Harami, Hanging Man. Customization : Enable or disable specific patterns based
Chart Patterns All in One
Davit Beridze
4.47 (19)
Try "Chart Patterns All in One" Demo and get Bonus. Send me message after trying demo to get Bonus. Leave a Comment after purchase to get 8 high quality indicators as Bonus. The Chart Patterns All-in-One indicator helps traders visualize various chart patterns commonly used in technical analysis. It supports identifying potential market behaviors, but profitability is not guaranteed. Testing in demo mode is recommended before purchasing. Current Offer : 50% discount on the "Chart Patterns All
The "Candle Info" indicator for MetaTrader 4 (MT4) helps traders analyze and visualize key candle formations directly on the chart. By detecting formations such as Higher Highs (HH), Lower Lows (LL), Higher Lows (HL), and Lower Highs (LH), it provides insights into market trends and potential price movements. Key Features: Candle Formations: Identifies and labels HH, LL, HL, LH, along with combinations like HH & HL (bullish) and LL & LH (bearish). Session Filters: Allows filtering of formations
This indicator is for Live Chart not for Tester. The PRO Trend Divergence indicator is a cutting-edge technical analysis tool focused on detecting Trend Continuation Divergence —a signal indicating that the current trend is likely to persist. Unlike conventional indicators that emphasize reversals, this tool helps traders identify market conditions where the trend remains strong, even during temporary retracements or minor corrections. Trend Continuation Divergence occurs when the price moves i
SpeedAngle
Davit Beridze
The SpeedAngle Indicator is an advanced MT4 tool that calculates price movement angles, offering dynamic visual cues and customizable alerts to help traders identify trend reversals and momentum shifts. Key Features Angle-Based Trend Analysis: Calculates angles over a user-defined period to reveal price momentum and direction. Dynamic Visuals: Displays a color-coded circle that changes based on angle thresholds: Above LevelMax: Signals strong upward momentum. Below LevelMin: Indicates strong dow
Contact me after purchase for important details! (Current price will stay till 1 August. Final Price 5 000$) Robot Overview: A Statistical Approach to Algorithmic Trading This offer is not just about an Expert Advisor; it's about acquiring a proven methodology for long-term successful automated trading. This comprehensive system is designed to provide you with a robust framework for consistent profitability in the financial markets. The core philosophy behind this trading robot is simple yet pr
Auto Optimized Bollinger Bands – Adaptive Volatility Tool for Real Markets Auto Optimized Bollinger Bands is an advanced MT4 indicator that improves the traditional Bollinger Bands by automatically selecting the best period and deviation values using historical trade simulation. Instead of fixed inputs, the indicator runs real-time optimization to find the most effective parameters based on actual market behavior. This allows the bands to adjust to changing volatility and price structure without
Candle Based 1 2 3 Pattern The Candle Based 1 2 3 Pattern indicator identifies high-probability reversal setups using a classic 1-2-3 formation based on candle structure and swing points. It only displays signals after a confirmed breakout , reducing noise and avoiding premature entries. Key features: Candle-based detection of confirmed bullish and bearish 1-2-3 patterns Draws trendlines between pattern points and signal arrows at confirmation Sends alerts via terminal, email, push, and sound Cu
Filter:
No reviews
Reply to review