
LongTerm
- Indicators
-
Edoardo Centorame
 I am a professional trader and MT5 developer with several years of experience in trading and developing advanced tools for operational decision support. I create systems and visual tools to help traders interpret market trends and improve their trading strategies.
 - Version: 2.0
- Updated: 12 June 2026
LongTerm is a directional analysis indicator designed to interpret the strength and quality of the medium long term trend, with a specific focus on long oriented analysis.
It is not an entry indicator nor an operational timing tool, but a tool designed to help the trader understand when the market offers favorable or unfavorable conditions for the long trend, reducing the typical noise of short term oscillations.
Objectives
LongTerm was created to:
identify strong and structured long trends
distinguish the phases of expansion, slowdown and exhaustion
provide a clear reading of the dominant directional context
It is an ideal tool for traders oriented toward swing trading and long term analysis.
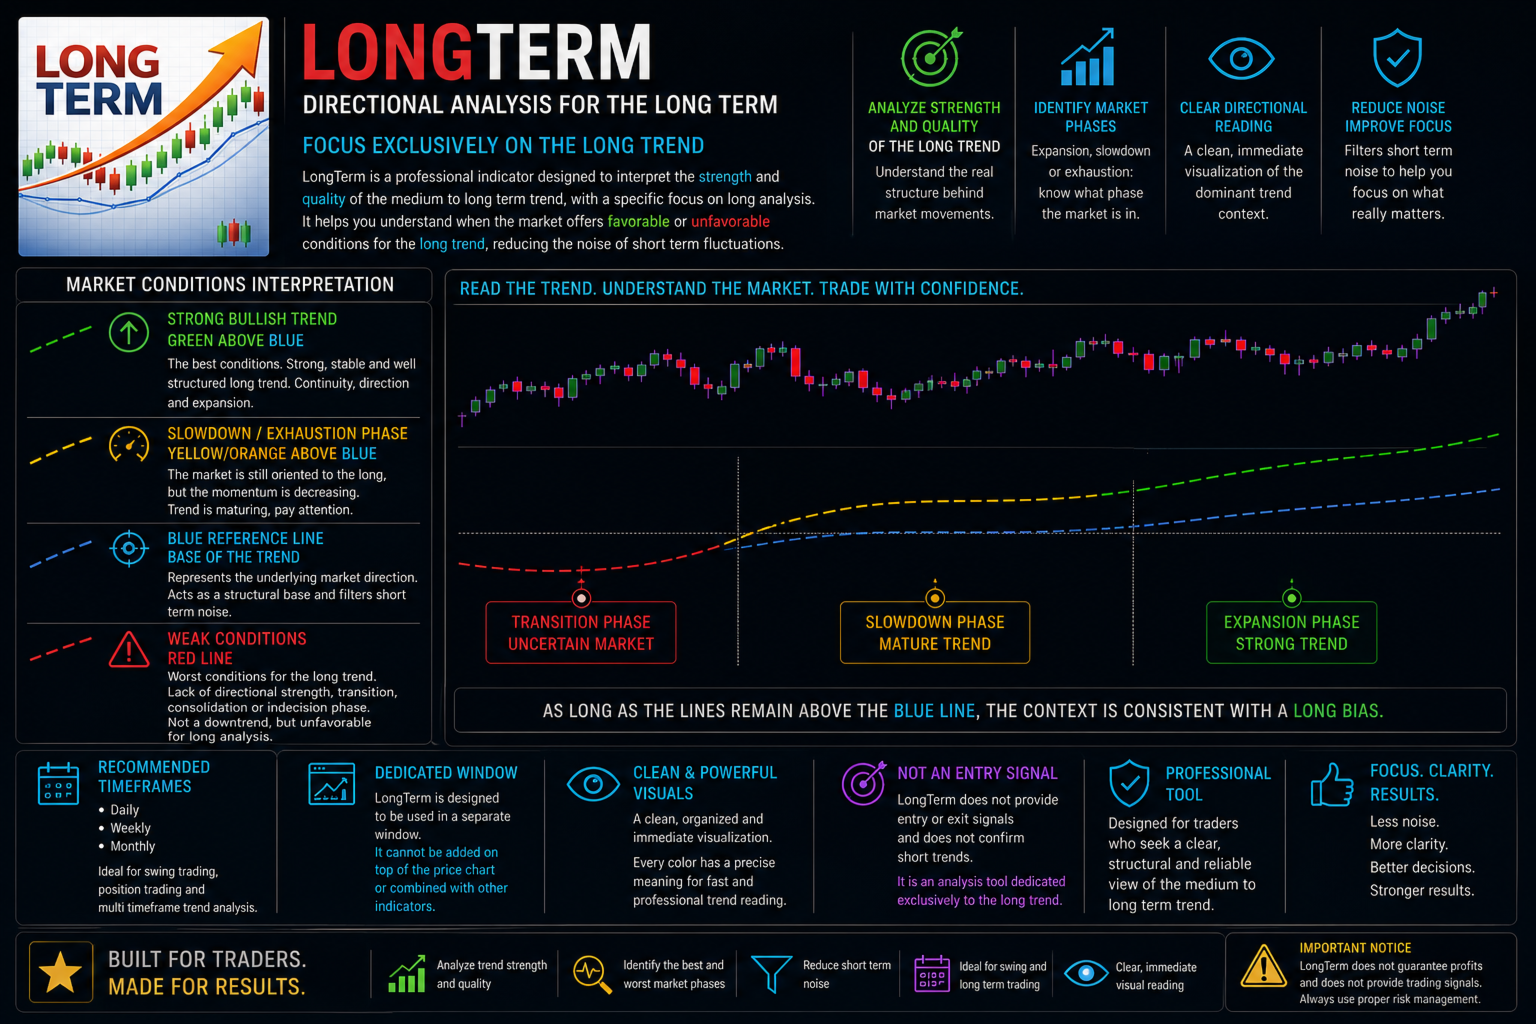
Interpretation of colors and market conditions
LongTerm uses a color structure designed to make the reading of the different phases of the long trend immediate, clearly highlighting the best and worst market conditions.
Green line positively inclined and above the blue line
This configuration represents the best conditions.
The long trend is strong, stable and well structured
The movement shows continuity and directionality
The market is in a phase of trend expansion
It is the most favorable context for medium long term long analysis.
Yellow or orange line above the blue line
Indicates that the market is still oriented to the long side, but in a phase of slowdown or progressive exhaustion.
The main direction remains bullish
The trend push decreases
The movement becomes less efficient
This phase is typical of a mature trend, where it is important to pay attention to the evolution of the directional structure.
Blue line reference line
The blue line represents the underlying direction of the market.
It works as the structural base of the trend
It filters short term noise
It allows the quality of the other phases to be evaluated
As long as the other lines remain above the blue line, the context remains consistent with a long reading.
Red line
The red line identifies the worst conditions for the long trend.
The market shows absence of directional strength
The long tendency is no longer efficient
Transition, congestion or indecision phase
It does not represent a bearish trend, but signals that the market does not offer ideal conditions for medium long term long analysis.
Clarity and visual cleanliness
One of LongTerm’s main strengths is the clarity with which the trend structure is represented.
The indicator was designed to offer a clean, orderly and easily interpretable visualization, allowing the trader to quickly evaluate the quality of the market movement without informational overload.
Recommended timeframes
LongTerm expresses its maximum potential on:
Daily
Weekly
Monthly
It is particularly suitable for:
swing trading
position trading
multi timeframe trend oriented analysis
How to use
LongTerm is designed to be used in a separate window
It is not intended to be overlaid on the price chart
It is not possible to add other indicators on top of it
This setting guarantees a clear, consistent reading focused on the direction and quality of the trend.
Important note
LongTerm does not provide operational entry or exit indications and does not confirm short trends.
It is an analysis tool dedicated exclusively to evaluating the medium long term long context.
In summary
Analyzes the strength and quality of the long trend
Highlights the best and worst phases of the market
Reduces short term noise
Ideal for swing and long term trading
Immediate and clean visual reading











































It looks useful. I’d like to optimize it for additional scalping strategies.