Directional Force Histogram
- Indicators
-
Edoardo Centorame
 I am a professional trader and MT5 developer with several years of experience in trading and developing advanced tools for operational decision support. I create systems and visual tools to help traders interpret market trends and improve their trading strategies.
 - Version: 1.0
- Activations: 10
What is Directional Force Histogram DFH
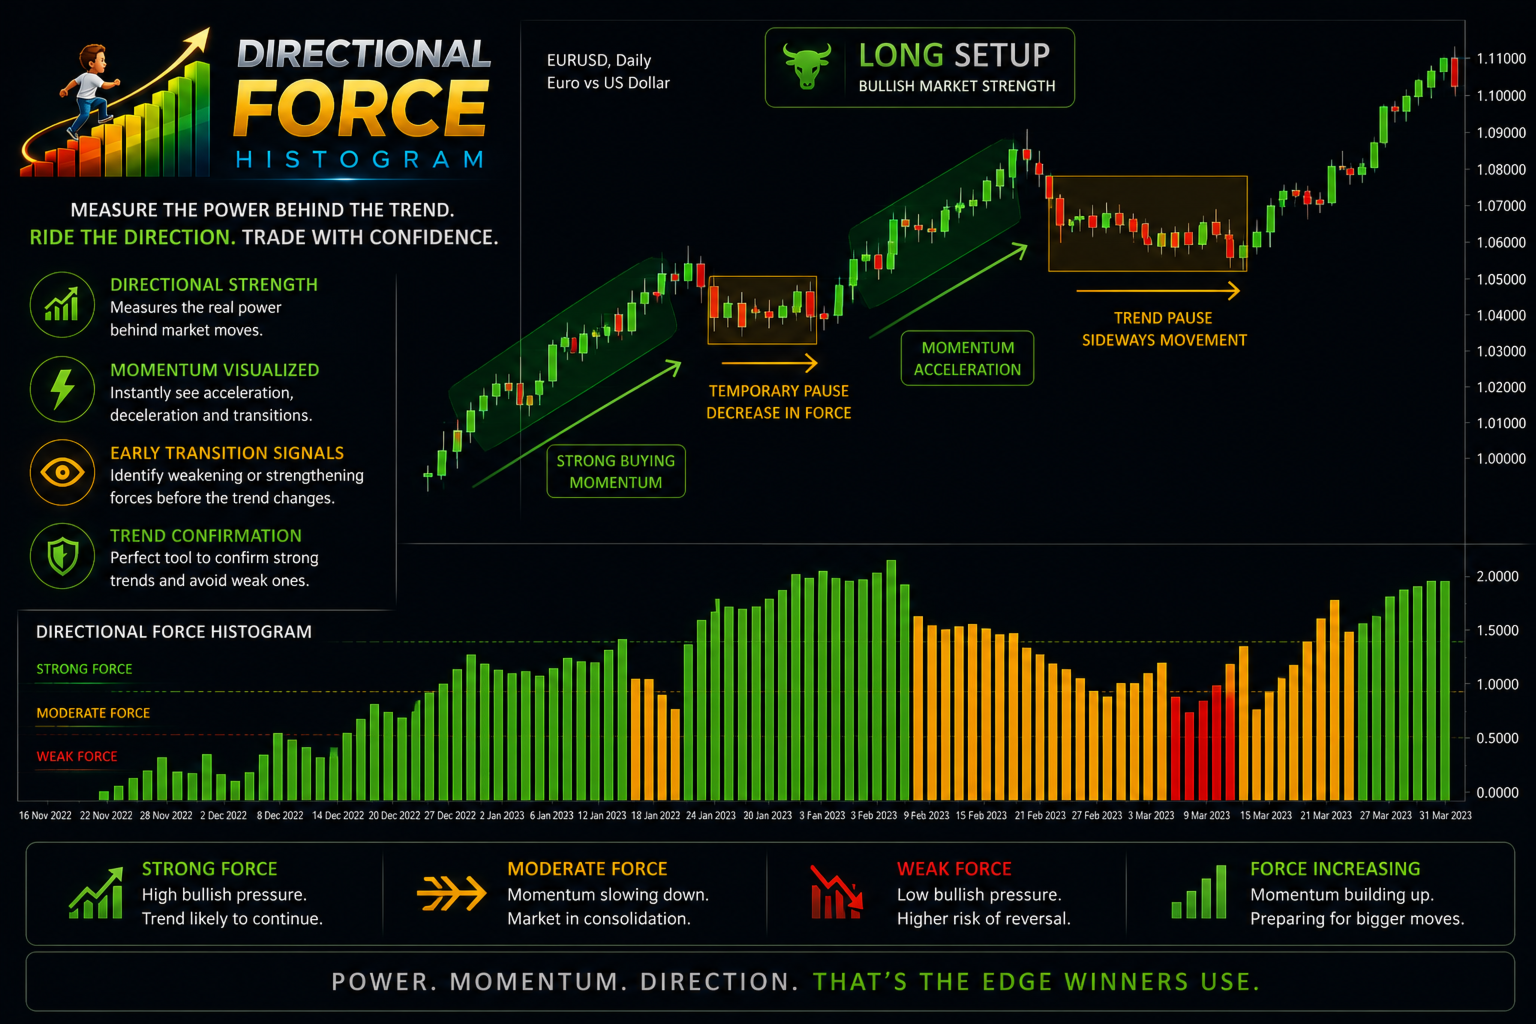
Directional Force Histogram DFH is a histogram indicator designed to mirror market conditions and help the trader immediately interpret directional pressure, movement strength and phases of slowdown or transition.
DFH does not provide automatic buy or sell signals.
Its objective is to offer operational context, improving decision quality and position management.
What DFH measures
Bullish and bearish pressure
Movement intensity
Slowdowns and loss of momentum
Transition and neutrality phases
Trend quality and maturity
The information is represented through a colored histogram, easy to read and suitable for discretionary trading.
Reading colors and bar dynamics
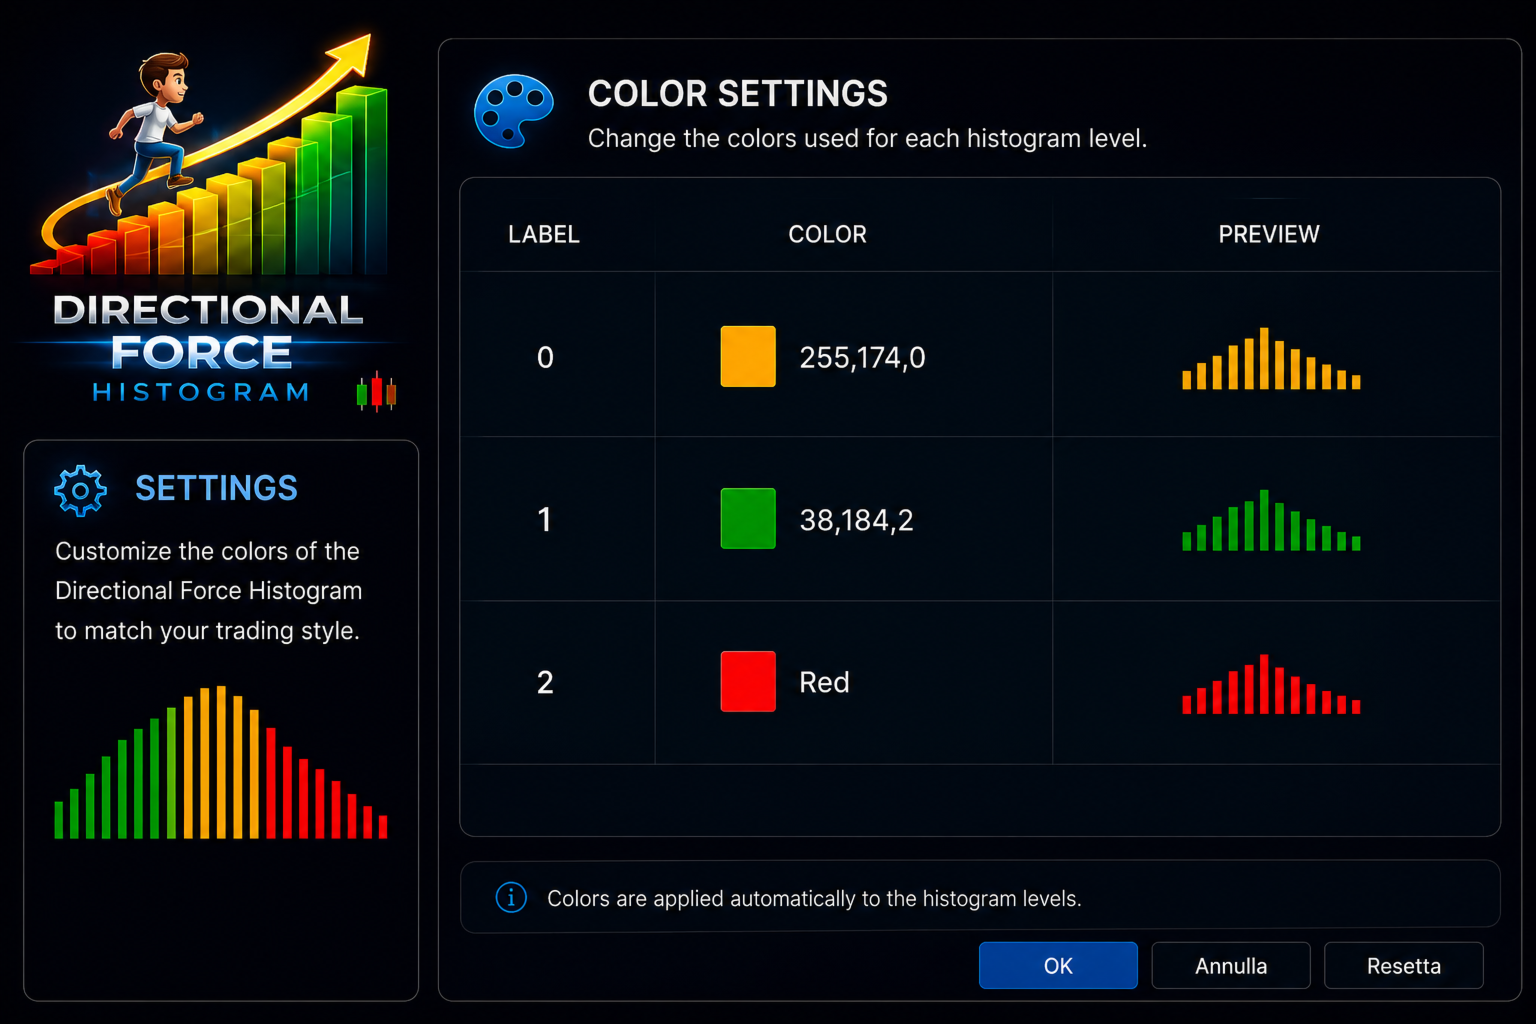
Directional Force Histogram uses color and bar behavior to describe market conditions.
Increasing green bars Bullish pressure increasing
Green bars that progressively increase indicate expanding bullish pressure.
The market is accelerating upward with strong participation.
Typical use:
context favorable for maintaining long positions
avoid short operations against growing strength
confirmation of a healthy bullish trend
Decreasing green bars Bullish slowdown
Bars still green but decreasing indicate loss of bullish momentum.
The trend is not denied, but it shows signs of fatigue.
Typical use:
position management
partial profit taking
tighter protective stops
avoid late new entries
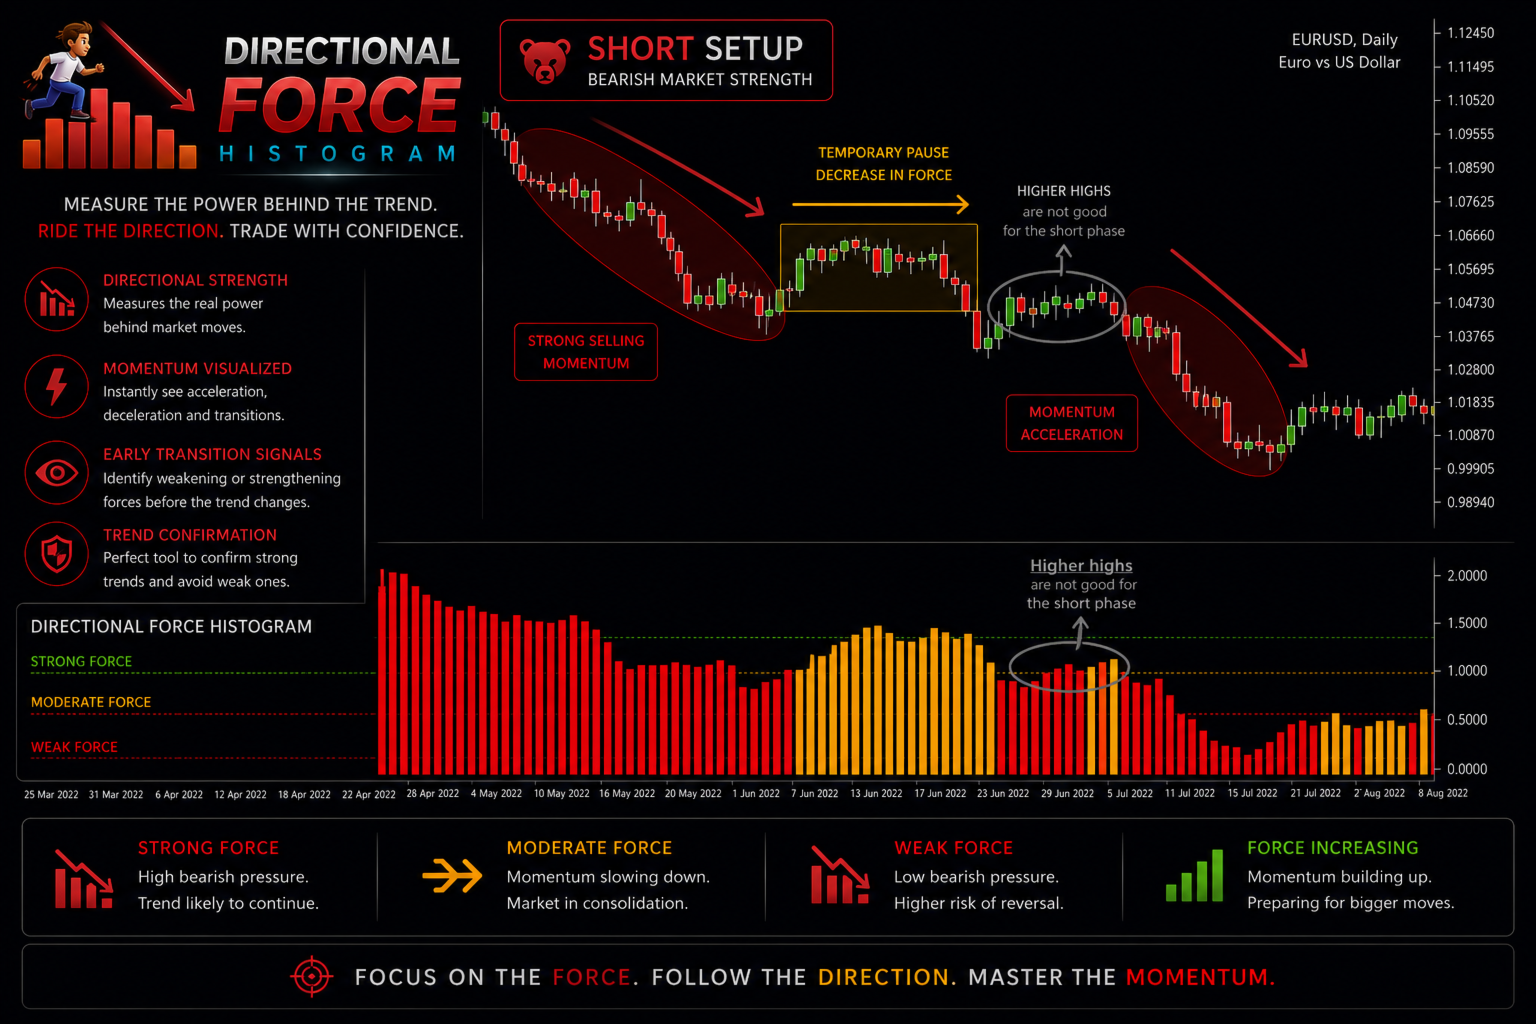
Decreasing red bars Structured bearish pressure
Red bars that progressively reduce represent orderly and controlled bearish pressure.
Typical of clean and well structured bearish trends.
Typical use:
maintaining short positions
confirmation of bearish continuation
avoid long operations against bearish context
Increasing red bars Bearish impulse possible climax
Increasing red bars indicate impulsive bearish acceleration.
Often associated with panic phases or final movements.
Typical use:
prudent management of short positions
attention to possible technical rebounds
avoid late new entries
Orange bars Transition and neutrality
Orange bars indicate loss of directionality and a balance phase.
They often precede a regime change or a sideways phase.
Typical use:
NO TRADE zone
waiting for a new clear structure
filter to reduce overtrading
Advanced reading: slowdown and exhaustion of the long move
Orange after a green phase Long slowing down
When, after a significant sequence of green bars, the histogram turns orange, the bullish movement enters a slowdown phase.
In this condition:
the bullish trend is still valid
buyer pressure decreases
the probability of consolidation increases
Typical use:
active long management
partial profit taking
tighter stops
avoid aggressive new entries
First red bars after orange Long near exhaustion
If red bars begin to appear after the orange phase, bullish pressure is almost exhausted and bearish force begins to emerge.
In this phase:
the long movement is in its final stage
the risk of reversal or correction increases
the probability of bullish continuation decreases significantly
Typical use:
closing remaining long positions
no new long activity
waiting for a new directional context
Operational summary
Increasing green bullish pressure increasing
Decreasing green bullish slowdown
Decreasing red structured bearish pressure
Increasing red bearish impulse possible climax
Orange transition neutrality
Warning
Directional Force Histogram is an analysis and decision support tool.
It does not provide automatic signals and does not guarantee results.
It is intended to be used in combination with risk management, price structure and a personal operational plan.