Directional Volume
- Indicators
-
Vincent Jose Proenca
 I’ve been a trader for over ten years, mainly specializing in CFDs. What I love about trading is the logic, the discipline, and the process of creating tools that simplify decision-making. Since I couldn’t find indicators that fit my approach, I started coding them myself, first out of necessity
 - Version: 1.0
- Activations: 5
Directional Volume — Visualize Bullish vs Bearish Pressure
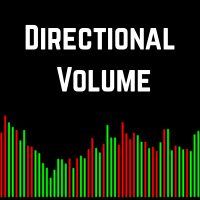
Directional Volume is a lightweight yet powerful volume indicator that separates bullish and bearish trading pressure into an intuitive visual format. Instead of showing just total volume, it highlights how much of that activity is driven by buyers versus sellers — helping traders instantly gauge market sentiment and momentum strength.
How It Differs from Traditional Volume
Unlike standard volume bars that only show total volume per candle, Directional Volume divides activity based on candle direction:
-
Green Histogram – Bullish volume (candles where Close > Open)
-
Red Histogram – Bearish volume (candles where Close < Open)
This split makes it easy to see who’s in control — buyers or sellers — and when momentum begins to shift.
How to Use
-
Attach the indicator to any chart (compatible with all timeframes and instruments)
-
Watch green and red histograms to assess buying/selling strength
-
Look for volume spikes to identify strong pressure or potential breakout zones
-
Compare price action vs. directional volume to spot divergence signals
-
Use divergences to anticipate possible trend reversals or exhaustion points
-
Automatically adapts to tick volume for markets without real volume data
Trading Applications
-
Identify trend confirmation through matching price and volume direction
-
Spot accumulation/distribution phases in ranging markets
-
Detect volume divergences for early reversal warnings
-
Confirm breakouts or trend exhaustion
Directional Volume turns raw volume data into actionable insight — giving traders a clearer read on market dynamics with just a glance.