Cumulative Volume Delta AI
- Indicators
-
Oleh Pastovenskyi
 AI-RE-Style
We automate everyday tasks so you have more time for what truly matters.
Artificial intelligence is only a tool. Leave the mechanical, routine work to algorithms — optimising tasks is exactly what they are for. Your time should go to creativity, to generating ideas and to real life. - Version: 1.40
- Activations: 5
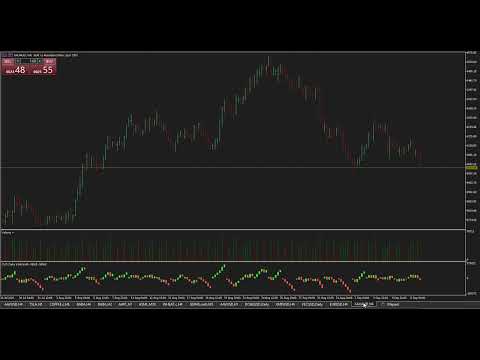
The Cumulative Volume Delta (CVD) indicator (and its associated Volume Delta candles) belongs to the category of volume-based order flow indicators.
Rather than just showing the total amount of trading activity like a standard volume indicator, CVD specifically measures the net difference between buying pressure and selling pressure in the market.
Here is how it breaks down:
-
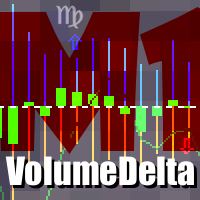
Volume Delta (The Candles): This measures the difference between market buy orders (transactions executed at the ask price) and market sell orders (transactions executed at the bid price) for each individual candle. If a candle has a positive delta, aggressive buyers were in control; if negative, aggressive sellers dominated.
-
Cumulative Volume Delta (The Line/Histogram): The CVD takes those individual candle deltas and aggregates them over time to show the broader trend.
Primary uses in technical analysis:
-
Order Flow & Sentiment: It allows traders to look "inside" the price action to see if buyers or sellers are actually driving the move.
-
Divergence Detection: It is heavily used as a momentum and divergence tool. For example, if the price is making higher highs but the CVD is making lower highs (bearish divergence), it suggests the upward trend lacks genuine buying support and may soon reverse.
-
Breakout Confirmation: Traders use it to confirm whether a breakout past a key support or resistance level is backed by real participation.