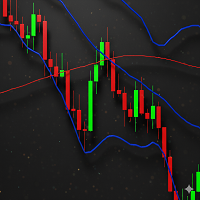
OrderFlow St AutoPOC Pro v8

ORDER FLOW STRUCTURE AUTOPOC PRO

Order Flow Structure AutoPOC Pro is a MetaTrader 5 market analysis indicator that combines market structure, Order Flow, Volume Profile, POC, Value Area, liquidity, FVG, Order Blocks, daily levels, session analysis and risk planning in one visual workspace.

The indicator is designed for traders who want to analyze price action and market participation without relying on multiple separate indicators.

It does not execute trades automatically. All trading decisions and order execution remain under the user's control.

MARKET STRUCTURE

The system analyzes price swings and can identify:

  • Higher Highs

  • Higher Lows

  • Lower Highs

  • Lower Lows

  • Break of Structure (BOS)

  • Change of Character (CHOCH)

  • Bullish conditions

  • Bearish conditions

  • Neutral conditions

Swing strength, analysis range and the number of displayed structural events can be configured.

ORDER FLOW

The indicator includes buying and selling pressure analysis.

When Market Depth is available from the broker, the system can use DOM information to analyze:

  • Bid Volume

  • Ask Volume

  • Imbalance

  • Dominance

  • DOM Levels

When DOM data is not available, the system can use an estimated flow model based on available market data.

Estimated flow should not be interpreted as a direct replacement for an exchange-provided order book.

VOLUME PROFILE AND AUTO POC

The AutoPOC module calculates a volume distribution over a configurable historical range.

The system can display:

  • POC

  • VAH

  • VAL

  • HVN

  • LVN

  • Value Area

The Value Area percentage, number of profile bins and historical range can be configured.

The Point of Control represents the calculated price level with the highest volume concentration within the selected profile.

SIDE VOLUME PROFILE

The indicator includes a side volume profile for displaying volume distribution alongside the chart.

It can show:

  • Volume distribution

  • POC

  • VAH

  • VAL

  • Optional center line

  • Optional price labels

Profile width and horizontal offset can be configured.

LIQUIDITY ANALYSIS

The liquidity module analyzes swing highs, swing lows and repeated structural price levels to identify potential liquidity areas.

The user can configure:

  • Liquidity lookback

  • Equal-level tolerance

  • Maximum number of zones

  • Swing level visibility

Liquidity zones are analytical references and do not guarantee a market reaction.

FAIR VALUE GAPS

The indicator includes optional Fair Value Gap detection.

The user can configure:

  • FVG lookback

  • Maximum number of FVGs

  • Minimum FVG size

Detected FVG areas can be displayed directly on the chart.

ORDER BLOCKS

The Order Block module identifies selected areas associated with previous price structures.

The user can configure:

  • Maximum number of Order Blocks

  • Search range

Order Blocks can be evaluated together with market structure, BOS, CHOCH, liquidity, POC and Order Flow.

DAILY LEVELS

The indicator can display:

  • Current Daily Open

  • Previous Day High

  • Previous Day Low

  • Previous Day Close

  • Asian Session High

  • Asian Session Low

The Asian session range can also be calculated using configurable GMT-based times.

SESSION ANALYSIS

The system identifies different market sessions, including:

  • Asia

  • London

  • London/New York overlap

  • New York

  • Weekend

  • Killzones

GMT offset can be detected automatically or configured manually.

ATR AND EMA

ATR is used to evaluate market volatility and contributes to:

  • Entry Zone

  • Stop Loss

  • Trade Levels

  • Risk planning

The ATR period is configurable.

A configurable EMA is also used as a trend reference. The default setting uses a 50-period EMA.

MARKET BIAS

The indicator combines several analytical elements to calculate a market bias.

The calculation can consider:

  • Market Structure

  • Order Flow

  • POC

  • Value Area

  • EMA

The resulting condition can be classified as:

  • Strong Bullish Bias

  • Bullish Bias

  • No Clear Advantage

  • Bearish Bias

  • Strong Bearish Bias

The purpose is to summarize several market conditions into a visual reference.

It is not a guaranteed prediction of future price movement.

TRADE LEVELS

The indicator includes an optional trade-planning module that can calculate:

  • Entry Zone

  • Stop Loss

  • TP1

  • TP2

The Entry Zone uses the current market reference and ATR-based logic.

Stop Loss combines structural information with ATR volatility.

TP1 and TP2 are calculated using configurable risk/reward ratios.

Default settings:

TP1 = 1.0R

TP2 = 2.0R

These levels can be displayed directly on the chart.

RISK MANAGEMENT

The indicator includes risk-based volume calculation.

The calculation can consider:

  • Account Balance

  • Risk Percent

  • Stop Loss distance

  • Tick Size

  • Tick Value

  • Minimum Volume

  • Maximum Volume

  • Volume Step

If the calculated volume is below the broker's minimum allowed volume, the system can return zero instead of forcing a position size above the calculated risk.

This is particularly relevant for small accounts where the broker's minimum volume may be large relative to available capital.

TRANSPARENT HUD

The indicator includes a configurable HUD designed to provide a compact overview of current market conditions.

It can display:

MARKET

  • Bid

  • Ask

  • Spread

  • ATR

STRUCTURE

  • Current State

  • Structural Event

  • Swing High

  • Swing Low

ORDER FLOW

  • Bid

  • Ask

  • Imbalance

  • Dominance

  • Estimated Flow

PROFILE

  • POC

  • VAH

  • VAL

KEY LEVELS

  • Daily Open

  • Previous Day High/Low/Close

  • Asian Range

  • Current Session

RISK

  • Risk %

  • Entry

  • Stop Loss

  • TP1

  • TP2

  • Risk/Reward

  • Suggested Volume

The HUD can operate with a transparent background and without a visible border.

CHART VISUALIZATION

Depending on the selected configuration, the indicator can display:

  • Market Structure

  • BOS

  • CHOCH

  • Swing Levels

  • Order Blocks

  • Liquidity Zones

  • FVG

  • POC

  • VAH

  • VAL

  • Daily Levels

  • Asian Range

  • Side Volume Profile

  • Entry Zone

  • Stop Loss

  • TP1

  • TP2

The main visual modules can be enabled or disabled individually.

HEATMAP

The indicator includes an optional Heatmap module for analyzing relative concentration areas.

The user can configure:

  • Lookback

  • Number of Bins

  • Width

  • Offset

  • High Threshold

  • Extreme Threshold

  • Number of Zones

  • Zone Duration

  • Dominance

  • Minimum Zone Ratio

The Heatmap is disabled by default to reduce visual and computational load.

ALERTS

The system includes configurable alerts for selected analytical events.

Alerts can be generated for:

  • BOS

  • CHOCH

  • POC

  • Value Area

  • Liquidity

The user can configure:

  • Popup

  • Sound

  • Push Notification

  • Proximity

  • Cooldown

The cooldown helps reduce repeated alerts during fast market movements.

PERFORMANCE

The indicator includes several mechanisms to control calculation and chart redraw workload.

These include:

  • Update Interval

  • Performance Mode

  • Redraw Throttle

  • Heavy Refresh Interval

  • Timer-based Refresh

More intensive calculations can be refreshed at controlled intervals to reduce unnecessary processing.

COMPATIBILITY

The indicator is designed for MetaTrader 5 and uses the active chart symbol and timeframe.

It can be used with different instruments supported by the broker, including:

  • Forex

  • Metals

  • Indices

  • CFDs

  • Other MT5 instruments

Actual behavior depends on the data supplied by the broker.

Relevant broker-specific information includes:

  • Market Depth

  • Tick Volume

  • Tick Size

  • Tick Value

  • Contract Size

  • Minimum Volume

  • Volume Step

  • Trading Hours

  • Historical Data

Real DOM data depends on broker availability. When sufficient DOM data is not available, the system can use estimated flow.

INPUT CONFIGURATION

The input parameters are organized into logical modules.

GENERAL

  • LookbackBars

  • UpdateSeconds

  • PerformanceMode

  • RedrawThrottleMs

  • HeavyRefreshSeconds

  • FontSize

  • FontName

MARKET STRUCTURE

  • ShowStructure

  • SwingStrength

  • StructureScan

  • MaxSwingLabels

  • MaxStructEvents

  • ShowStructLines

  • BreakBufferPoints

ORDER FLOW

  • UseDOM

  • DOMLevels

  • FlowLookback

  • DominanceThreshold

  • ShowEstimatedFlow

AUTO POC / VALUE AREA

  • ShowPOC

  • ShowValueArea

  • POCLookbackBars

  • ProfileBins

  • ValueAreaPercent

  • ShowHVN

  • ShowLVN

SIDE PROFILE

  • ShowSideProfile

  • ProfileWidth

  • ProfileRightOffset

  • ShowProfileCenterLine

  • ShowPriceLabels

HEATMAP

  • ShowHeatmap

  • HeatmapLookbackBars

  • HeatmapBins

  • HeatmapWidth

  • HeatmapLeftOffset

  • HighThreshold

  • ExtremeThreshold

  • ShowHeatmapZones

  • MaxHeatmapZones

  • HeatmapZoneBars

  • HeatmapDominancePercent

  • HeatmapZoneMinRatio

LIQUIDITY

  • ShowLiquidity

  • LiquidityLookback

  • EqualTolerancePoints

  • MaxLiquidityZones

  • ShowSwingLevels

FAIR VALUE GAPS

  • ShowFVG

  • FVGLookback

  • MaxFVG

  • FVGMinPoints

ORDER BLOCKS

  • ShowOrderBlocks

  • MaxOrderBlocks

  • OBSearchBars

KEY LEVELS

  • ShowDailyLevels

  • ShowAsiaRange

  • AsiaStartGMT

  • AsiaEndGMT

SESSIONS

  • ShowSessions

  • GMTOffsetOverride

RISK MANAGEMENT

  • ShowRisk

  • RiskPercent

  • SLAtrMultiplier

  • TPRiskReward

  • ATRPeriod

  • TrendMAPeriod

TRADE LEVELS

  • ShowTradeLevels

  • EntryZoneATR

  • SLATR

  • TP1RiskReward

  • TP2RiskReward

  • TradeLevelBars

HUD

  • ShowHUD

  • PanelX

  • PanelY

  • PanelWidth

  • TransparentHUD

  • ShowHUDBorder

  • ShowBiasBar

ALERTS

  • EnableAlerts

  • AlertPopup

  • AlertPush

  • AlertSound

  • AlertOnStructure

  • AlertOnPOC

  • AlertOnLiquidity

  • AlertProximityPoints

  • AlertCooldownSec

CLEAN CHART MODE

For users who prefer a cleaner chart, the main analytical modules can be reduced to:

  • Market Structure

  • POC

  • Value Area

  • Side Profile

  • HUD

  • Trade Levels

FULL ANALYSIS MODE

For a more detailed market view, users can enable:

  • Market Structure

  • Order Flow

  • POC

  • Value Area

  • HVN/LVN

  • Side Profile

  • Heatmap

  • Liquidity

  • FVG

  • Order Blocks

  • Daily Levels

  • Asian Range

  • Sessions

  • Trade Levels

  • HUD

  • Alerts

The appropriate configuration depends on the computer, number of charts and data supplied by the broker.

ANALYSIS WORKFLOW

A possible workflow is:

  1. Analyze higher-timeframe market structure.

  2. Identify relevant swing highs and lows.

  3. Check for BOS or CHOCH.

  4. Review the Market Bias.

  5. Check POC and Value Area.

  6. Review Order Flow when available.

  7. Analyze liquidity, FVG and Order Blocks.

  8. Review daily levels and current session.

  9. Move to a lower timeframe for more detailed price-action analysis.

  10. Review Entry, Stop Loss, TP1 and TP2.

  11. Check the calculated risk/reward.

  12. Review the risk-based volume.

This is an example of how the modules can be combined and is not a trading recommendation.

LIMITATIONS

The indicator depends on the data available through MetaTrader 5.

Important limitations include:

  • Real DOM data may not be available.

  • Estimated flow is not equivalent to exchange-level order-flow data.

  • Volume Profile depends on available volume information.

  • Session calculations depend on correct time settings.

  • Risk calculations depend on broker symbol specifications.

  • Minimum volume depends on the broker.

  • Historical data quality can affect analysis.

  • Different brokers can produce different results.

Displayed levels are analytical references and can be invalidated by market movement.

NO AUTOMATIC TRADE EXECUTION

Order Flow Structure AutoPOC Pro does not open, modify or close trades.

The indicator provides analytical information and trade-planning levels to help users evaluate market conditions.

The final trading decision and execution remain under the user's control.

SUMMARY

Order Flow Structure AutoPOC Pro combines the following components in one MetaTrader 5 indicator:

  • Market Structure

  • BOS / CHOCH

  • Swing Analysis

  • Order Flow

  • DOM

  • Estimated Flow

  • Imbalance

  • Automatic POC

  • Value Area

  • VAH / VAL

  • HVN / LVN

  • Side Volume Profile

  • Liquidity Zones

  • Fair Value Gaps

  • Order Blocks

  • Daily Levels

  • Asian Range

  • Session Analysis

  • ATR

  • EMA

  • Market Bias

  • Entry Zone

  • Stop Loss

  • TP1

  • TP2

  • Risk/Reward

  • Risk-based Volume

  • Transparent HUD

  • Heatmap

  • Alerts

  • Performance Controls

The objective is to provide an integrated and configurable market-analysis workspace inside MetaTrader 5.

The indicator does not guarantee future results and does not replace the user's own market analysis and risk management.

Recommended products
Delta Profile Volume
Teresinha Moraes Correia
Technical Description of the Indicator – Delta Profile for MetaTrader 5 The Delta Profile is an indicator developed for MetaTrader 5 focused on detailed analysis of volume flow within a defined range of candles. It organizes and displays information about the imbalance of positive volumes (associated with upward movements) and negative volumes (associated with downward movements) at different price levels. The result is a clear view of the chart points where the highest concentration of trades o
Market Trend Indicator Analog Copyright 2025, Jose María Molina Sánchez molinatrader67@gmail.com | Version 1.00 Introduction The Market Trend Indicator Analog is an advanced indicator designed to measure the strength and direction of market trends in real time. Unlike traditional oscillators, this indicator uses an adaptive filtering system that dynamically responds to market conditions, providing a precise analog representation between -100 and +100. Its design allows traders to ide
This Volume Delta Profile is an advanced MetaTrader 5 indicator that visualizes   volume delta (order flow imbalance)   using a volume profile-style histogram. It shows the difference between buying and selling pressure at specific price levels, helping traders identify supply and demand zones. This indicator provides a unique perspective on market dynamics by visualizing the imbalance between buying and selling pressure, offering insights beyond traditional volume analysis. Core Concept Positiv
Ultimate Supply Demand MT5
Ramon Sobrevals Arce
5 (4)
After working during many months, with the help of Neural Networks, we have perfected the ultimate tool you are going to need for identifying key price levels (Supports and Resistances) and Supply and Demand zones. Perfectly suitable to trigger your trades, set up your future actions, decide your Take Profit and Stop Loss levels, and confirm the market direction. Price will always move between those levels, bouncing or breaking; from one zone to another, all the remaining movements are just mark
The VWAP indicator is our version of the popular Volume-Weighted Average Price indicator. The VWAP is the ratio between the value traded (price multiplied by the number of volume traded) and the total volume traded over a specific time period. As a result, it measures the average price of the instrument much better than the simple moving average. Although there are many ways to use the VWAP, most investors use it to calculate the daily average.  The indicator works in five modes: Moving  - In
Desi Bulls PA King Pro
Muhammad Bilal Hussain Khan Muhammad
Desi Bulls PA King Pro — Pure Naked Price Action Sniper Indicator Desi Bulls PA King Pro is an institutional-grade, 100% NON-REPAINTING Naked Price Action indicator designed for precision scalping on Gold (XAUUSD) and Bitcoin (BTCUSD) on the M5 and M15 timeframes. Unlike conventional indicators that clutter your chart with lagging moving averages, RSI, or stochastics, PA King Pro uses pure candlestick geometry, fractal liquidity sweeps, and macro trend flow to identify high-probability instit
PivotWave
Jeffrey Quiatchon
Introducing PivotWave – your ultimate trading companion that redefines precision and market analysis. Designed with traders in mind, PivotWave is more than just an indicator; it’s a powerful tool that captures the pulse of the market, identifying key turning points and trends with pinpoint accuracy. PivotWave leverages advanced algorithms to provide clear visual signals for optimal entry and exit points, making it easier for traders to navigate volatile market conditions. Whether you are a begin
MILESTONE UNLOCKED: PFTA Honey Harvester v14 is OFFICIALLY LIVE on the MT5 Market! After relentless engineering, deep system refinement, and real-world stress validation, PFTA Honey Harvester v14 has successfully conquered the MetaTrader 5 Market Validator — one of the most aggressive automated testing environments in the industry. ️ This is NOT a simple approval. This is a full-scale survival test . The validator simulates: Extreme spread spikes Multi-symbol chaos Multi-timeframe st
RRtoolBox
David Ruiz Moreno
RRtoolbox - Professional Tools: Risk:Reward Trading Tool (SL/TP Horizontals + Pending orders + Diagonals), Alerts set on trend lines (for alerts on diagonal levels), SelfManagement (BE, partials...), close/cancelling by time, Statistics, Info and trading on chart. One-Click Trading with Visual Risk:Reward Management RRtoolbox is a comprehensive trading panel that combines one-click order execution,  statistics and  powerful visual Risk:Reward tools, alerts set with trendlines, on chart butt
VolumeDeltaBars
Stanislav Korotky
This indicator is a conventional analytical tool for tick volumes changes. It calculates tick volumes for buys and sells separately, and their delta on every bar, and displays volumes by price clusters (cells) within a specified bar (usually the latest one). The algorithm used internally is the same as in the indicator VolumeDeltaMT5 , but results are shown as cumulative volume delta bars (candlesticks). Analogous indicator for MetaTrader 4 exists - CumulativeDeltaBars . This is a limited substi
CRT Master Indicator identifies market structure cycles based on Candle Range Theory (CRT) and institutional order flow principles: Accumulation, Manipulation, and Distribution. The indicator identifies range sweeps (liquidity grabs) where price manipulates past structural high/low levels before closing back inside the range. It provides visual zone mapping and multi-timeframe context through Ghost Candles. An automated trading version of this logic is available as the CRT Master EA on my MQL5 p
The Cumulative Volume Delta (CVD) indicator (and its associated Volume Delta candles) belongs to the category of volume-based order flow indicators . Rather than just showing the total amount of trading activity like a standard volume indicator, CVD specifically measures the net difference between buying pressure and selling pressure in the market. Here is how it breaks down: Volume Delta (The Candles): This measures the difference between market buy orders (transactions executed at the ask pric
Was: $249  Now: $99   Market Profile defines a number of day types that can help the trader to determine market behaviour. A key feature is the Value Area, representing the range of price action where 70% of trading took place. Understanding the Value Area can give traders valuable insight into market direction and establish the higher odds trade. It is an excellent addition to any system you may be using. Inspired by Jim Dalton’s book “Mind Over Markets”, this indicator is designed to suit the
Official BlueDigitsFx Ecosystem Access Get infrastructure updates, workflow resources, product releases, and ecosystem access through the official BlueDigitsFx ecosystem. Telegram Ecosystem Website MT4 Version BlueDigitsFx Spike And Strike Reversal MT5 — Mixed Oscillator for Market Reversal & Momentum Analysis BlueDigitsFx Spike And Strike Reversal is a composite oscillator that combines multiple indicator signals to help traders identify possible market reversals, momentum shifts, and exhau
No Demand No Supply MT5
Trade The Volume Waves Single Member P.C.
No Demand No Supply   This indicator identifies   No Demand –No Supply candles to your chart and plots volume bars colored according to the signal. It can be applied to all timeframes or to a specific one only. It can also be used as regular volume indicator  with exceptional future of WEIGHTED VOLUME. Furthermore is has an alert notification, sound and email when a signals occurs. The indicator does not repaint but the alert will come on two candles back due to the definition of No Demand No Su
Liquidity Zone Detector MT5
Komi Eyram F Kahoho
5 (1)
The Liquidity Zone Detector is an advanced technical indicator designed to identify and highlight key liquidity zones in the market using the ZigZag indicator. This tool pinpoints price levels where significant liquidity is likely present by drawing trendlines at the highs and lows detected by the ZigZag. The Liquidity Zone Detector assists traders in spotting potential reversal or trend continuation areas based on liquidity accumulation or release. Key Features: Automatic Liquidity Zone Identif
MarketPredict Pro – Advanced Multi‑Layer Market Analysis   How It Works MarketPredict Pro combines six independent analytical layers to generate highly accurate predictions for the next candle.   6‑Layer Analysis Buyers/Sellers Pressure   – measures the strength of buyers vs. sellers Trend Strength   – 20‑period SMA trend calculation Volatility   – ATR‑like volatility model (14 periods) Market Pressure   – cumulative pressure from the last 5 bars Prediction Engine   – multi‑factor nex
CvdDeltaVolumes
Parasbhai N Patel
Delta + CVD & CVD Candles Order-flow indicator combining Delta (Ask–Bid), Cumulative Volume Delta (CVD), and a unique CVD-based synthetic candle system. Shows buy/sell pressure, volume aggressiveness, and momentum shifts with optional Delta histogram, CVD line, and CVD+Delta combined candles. Useful for scalping, intraday trading, divergence detection, and understanding buyer/seller dominance. Overview The Delta + CVD & CVD Candles Indicator combines multiple order-flow tools into one clean
The SMC Venom Model BPR MT5 indicator is a tool for visual analysis of BPR/FVG zones within the Smart Money Concept (SMC). It automatically identifies key price imbalance zones on the chart and allows you to analyze them on both the current timeframe and multiple timeframes. FVG (Fair Value Gap) — a price imbalance zone identified from a three-candle formation, where an unfilled price range forms between the first and third candles. BPR (Balanced Price Range) — a structure involving two opposing
VOLUME PROFILE SAF-XII                            Professional Market Profile Analysis for MT5   (The Definitive Tool for Grid & Mean-Reversion Traders)         WHAT IS VOLUME PROFILE? Volume Profile is a professional institutional tool that displays trading activity at specific price levels, unlike traditional volume indicators that show volume over time. It reveals WHERE trading occurred, within your window of choice, helping identify:   • FAIR VALUE AREAS (VAH/VAL) - Price levels wh
Time and Sales Tick
Pablo Filipe Soares De Almeida
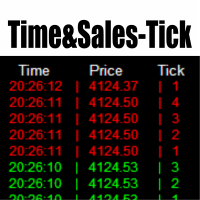
Time & Sales Tick Indicator for MetaTrader 5 This indicator displays real-time trading tick information on MetaTrader 5 charts. It presents price, tick volume, and time. Functionality Displays tick data, including price, volume, and time, in a panel on the chart. Groups ticks into user-defined intervals, with color-coded price movements (green for upward, red for downward). Allows panel positioning in any chart corner.
CosmiCLab SMC FIBO CosmiCLab SMC FIBO is a professional trading indicator designed for traders who use Smart Money Concepts (SMC), market structure analysis and Fibonacci retracement levels. The indicator automatically detects market swings and builds Fibonacci levels based on the latest impulse movement. It also identifies market structure changes such as BOS (Break of Structure) and CHOCH (Change of Character), helping traders understand the current market direction. CosmiCLab SMC FIBO also pr
RSI Currency Strength Meter is a powerful and elegant multi-currency indicator that measures the real-time relative strength of the 8 major currencies using RSI logic. By calculating the smoothed performance of each currency across its major pairs and applying the RSI formula, it delivers clean and responsive strength lines that make it easy to spot which currencies are truly strong or weak at any moment. This indicator is particularly useful for visualizing currency correlations and divergence
Smart Volume Zone
Gleidson Duca De Aguiar
Launch price: 30 USD - price will increase after the first purchases, so early buyers lock in this rate. Smart Volume Zone marks the trading candle with the highest tick volume within the last N trading days (configurable, default 10) and highlights it directly in the terminal's native Volumes panel, with no separate window and no third-party dependency. How it works: the indicator scans every M1 candle within each of the last N days, finds the single highest-volume candle per day, then compar
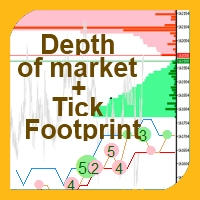
This indicator allows you to enjoy the two most popular products for analyzing request volumes and market deals at a favorable price: Actual Depth of Market Chart Actual Tick Footprint Volume Chart This product combines the power of both indicators and is provided as a single file. The functionality of Actual COMBO Depth of Market AND Tick Volume Chart is fully identical to the original indicators. You will enjoy the power of these two products combined into the single super-indicator! Below is
PipFinite Exit EDGE MT5
Karlo Wilson Vendiola
4.88 (32)
Did You Have A Profitable Trade But Suddenly Reversed? In a solid strategy, exiting a trade is equally important as entering. Exit EDGE helps maximize your current trade profit and avoid turning winning trades to losers. Never Miss An Exit Signal Again Monitor all pairs and timeframes in just 1 chart www.mql5.com/en/blogs/post/726558 How To Trade You can close your open trades as soon as you receive a signal Close your Buy orders if you receive an Exit Buy Signal. Close your Sell orders if
Marubozu Trend Rider
Sylvestre Setufa Djagbavi
Strategy Overview This robot applies a simple, visual, and highly effective logic: take advantage of market excesses to enter on confirmed reversals.It combines Bollinger Bands analysis, trend detection through a Moving Average (MA), and Marubozu candlestick reading to identify zones where the probability of a reversal is highest.The strategy aims to enter after an excess, followed by a clear price-recovery signal, avoiding impulsive entries. Buy Conditions The robot opens a BUY only if: The pri
VibeFox Volume Profile — Volume Profile for MetaTrader 5 VibeFox Volume Profile is a complete Volume Profile toolkit for MetaTrader 5. It builds the horizontal distribution of traded volume across price, so you can instantly see where the market spent the most activity, where it traded thin, and which price levels are likely to act as magnets or barriers. Every profile is drawn directly on the chart and controlled from a modern, mouse-driven panel — no menus to dig through, no scripts to attach.
If you like this project, leave a 5 star review. Follow on TikTok: @quantum.trader       [ Any Symbol Can Be ADDED ]       DM me for adding any Pair symbol, crypto, index, stock or anything related. you can also DM me in TikTok [@quantum.trader] Works on [ EURUSD-GBPUSD-GBPJPY-USDJPY-XAUUSD-US30-BTCUSD-ETHUSD-SOLUSD ] This indicator calculate and draw the Prediction or Forecast the peaks of the current day ( forecast high - forecast low - forecast middle - forecast upper q - forecast lower q
**   All Symbols   x   All Timeframes   scan just by pressing scanner button ** Discount: The price is 100$, But now it is just 39$, Limited time offer is active. *** Contact me  to send you instruction and add you in "Trend Reversal group" for sharing or seeing experiences with other users. + FREE   Trading Utility MT5 - Big Update: 2026/10/22 Introduction: Trendlines are the most famous technical analysis in trading . Trendlines continually form on the charts of markets across all the differe
Buyers of this product also purchase
Trend Sniper X
Sarvarbek Abduvoxobov
4.87 (46)
Trend Sniper X is a multi-timeframe trend-following indicator for MetaTrader 5 that helps traders identify trend direction and potential reversal points with clarity and precision. for MT4: https://www.mql5.com/en/market/product/193245 Price Information: The current price is promotional and is subject to change as upcoming updates and new features are released. Bonus Offer: To get the FREE Auto-Trade Assistant EA for this indicator, please message the author after purchasing. Code2Profit Channe
Entry Points Pro shows you where to enter, where to put the stop and what lot to trade — before you place the order. PRICE Now 199 USD: 4 copies at this price, then 249 USD. The final price is 349 USD. I make my money trading the markets, and I show it, so I don't need to sell this indicator to everyone. It is a tool for traders who think for themselves, not a magic button. No breakout, no trade. A gray arrow is a cancelled signal: price did not break the signal candle, so there was no entry
Gann Made Easy   is a professional and easy to use Forex trading system which is based on the best principles of trading using the theory of W.D. Gann. The indicator provides accurate BUY and SELL signals including Stop Loss and Take Profit levels. You can trade even on the go using PUSH notifications. PLEASE CONTACT ME AFTER PURCHASE TO GET TRADING  INSTRUCTIONS   AND GREAT EXTRA INDICATORS  FOR FREE! Probably you already heard about the Gann trading methods before. Usually the Gann theory is a
SuperScalp Pro
Van Minh Nguyen
4.54 (37)
SuperScalp Pro - Professional Multi-Layer Confluence Scalping System SuperScalp Pro is an advanced scalping indicator that upgrades the classic Supertrend with multiple intelligent confirmation filters. It helps you identify higher-probability Buy/Sell opportunities while significantly reducing false signals. Clear Buy and Sell arrows appear directly on the chart, along with automatic ATR-based Stop Loss and Take Profit levels calculated in real time. After purchase, please message me on MQL5 to
Ultra Indicator
Ihor Otkydach
5 (1)
ULTRA is a technical indicator that operates on an “all-in-one” basis—it independently analyzes the market, generates trading signals, displays levels for setting stop-loss orders, and suggests when to close trades to lock in profits or minimize losses. In other words, it doesn't matter if you don't know how to analyze the market, determine levels—where to set your stop-loss—or struggle with money management. ULTRA will do all of that for you! BUYER BONUS: After purchasing the ULTRA indicator, s
Boba Analysis Suite
Trade Ready Solutions LLC
5 (2)
Boba Analysis Suite Boba Analysis Suite is an analytical indicator for MetaTrader 5. It brings market structure, relevant price zones and broader market context together in a single chart view. Developed through practical experience as a trader and trading coach, it supports a structured analysis process: assessing market direction, identifying important levels and considering multiple timeframes together. Analysis in Context Individual signals gain meaning through context. Boba Analysis Suite h
FX Power MT5 NG
Daniel Stein
5 (33)
FX Power: Analyze Currency Strength for Smarter Trading Decisions Overview FX Power is your go-to tool for understanding the real strength of currencies and Gold in any market condition. By identifying strong currencies to buy and weak ones to sell, FX Power simplifies trading decisions and uncovers high-probability opportunities. Whether you’re looking to follow trends or anticipate reversals using extreme delta values, this tool adapts seamlessly to your trading style. Don’t just trade—trade
Power Candles MT5
Daniel Stein
4.58 (12)
Power Candles - Self-Optimizing Strength Indicator Strength usually lives in a sub-window. The line runs below, the candle above, and your eye keeps connecting the two. Power Candles puts the strength into the candle itself, colored from dark red to dark green, so the chart reads at a glance and the sub-window stays closed. The indicator also finds its own settings for the symbol and timeframe in front of you. One click on [ Apply Best ] draws entry, Stop Loss and Take Profit at the exact prices
M1 Sniper MT5
Oleg Rodin
5 (7)
M1 SNIPER  is an easy to use trading indicator system. It is an arrow indicator which is designed for M1 time frame. The indicator can be used as a standalone system for scalping on M1 time frame and it can be used as a part of your existing trading system. Though this trading system was designed specifically for short-term trading, it still can be helpful for all traders. This trading system can be used with any forex pair and time frame, though lower time frames are recommended from M1 up to M
Auto Optimized SpeedAngle is an institutional-grade momentum vectoring system that eliminates curve-fitting through continuous Walk-Forward Optimization (WFO). Rather than relying on static inputs that degrade when market regimes shift, the indicator dynamically recalibrates its parameters using Out-of-Sample (OOS) validation, ensuring the displayed signals represent genuine statistical edges rather than historical anomalies. By shifting the focus from subjective visual angles to normalized, qua
Azimuth Pro
Ottaviano De Cicco
5 (7)
Azimuth Pro V2: Synthetic Fractal Structure and Confirmed Entries for MT5 Overview Azimuth Pro is a multi-level swing structure indicator by Merkava Labs . Four nested swing layers, swing-anchored VWAP, ABC pattern detection, three-timeframe structural filtering, and closed-bar confirmed entries — one chart, one workflow from micro-swings to macro-cycles. This is not a blind signal product. It is a structure-first workflow for traders who care about location, context, and timing. 1. What Change
Apex Patterns PRO Buy Indicator - Get Expert Advisor Based on it for FREE. Self-Optimizing Chart Pattern & Breakout Intelligence Traditional pattern scanners rely on fixed inputs, often underperforming when market volatility and structures shift. Apex Patterns PRO is designed to adapt to changing market conditions by combining structural chart pattern recognition, momentum filtering, and statistical self-optimization into one analytical framework. Adaptive Scanning Engine Self-Optimizing Patter
Meridian Pro
Ottaviano De Cicco
4 (3)
Meridian Pro 2.00: Professional Multi-Timeframe Trend Matrix for MT5 Meridian Pro 2.00 is a professional adaptive trend matrix for MetaTrader 5. It combines the original Meridian trend engine, a clean chart ribbon, closed-bar signal arrows, an 8-timeframe dashboard, Fuel momentum, weighted consensus, synthetic HTF processing and chart-native higher-timeframe context lines. The goal is simple: read current trend, multi-timeframe structure, strength, momentum and EA-ready state from one discipline
Welcome to Entry In The Zone & SMC Multi Timeframe Entry In The Zone & SMC Multi Timeframe An indicator designed for market analysis based on Smart Money Concepts (SMC), displaying Market Structure, Key Zones (Order Blocks, Supply & Demand Zones, and Fair Value Gaps), Liquidity, and real-time BUY / SELL signals. It supports both Single-Timeframe and Multi-Timeframe analysis, along with the Confluence at Zone feature, which helps you evaluate supporting factors when price enters a key zone. Real-
Divergence Bomber
Ihor Otkydach
4.89 (94)
Each buyer of this indicator also receives the following for free: The custom utility "Bomber Utility", which automatically manages every trade, sets Stop Loss and Take Profit levels, and closes trades according to the rules of this strategy Set files for configuring the indicator for various assets Set files for configuring Bomber Utility in the following modes: "Minimum Risk", "Balanced Risk", and "Wait-and-See Strategy" A step-by-step video manual to help you quickly install, configure, and
Adaptive Price Action Engine Buy Indicator- Get EA Based on it for FREE. Self-Optimizing Multi-Timeframe Trend & Candlestick Intelligence Markets do not behave the same way all the time—and not every price-action pattern has the same value in every market regime. Adaptive Price Action Engine is designed to adapt to changing market conditions by combining trend structure, multi-timeframe analysis, candlestick patterns, and statistical optimization into one analytical framework. Two Adaptive Mode
Currency Strength Wizard   is a very powerful indicator that provides you with all-in-one solution for successful trading. The indicator calculates the power of this or that forex pair using the data of all currencies on multiple time frames. This data is represented in a form of easy to use currency index and currency power lines which you can use to see the power of this or that currency. All you need is attach the indicator to the chart you want to trade and the indicator will show you real s
Crystal Heikin Ashi Signals
Muhammad Jawad Shabir
5 (5)
Crystal Heikin Ashi Signals—Professional Trend & Signal Detection Indicator Advanced Heikin Ashi Visualization with Intelligent Signal System for Manual & Automated Trading Final Price: $149 ---------> Price goes up $10 after every 10 sales . Limited slots available — act fast . Overview User Guide PDF Crystal Heikin Ashi Signals is a professional-grade MetaTrader 5 indicator that combines pure Heikin Ashi candle visualization with an advanced momentum-shift detection system. Designed for both m
Naked Forex Tweezer Pro Indicator Tweezer Pro Indicator is a pattern recognition indicator for Forex, Stocks, Indices, Futures, Commodities and Cryptos. The standard Tweezer is a two bar pattern. Our enhanced version is a multi-bar pattern. We filter the patterns for you so that you only get the     best and most effective patterns   and ignore the noise. The Tweezer pattern is a simple and effective pattern to trade. The strategy that comes with the Tweezer is based on price action. The Twe
Advanced Supply Demand MT5
Bernhard Schweigert
4.53 (15)
BLACK FRIDAY – 30% OFF Best Solution for any Newbie or Expert Trader! This indicator is a unique, high quality and affordable trading tool because we have incorporated a number of proprietary features and a new formula. With this update, you will be able to show double timeframe zones. You will not only be able to show a higher TF but to show both, the chart TF, PLUS the higher TF: SHOWING NESTED ZONES. All Supply Demand traders will love it. :) Important Information Revealed Maximize the pote
Fx Levels Premium Indicator Support and Resistance are important concepts in trading. Fx Levels Premium was created to easily draw important levels of support and resistance for the active trader. The indicator will give you all important levels (support/resistance) to watch for a wide range of assets. Trading without these levels on your chart is like driving a car for a long journey without a roadmap. You would be confused and blind. Support and resistance levels should be used as guideline
Apollo SR Master is a Support/Resistance indicator with special features which make trading with Support/Resistance zones easier and more reliable. The indicator calculates Support/Resistance zones in real-time without any time lag by detecting local price tops and bottoms. Then to confirm the newly formed SR area, the indicator shows special signal which signalizes that the SR zone can be taken into consideration and used as an actual SELL or BUY signal. In this case the strength of the SR zone
Astral Volume
Ottaviano De Cicco
Astral Volume Read volume-weighted momentum in its wider context. Launch Special — $78 · Save 35% · $120 after launch. A strong local move can look different on a higher timeframe. For traders who use volume alongside price, Astral Volume brings the local reading and the wider picture together before they assess a directional change. Judge the move in context. See tick-volume-weighted momentum and how its intensity compares with recent history. Spot agreement and disagreement. Keep two higher-ti
Neuro Poseidon MT5
Daria Rezueva
4.68 (53)
Neuro Poseidon is a new indicator by Daria Rezueva. It combines precise trading signals with adaptive TP/SL levels - creating best possible trades as a result! Message me and get  Neuro Poseidon Assistant  as a gift to automize your trading process! What makes it stand out? 1. Proven profitability on all assets and timeframes 2. Only confirmed BUY and SELL signals present on the chart 3. Adaptive TP & SL levels generated by the software for each trade 4. Easy to understand - suitable for al
SIO Oscillator: Self-Optimizing Semivariance Imbalance Oscillator Buy the indicator and get the Expert Advisor based on it for FREE. Most oscillators treat all price movement the same. SIO separates upside and downside market pressure and measures the imbalance between them, showing which side is really in control: buyers or sellers. When the imbalance reaches an extreme, SIO prints a clear signal with entry, Stop Loss and Take Profit levels. What makes SIO different is that it doesn’t rely on f
Trend Lines PRO MT5
Roman Podpora
5 (1)
TREND LINES PRO    helps understand where the market is truly changing direction. The indicator shows real trend reversals and points where major players re-enter. You see   BOS lines   Trend changes and key levels on higher timeframes — without complex settings or unnecessary noise. Signals don't repaint and remain on the chart after the bar closes. VERSION MT 4     -     Reveals its maximum potential when paired with the   RFI LEVELS PRO  indicator What the indicator shows: Real shifts   tren
IX Power MT5
Daniel Stein
4.92 (13)
IX Power: Unlock Market Insights for Indices, Commodities, Cryptos, and Forex Overview IX Power is a versatile tool designed to analyze the strength of indices, commodities, cryptocurrencies, and forex symbols. While FX Power offers the highest precision for forex pairs by leveraging all available currency pair data, IX Power focuses exclusively on the underlying symbol’s market data. This makes IX Power an excellent choice for non-forex markets and a reliable option for forex charts when deta
ARICoins
Temirlan Kdyrkhan
ARICoin is a powerful trading companion designed to generate high-probability entry signals with dynamic TP/SL/DP levels based on volatility. Built-in performance tracking shows win/loss stats, PP1/PP2 hits, and success rates all updated live. Key Features: Buy/Sell signals with adaptive volatility bands Real-time TP/SL/DP levels based on ATR Built-in MA Filter with optional ATR/StdDev volatility Performance stats panel (Success, Profit/Loss, PP1/PP2) Alerts via popup, sound, push, or email Cust
FX Trend MT5 NG
Daniel Stein
5 (6)
FX Trend NG: The Next Generation Multi-Market Trend Intelligence Overview FX Trend NG is a professional multi-timeframe trend and market monitoring tool designed to give you a complete structural overview of the market in seconds. Instead of switching between dozens of charts, you instantly see which symbols are trending, where momentum is fading, and where strong alignment exists across timeframes. This tool is part of the Stein Investments ecosystem: setup guides, videos, workshops and Max,
Precision Spike Detector
Francisco Mandomo Simbine
5 (2)
Precision Spike Detector V3 – Institutional-Grade AI Trading System Attention: The price increases by US$50 for every 10 purchases.  Final price: US$599 Precision Spike Detector V3   is a   state-of-the-art, institutional-grade market analysis system   for   MetaTrader 5 , designed to detect   high-probability market movements   in synthetic indices such as   Boom, Crash, GainX, and PainX . After purchase, send me a private message to receive the optimized configuration files,  the installation
More from author
XAUUSD OrderFlow Structure AutoPOC Pro is an advanced MetaTrader 5 indicator designed to analyze market structure, order flow, buying and selling pressure, liquidity, and volume distribution directly on the chart. The indicator is especially focused on XAUUSD (Gold) analysis, although it can also be used with other instruments available in MetaTrader 5. Its objective is to bring together several analytical tools that would normally require multiple indicators: market structure, BOS and CHOCH, Or
XauUsd Smart Strategy EA v4
Sergio Millares Raposo
XAUUSD Smart Strategy EA v4.00 Intelligent Automation for XAUUSD Trading with Multi-Timeframe Analysis and Advanced Risk Management A strategy designed to focus on quality, not quantity XAUUSD Smart Strategy EA v4.00 is an advanced Expert Advisor for MetaTrader 5 designed to automate a trading strategy based on the combination of trend analysis, market strength, volatility, Multi-Timeframe confirmation, Price Action and dynamic risk management. Designed primarily for XAUUSD, this system does not
XauUsd Strategy EA v4
Sergio Millares Raposo
A professional Expert Advisor (EA) for XAUUSD that operates on a 5-minute timeframe, based on moving average crossovers to detect trends and clean entries in gold.** It is designed to capture fast and solid movements, filtering out false signals and avoiding noise in sideways markets. Ideal for traders seeking automation, consistency, and a clear strategy for a high-volatility asset. The system adapts to the dynamics of XAUUSD and can be used on both live and funded accounts, with integrated ris

NAS100 Strategy EA v1
Sergio Millares Raposo
A professional Expert Advisor (EA) for the Nasdaq 100 that operates on a 5-minute timeframe, based on price action and moving average crossovers to detect trends and clean entries on the Nasdaq 100. It is designed to capture fast and solid moves, filtering out false signals and avoiding noise in sideways markets. Ideal for traders seeking automation, consistency, and a clear strategy for the asset. The system adapts to the dynamics of the Nasdaq and can be used on both live and funded accounts,
XauUsd Smart Strategy v5
Sergio Millares Raposo
XAUUSD SMART STRATEGY EA Advanced Multi-Timeframe Trading System for MetaTrader 5 Automate your XAUUSD trading with a structured strategy combining trend analysis, Multi-TimeFrame confirmations, volatility filters, dynamic trade management, and advanced risk controls. XAUUSD Smart Strategy EA has been developed specifically for trading Gold (XAUUSD) on MetaTrader 5 , combining trend analysis, momentum, volatility, moving-average structure, Fair Value Gap filtering, and automated position managem
Smart Strategy EA v6 VISUAL
Sergio Millares Raposo
XAUUSD Smart Strategy EA Price Action • Market Structure • Fibonacci • Smart Risk Management XAUUSD Smart Strategy EA is a professional MetaTrader 5 Expert Advisor designed specifically for Gold (XAUUSD) , combining Price Action, Market Structure, Dynamic Fibonacci analysis, trend confirmation, momentum filters, volatility analysis and advanced trade management into one integrated trading system. The EA is designed to identify structured trading opportunities rather than relying on a single tech
Filter:
No reviews
Reply to review