CVD Divergencies

CVD Divergencies — Cumulative Volume Delta with Automatic Divergence Detection

See what's really driving price — not just where it's going.

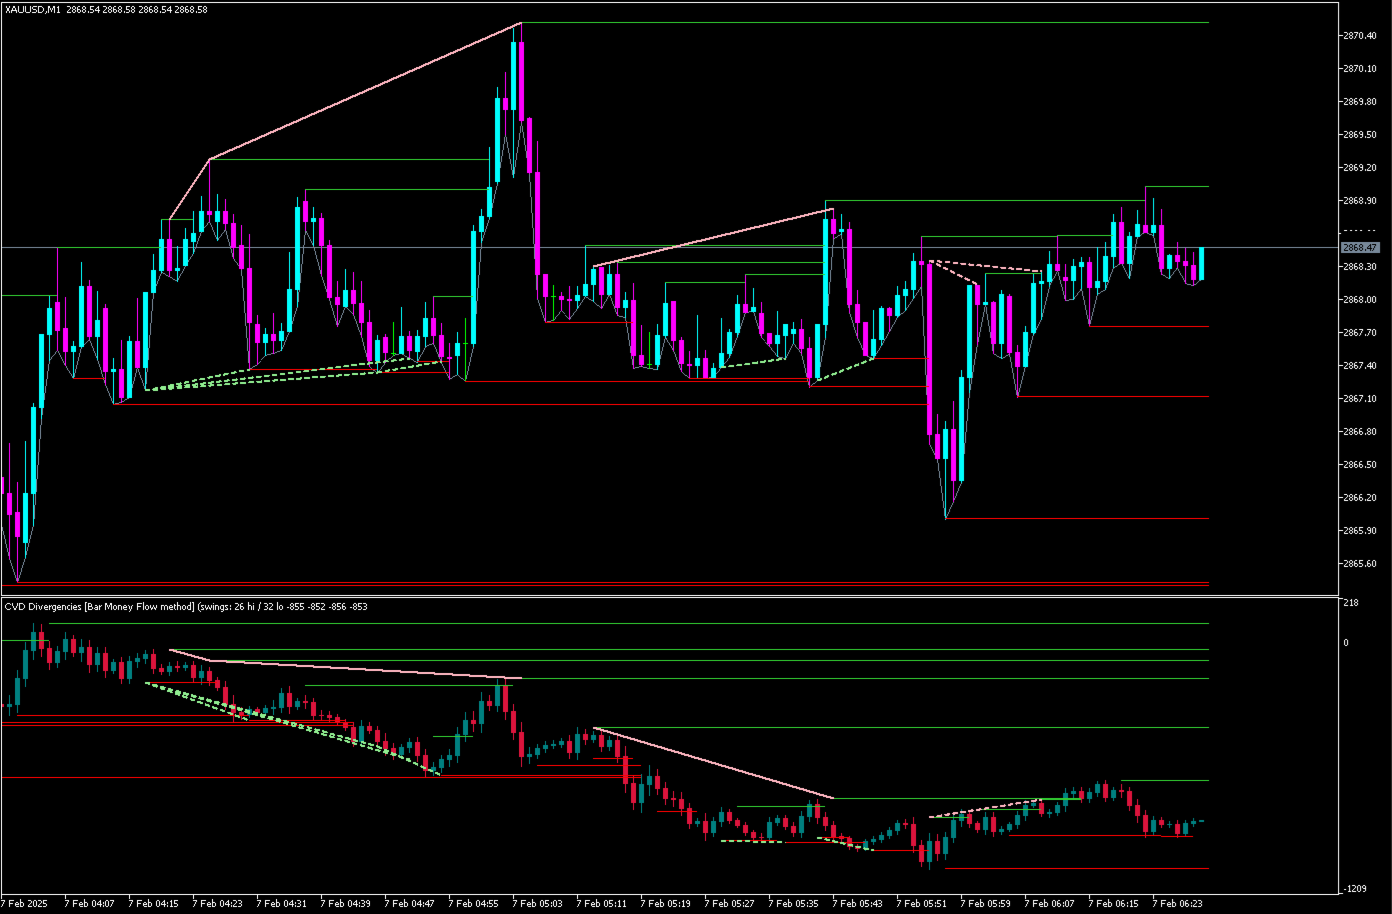
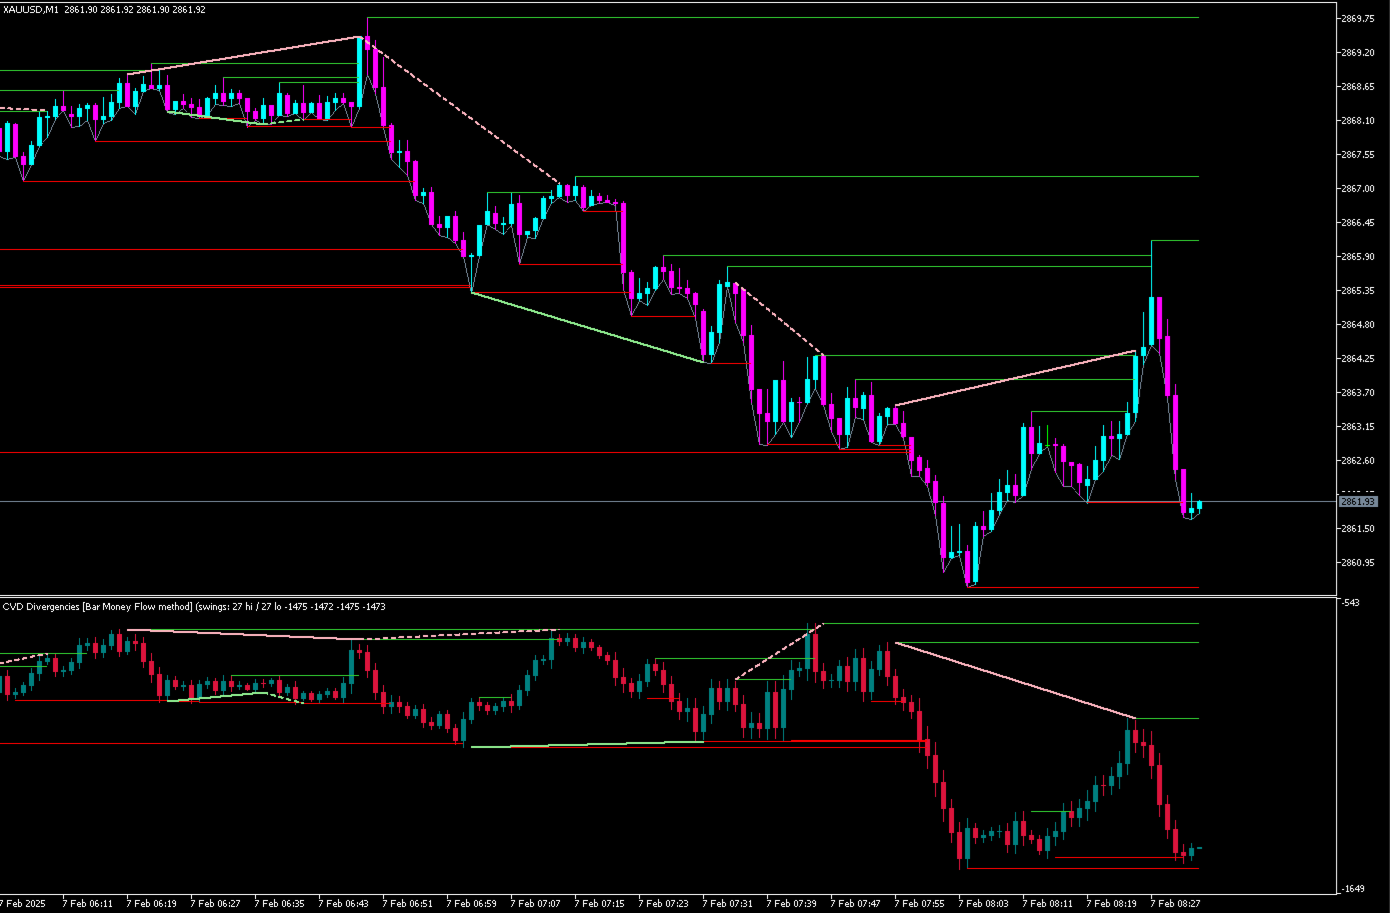
CVD Divergencies plots Cumulative Volume Delta (CVD) as its own candlestick chart and automatically detects and draws divergences between price and CVD in real time — on both the CVD window and directly on your price chart. No manual chart-watching required: when price and underlying order flow disagree, the indicator finds it, draws it, and alerts you.

Key Features

  • CVD Candles — full OHLC candlestick representation of cumulative volume delta, not just a line, so you can read the shape and momentum of order flow the same way you read price
  • 4 calculation methods — choose the approach that best fits your instrument and broker's data (see below)
  • Automatic Regular Divergence detection — classic reversal signal
  • Automatic Hidden Divergence detection — trend-continuation signal
  • Divergence lines on both windows — drawn on the CVD panel and directly on your price chart, so the confluence is immediately visible
  • Configurable swing high/low lines — on both the CVD window and price chart
  • Built-in alerts — popup and terminal push notification the moment a new divergence forms
  • Non-repainting — once a signal is confirmed it never changes or disappears; nothing is redrawn retroactively
  • Deep customization — colors, line styles, thickness, sensitivity, and detection width are all configurable

What is Cumulative Volume Delta?

CVD tracks the running balance of buying pressure versus selling pressure over time. Unlike ordinary volume, which just shows how much activity happened, CVD shows who's winning — buyers or sellers — and by how much. Plotted as its own chart, CVD often moves differently from price itself, and those moments of disagreement are exactly where this indicator focuses.

What Are Divergences?

Regular Divergence — reversal signal. Price makes a new extreme that CVD doesn't confirm, warning that the move's underlying momentum is weaker than price alone suggests.

  • Regular Bullish: price makes a lower low, but CVD makes a higher low
  • Regular Bearish: price makes a higher high, but CVD makes a lower high

Hidden Divergence — continuation signal. The mirror-image pattern, typically appearing during a pullback within an established trend, suggesting the trend is likely to continue.

  • Hidden Bullish: price makes a higher low, but CVD makes a lower low
  • Hidden Bearish: price makes a lower high, but CVD makes a higher high

Both are standard technical-analysis concepts — the same logic used for RSI or MACD divergence — applied here to order flow instead of a momentum oscillator.

Trading with Absorption & Exhaustion

Two of the most useful order-flow concepts you can read directly from these divergences:

Exhaustion happens when price makes a strong move but CVD fails to confirm it — the move is being driven by momentum rather than genuine sustained participation, and it's running low on fuel. This is exactly what Regular Divergence captures:

  • Price makes a new high, but CVD makes a lower high → buying pressure is exhausted, watch for a reversal down
  • Price makes a new low, but CVD makes a higher low → selling pressure is exhausted, watch for a reversal up

Absorption happens when one side is actively "catching" the other's aggressive pressure — building position while preventing price from moving much despite heavy underlying volume. When the absorbed side eventually gives out, price tends to move sharply in the absorber's direction. Watch for CVD to build strong directional momentum in the CVD window while price stays comparatively flat or struggles to keep pace at a key level, even when the price panel looks calm.

For best results, combine divergence signals with:

  • Support & Resistance — a divergence that forms right at a well-established S/R level carries far more weight than one in open space. Wait for price to actually interact with a level before acting on a signal.
  • Volume Profile — absorption at high-volume nodes (areas where the most historical volume has traded) often marks major turning points, since that's where large participants are most likely positioned.
  • VWAP — a divergence forming as price tests VWAP from either side is one of the highest-probability setups in order-flow trading; VWAP tends to act as both a magnet and a decision point for institutional flow.

This indicator doesn't need S/R, Volume Profile, or VWAP built in — simply add your existing indicators for those to the same chart, and use CVD Divergencies as the order-flow confirmation layer on top. A divergence alone is a useful signal; a divergence at a key level is a much stronger one.

Calculation Methods

Method Best for
Bar Money Flow (default) Chaikin-style volume weighting; works well across most instruments and brokers
Sierra Fixed, volume-scaled wick centered on the bar
Tick Rule Uses real tick-by-tick data for maximum precision (requires your broker to provide tick history)
OHLC Path Estimates the intrabar path from candle shape alone

Switch methods anytime from the settings — no need to reload your chart layout.

Recommended Settings

The indicator ships with default settings that have been tested extensively across live market conditions and give a reliable balance of accuracy, responsiveness, and clean charts. For most traders, the defaults are the best starting point — the settings below are there for anyone who wants to fine-tune sensitivity or appearance to their own style.

Settings Guide

CVD Calculation

  • Calculation method — how CVD is derived from price and volume. Bar Money Flow (default) gives the most reliable results across most brokers and instruments.
  • Bars to calculate — how much history the indicator processes on load. Higher values give more visible history at a small cost to load time.
  • Price source — which price feed to use for tick-based calculation (only relevant if using the Tick Rule method).

Swing Lines

  • Show on CVD window / Show on price chart — toggle the horizontal swing high/low lines on either panel independently.
  • Swing sensitivity — how many bars on each side are needed to confirm a swing point. Lower values find more (smaller) swings; higher values find fewer (larger) ones.
  • Bars to scan — how far back the indicator looks when searching for swing points.
  • Colors and thickness — visual styling for the swing lines.

Divergence Detection

  • Show regular / Show hidden — turn each divergence type on or off independently.
  • Wait for confirmation — when enabled, a swing point is only used once confirmed by a few bars afterward, avoiding false signals from price that hasn't settled yet. Recommended to leave on.
  • Minimum swing size — filters out small, noisy swings so only meaningful moves are considered for divergence.
  • Volatility window — how many recent bars are used to judge what counts as a "meaningful" swing, so the filter adapts to current market conditions rather than a single old, outsized move.
  • Minimum / Maximum width — how close together or far apart the two points of a divergence are allowed to be.
  • Line tolerance — how strictly the connecting line must avoid crossing through candles in between; a small tolerance allows for normal market noise.
  • Colors, line thickness, and line styles — visual styling, with regular and hidden divergences distinguishable by both color and line style.

Alerts

  • Enable alerts — master switch for popup/push notifications.
  • Alert on regular / Alert on hidden — choose which divergence types trigger a notification.

Display

  • Show status info — displays the active calculation method along with live swing and divergence counts directly in the indicator's name, for a quick at-a-glance check.

Who Is This For?

  • Day traders and scalpers looking for order-flow confirmation on entries
  • Swing traders identifying high-probability reversal or continuation zones
  • Anyone already using volume/order-flow concepts who wants it automated rather than eyeballed

Notes

Feel free to contact me for any questions, suggestions or issues.

CVD is calculated from your broker's available tick and volume data. Works on any symbol and any timeframe — Forex, indices, commodities, and crypto.

Trading involves substantial risk. This indicator is an analysis tool, not financial advice, and does not guarantee profitable results. Always use proper risk management and test thoroughly on a demo account before live trading.

Recommended products
The VWAP indicator is our version of the popular Volume-Weighted Average Price indicator. The VWAP is the ratio between the value traded (price multiplied by the number of volume traded) and the total volume traded over a specific time period. As a result, it measures the average price of the instrument much better than the simple moving average. Although there are many ways to use the VWAP, most investors use it to calculate the daily average.  The indicator works in five modes: Moving  - In
MR Volume Profile 5
Sergey Khramchenkov
The "MR Volume Profile 5" indicator is a charting tool that displays trading volume at different price levels rather than time intervals. A key concept in volume profile is the point of control (POC)—the price level with the highest volume traded during the session or time range. While tools like VWAP or OBV provide volume trends, the "MR Volume Profile 5" indicator offers granular detail about where the most market activity occurs at specific price levels. This makes it a more precise tool for
Heiken Ashi Stacked Pro is a chart overlay indicator that combines smooth Heiken Ashi visual trend candles, a real-time bar completion timer, and an on-hover crosshair HUD for instant price and wick-to-body ratio diagnostics. Marketplace Description Overview Heiken Ashi Stacked Pro upgrades standard Heiken Ashi candle visuals with an interactive HUD. Designed for trend followers and price action traders, it filters out market noise using colored candles while supplying precise candle metric read
VolumeDeltaBars
Stanislav Korotky
This indicator is a conventional analytical tool for tick volumes changes. It calculates tick volumes for buys and sells separately, and their delta on every bar, and displays volumes by price clusters (cells) within a specified bar (usually the latest one). The algorithm used internally is the same as in the indicator VolumeDeltaMT5 , but results are shown as cumulative volume delta bars (candlesticks). Analogous indicator for MetaTrader 4 exists - CumulativeDeltaBars . This is a limited substi
Time and Sales Tick
Pablo Filipe Soares De Almeida
Time & Sales Tick Indicator for MetaTrader 5 This indicator displays real-time trading tick information on MetaTrader 5 charts. It presents price, tick volume, and time. Functionality Displays tick data, including price, volume, and time, in a panel on the chart. Groups ticks into user-defined intervals, with color-coded price movements (green for upward, red for downward). Allows panel positioning in any chart corner.
CVD SmoothFlow Pro
Thalles Nascimento De Carvalho
CVD SmoothFlow Pro - Unlimited Volume Analysis for Any Asset! CVD SmoothFlow Pro is the ultimate solution for traders seeking precise and unlimited volume analysis. Utilizing Cumulative Volume Delta (CVD) with advanced noise filtering, the Pro Version provides the flexibility and precision needed to trade any financial asset. What does CVD SmoothFlow Pro offer? Clear Analysis : Filters out noise and highlights significant volume movements across any financial asset. ️ Precise Calculation
English Version Unlock the Power of Volume with Next-Generation Volume Profile This advanced Volume Profile indicator transforms your MetaTrader 5 chart into a powerful volume analysis tool. Unlike standard volume indicators that only show volume over time, this tool displays volume distribution across   price levels , allowing you to pinpoint exactly where the "big money" is trading. Why choose this indicator? Dynamic Price Bins:   Set your own precision (number of rows) to view volume clust

The Volume+ and VSA Signals indicator for MT5 is based on the Volume Spread Analysis (VSA) methodology to provide the signals. The signals are displayed at closing of bars on the main window or subwindow in the form of symbols. The symbols are not repainting.  The indicator produces a signal on an individual bar and this signal is not buy or sell signal. When a minor trend goes in the opposite direction of a major trend, there are sequences of major trend-following signals that give a higher pro
Volume Profile Delta
Juan Eduardo Verdala
Volume Profile Delta — Indicator for MetaTrader 5 Volume Profile Delta is an indicator that displays the difference between buying volume and selling volume recorded on each bar, represented as a histogram at the bottom of the chart. What this indicator does On each bar it calculates the difference between the volume associated with upward movements and the volume associated with downward movements. The result is shown as a bar in the lower histogram, making it possible to observe whether buying
FREE
Tick Volume Moving Averages
Kristmundur Roman Zakharii
Separated tick volume moving averages: This tool makes it is easier to track the volume behind the moves. It will separate tick volume into bullish and bearish volumes with two separate moving averages. Tracking volume versus price in an easy way is now accessable to any trader. It will put you on track with the market makers and those who move the price. Volume is not the only thing which moves the price but its an important factor behind it. Hence it has a predictive power. How tick volume w
Buy/Sell Volume Indicator with Pair Divergence for MT5  version "1.1" Description The Enhanced Buy/Sell Volume Indicator is a custom technical indicator designed for MetaTrader 5 (MT5) to analyze and visualize buy and sell tick volumes in a separate window. It provides traders with insights into market dynamics by highlighting volume dominance, balance, and divergence patterns. The indicator uses tick volume data to estimate buying and selling pressure, offering a detailed view of market sentime
Mirror Chart MT5
Andrej Hermann
5 (1)
The Mirror Chart MT5 is a overlay indicator specifically designed to project a second financial instrument directly onto the main chart window. This tool is invaluable for traders who rely on correlation analysis, as it visualizes the price movements of two different instruments in real time. Unlike traditional overlays, this indicator utilizes intelligent, dynamic centering and scaling logic. It continuously analyzes the visible price range in the current window for both symbols and calculates
FREE
LM Volume Profile MT5 LM Volume Profile MT5 displays the distribution of calculated volume across price levels directly on the MetaTrader 5 chart. The indicator divides the selected price range into configurable price rows and displays the volume distribution as a horizontal histogram. It also calculates the Point of Control, Value Area High, Value Area Low, average profile price, and optional VWAP reference. Four profile modes are available: - Visible Range - Fixed Range - Session - Daily
FREE
Do you use volume in your reading of the market? Certainly many traders use it, and do not imagine operating without it. The Color Histogram Volume Set indicator allows the user to choose the value that he considers interesting to monitor. When you pass this you will have visual confirmation and if you want you will also have the audible alert that is given by the indicator. Of course, there are other ways to try to find a high volume, such as assessing whether the volume is above av
IMPORTANT NOTICE – LICENSE & ACTIVATION REQUIRED Activation Instructions: Upon completing your purchase, please contact us immediately to receive your license key, password, or activation details. Without these, the software will not function. We are here to ensure a seamless activation process and assist you with any questions Volume Delta Profile V2 Enhanced ================================ Professional Volume & Delta Analysis Tool ----------------------------------------- Overview --
Mini Chart Indicators
Flavio Javier Jarabeck
The Metatrader 5 has a hidden jewel called Chart Object, mostly unknown to the common users and hidden in a sub-menu within the platform. Called Mini Chart, this object is a miniature instance of a big/normal chart that could be added/attached to any normal chart, this way the Mini Chart will be bound to the main Chart in a very minimalist way saving a precious amount of real state on your screen. If you don't know the Mini Chart, give it a try - see the video and screenshots below. This is a gr
Delta Profile Volume
Teresinha Moraes Correia
Technical Description of the Indicator – Delta Profile for MetaTrader 5 The Delta Profile is an indicator developed for MetaTrader 5 focused on detailed analysis of volume flow within a defined range of candles. It organizes and displays information about the imbalance of positive volumes (associated with upward movements) and negative volumes (associated with downward movements) at different price levels. The result is a clear view of the chart points where the highest concentration of trades o
UPD1 Profile Levels MT5
Vitaliy Kuznetsov
5 (4)
The indicator finds the levels of the maximum and minimum price volume (market profile) on the working histogram for the specified number of bars.  Composite profile . The height of the histogram is fully automatic and adapts to any instrument and timeframe. The author's algorithm is used and does not repeat well-known analogues. The height of the two histograms is approximately equal to the average height of the candle. Smart alert will help you to inform about the price concerning the volume l
Volume Candle Indicator
Pablo Filipe Soares De Almeida
Volume Color Histogram for MetaTrader 5. This indicator displays volume as a histogram in a separate window. The bars are colored based on the direction of the price candle: green for bullish (close > open) and red for bearish (close < open). Key Features Volume source: Tick volume or real volume (user-selectable). Optional moving average line over the volume histogram, which can be enabled via input. Supported average types: SMA, EMA, SMMA, LWMA. Average period is configurable. Compatible with
The Accumulation and Distribution indicator is a volume-based indicator that was essentially designed to measure underlying supply and demand. This is accomplished by trying to determine whether traders are actually accumulating (buying) or distributing (selling). This is accomplished by plotting a cumulative total of the money flow volume for each period. This indicator can reveal divergences between volume flow and actual price to primarily affirm a current trend or to anticipate a future reve
IMPORTANT NOTICE – LICENSE & ACTIVATION REQUIRED   Activation Instructions: Upon completing your purchase, please contact us immediately to receive your   license key, password, or activation details . Without these, the software will not function. We are here to ensure a seamless activation process and assist you with any questions. Multilingual Customization To enhance your trading experience, we offer full customization of the software in multiple languages. Our team can provide tra
Here   our more valuable tools SMC Trend Trading   ,  Easy SMC Trading  ,  Institutional SMC Architect Volume Analysis Tools  ,  Volume flow Profile  ,  Market volume profile  , FVG with Volume  , Liquidity Heatmap Profile  ,  Volume Spread Analysis Boom: Take SELL signals only (price spikes up then crashes) Crash: Take BUY signals only (price drops then spikes up) SL goes beyond the line as labeled Interactive Market Watch Panel : A left-side sidebar showing real-time strength indicators (po
Symbol: EURUSD Timeframe: 30 minutes (M30) For other symbols or timeframes, adjust the settings to match the market. Volume Profile POC Breakout builds a volume profile from recent candles, finds the Point of Control (POC) and marks clean breakouts of that level. Each breakout is shown as a complete trade plan with entry, stop loss and three take profit levels, filtered by the higher timeframe trend and rated by a quality score. The indicator does not open trades. It is a visual and analysis to
The Super Arrow Indicator provides non-repainting buy and sell signals with exceptional accuracy. Key Features No repainting – confirmed signals remain fixed Clear visual arrows: green for buy, red for sell Real-time alerts via pop-up, sound, and optional email Clean chart view with no unnecessary clutter Works on all markets: Forex, gold, oil, indices, crypto Adjustable Parameters TimeFrame Default:   "current time frame" Function:   Sets the time frame for indicator calculation Options:   Can
MT4 Version : https://www.mql5.com/en/market/product/157433 MT5 Version : https://www.mql5.com/en/market/product/167286 Volume Imbalance is a lightweight Volume Profile + Delta Imbalance visualization tool designed to help you spot high-activity price zones, directional pressure, and “empty” price areas inside a configurable lookback range. Unlike classic volume profile that only shows total volume, this indicator splits each price level into: Bull Volume (Buy Pressure) – estimated from bulli
Volume Profile is one of the most powerful analytical tools used by professional and institutional traders. Unlike traditional volume indicators that only show when trades occurred at the bottom of your screen, Volume Profile shows exactly at what price levels those trades happened. This gives you a clear, X-ray vision of the market structure, allowing you to see exactly where smart money and institutions are accumulating or distributing their positions. How Volume Profile Detects Institutional
Wapv Price and volume
Eduardo Da Costa Custodio Santos
The WAPV Price and Volume Indicator for MT5 is part of the ( Wyckoff Academy Wave Market ) and (Wyckoff Academy Price and Volume) toolset. The WAPV Price and Volume Indicator for MT5 was created to make it easy to visualize the volume movement on the chart in an intuitive way. With it you can observe the moments of peak volume and moments when the market has no professional interest Identify moments when the market is moving by inertia and not by movement of "smart money". It consists of 4 color
BoxChart MT5
Evgeny Shevtsov
5 (7)
The market is unfair if only because 10% of participants manage 90% of funds. An ordinary trader has slim changes to stand against these "vultures". This problem can be solved. You just need to be among these 10%, learn to predict their intentions and move with them. Volume is the only preemptive factor that faultlessly works on any timeframe and symbol. First, the volume appears and is accumulated, and only then the price moves. The price moves from one volume to another. Areas of volume accumu
Volume Profile For MT5
Abdelkhabir Yassine Alaoui
Volume Profile VPVR For MT5 Volume Profile VPVR is a powerful, high-performance MetaTrader 5 indicator designed to replicate the advanced  Volume Profile (Visible Range) directly on your chart. It provides deep insight into market structure by visualizing where trading activity is concentrated, helping traders identify key price levels with precision. This indicator dynamically analyzes volume distribution across price levels and renders a detailed histogram directly on the chart, allowing you
WAPV Box Effort x Result
Eduardo Da Costa Custodio Santos
WA_PV_BOX_EFFORT X RESULT for MT5 The WAPV Box Effort x Result Indicator is part of the Package Indicators group (Wyckoff Academy Wave Market). The WAPV Box Effort x Result Indicator for MT5 helps you in reading price and volume. Its reading consists of assisting in the identification of effort x result in waves created by the graph. The WAPV Box Effort x Result Indicator for MT5 when the box is green means that the volume is in favor of the demand and when the box is red volume is in favor of s
Buyers of this product also purchase
Trend Sniper X
Sarvarbek Abduvoxobov
4.9 (41)
Trend Sniper X is a multi-timeframe trend-following indicator for MetaTrader 5 that helps traders identify trend direction and potential reversal points with clarity and precision. for MT4: https://www.mql5.com/en/market/product/193245 Price Information: The current price is promotional and is subject to change as upcoming updates and new features are released. Bonus Offer: To get the FREE Auto-Trade Assistant EA for this indicator, please message the author after purchasing. Code2Profit Channe
Entry Points Pro 10 — the legend of the MQL5 Market. Three years in the Market's Top-3. 595 reviews across two versions. Over 31,000 demo downloads. Thousands of traders open their charts with it every morning. Built and traded by an author who has been in the market since 1999. Version 10 is the biggest rebuild in the indicator's history: I read every review from five years — and built the answers into the code. WHAT IT DOES It shows the entry point in advance — strictly without repainting. The
Neuro Poseidon MT5
Daria Rezueva
4.75 (52)
Neuro Poseidon is a new indicator by Daria Rezueva. It combines precise trading signals with adaptive TP/SL levels - creating best possible trades as a result! Message me and get  Neuro Poseidon Assistant  as a gift to automize your trading process! What makes it stand out? 1. Proven profitability on all assets and timeframes 2. Only confirmed BUY and SELL signals present on the chart 3. Adaptive TP & SL levels generated by the software for each trade 4. Easy to understand - suitable for al
Adaptive Price Action Engine Buy Indicator- Get EA Based on it for FREE. Self-Optimizing Multi-Timeframe Trend & Candlestick Intelligence Markets do not behave the same way all the time—and not every price-action pattern has the same value in every market regime. Adaptive Price Action Engine is designed to adapt to changing market conditions by combining trend structure, multi-timeframe analysis, candlestick patterns, and statistical optimization into one analytical framework. Two Adaptive Mode
Auto Optimized SpeedAngle is an institutional-grade momentum vectoring system that eliminates curve-fitting through continuous Walk-Forward Optimization (WFO). Rather than relying on static inputs that degrade when market regimes shift, the indicator dynamically recalibrates its parameters using Out-of-Sample (OOS) validation, ensuring the displayed signals represent genuine statistical edges rather than historical anomalies. By shifting the focus from subjective visual angles to normalized, qua
M1 Sniper MT5
Oleg Rodin
5 (7)
M1 SNIPER  is an easy to use trading indicator system. It is an arrow indicator which is designed for M1 time frame. The indicator can be used as a standalone system for scalping on M1 time frame and it can be used as a part of your existing trading system. Though this trading system was designed specifically for short-term trading, it still can be helpful for all traders. This trading system can be used with any forex pair and time frame, though lower time frames are recommended from M1 up to M
Gann Made Easy   is a professional and easy to use Forex trading system which is based on the best principles of trading using the theory of W.D. Gann. The indicator provides accurate BUY and SELL signals including Stop Loss and Take Profit levels. You can trade even on the go using PUSH notifications. PLEASE CONTACT ME AFTER PURCHASE TO GET TRADING  INSTRUCTIONS   AND GREAT EXTRA INDICATORS  FOR FREE! Probably you already heard about the Gann trading methods before. Usually the Gann theory is a
ARIPoint
Temirlan Kdyrkhan
1 (4)
ARIPoint is a powerful trading companion designed to generate high-probability entry signals with dynamic TP/SL/DP levels based on volatility. Built-in performance tracking shows win/loss stats, PP1/PP2 hits, and success rates all updated live. Key Features: Buy/Sell signals with adaptive volatility bands Real-time TP/SL/DP levels based on ATR Built-in MA Filter with optional ATR/StdDev volatility Performance stats panel (Success, Profit/Loss, PP1/PP2) Alerts via popup, sound, push, or email Cu
Scalper Vault   is a professional scalping system which provides you with everything you need for successful scalping. This indicator is a complete trading system which can be used by forex and binary options traders. The recommended time frame is M5. The system provides you with accurate arrow signals in the direction of the trend. It also provides you with top and bottom signals and Gann market levels. The indicator provides all types of alerts including PUSH notifications. PLEASE CONTACT ME A
Hi Trader, Most retail traders rely on lagging, web-based scripts. To trade with a true edge, you need institutional architecture. The Astro AI Indicator is not a standard chart overlay. It is a compiled, dual-agent neural network running directly on your terminal. Here is the exact technology driving the system: 1. Agent 1: The Analyst (Graph Neural Networks - GNN) Markets are not just isolated price bars; they are interconnected networks of data. The Function: Agent 1 utilizes a Graph Neural
Divergence Bomber
Ihor Otkydach
4.89 (94)
Each buyer of this indicator also receives the following for free: The custom utility "Bomber Utility", which automatically manages every trade, sets Stop Loss and Take Profit levels, and closes trades according to the rules of this strategy Set files for configuring the indicator for various assets Set files for configuring Bomber Utility in the following modes: "Minimum Risk", "Balanced Risk", and "Wait-and-See Strategy" A step-by-step video manual to help you quickly install, configure, and
Volatility Master for MetaTrader is a real-time dashboard tool that scans up to  50 symbols  to identify high-volatility , trending markets instantly. With bullish/bearish signals, customizable alerts, and a user-friendly interface, it helps you avoid range-bound conditions and focus on high-probability trades. Clarity leads to confidence. Trade confidently and protect your capital effectively with this powerful dashboard. We don't offer free or bonus indicators in exchange of reviews from you.
Quantum TrendPulse
Bogdan Ion Puscasu
5 (26)
Introducing Quantum TrendPulse , the ultimate trading tool that combines the power of SuperTrend , RSI , and Stochastic into one comprehensive indicator to maximize your trading potential. Designed for traders who seek precision and efficiency, this indicator helps you identify market trends, momentum shifts, and optimal entry and exit points with confidence. Key Features: SuperTrend Integration: Easily follow the prevailing market trend and ride the wave of profitability. RSI Precision: Detect
Introducing   Quantum Breakout PRO , the groundbreaking MQL5 Indicator that's transforming the way you trade Breakout Zones! Developed by a team of experienced traders with trading experience of over 13 years,   Quantum Breakout PRO   is designed to propel your trading journey to new heights with its innovative and dynamic breakout zone strategy. Quantum Breakout Indicator will give you signal arrows on breakout zones with 5 profit target zones and stop loss suggestion based on the breakout b
PainX GainX Blue Spike Fusion AI Advanced Synthetic Index Spike Detection Indicator for MetaTrader 5 Discover potential spike setups with a clear, organized, and professional trading interface. PainX GainX Blue Spike Fusion AI is a specialized indicator designed for traders who monitor synthetic indices and want a structured way to observe potential price spike opportunities. The indicator combines signal monitoring, market-condition analysis, visual alerts, and event tracking in one convenient
PZ Divergence Trading MT5
PZ TRADING SLU
3.71 (7)
Unlock hidden profits: accurate divergence trading for all markets Tricky to find and scarce in frequency, divergences are one of the most reliable trading scenarios. This indicator finds and scans for regular and hidden divergences automatically using your favourite oscillator. [ Installation Guide | Update Guide | Troubleshooting | FAQ | All Products  ] Easy to trade Finds regular and hidden divergences Supports many well known oscillators Implements trading signals based on breakouts Displays
RelicusRoad Pro MT5
Relicus LLC
4.96 (25)
Stop guessing your trades. Know when to enter, where to get out and which way the market leans, all on one chart. RelicusRoad Pro brings nearly twenty tools into one indicator, and you switch on the ones that fit the way you trade. Clear entries. Clear exits. A plan on every chart. Sound familiar? You buy, and price turns against you a minute later. You close too early, then watch the move carry on without you. Five indicators on the chart, five different answers. Your stop loss is a guess. Why
Quantum Direction is a professional trend-following indicator designed to identify market direction, detect early trend changes, and provide filtered entry and exit signals. This indicator includes the free Quantum Trade Assistant , a professional trade management tool available on the MQL5 Market. It can connect directly to Quantum Direction and automatically open trades when a valid signal appears or close trades when the configured exit conditions are met. Download the Free Quantum Trade Assi
OrderFlux – Orderflow Footprint Chart, Volume Profile & Market Profile Indicator for MetaTrader 5 OrderFlux is an order flow footprint indicator for MetaTrader 5 that explains itself. It opens the single candle and shows what happens inside it: the volume traded at every price level, split into aggressive buyers and aggressive sellers. From the ticks it builds a complete footprint chart in real time with delta, imbalance, absorption, volume profile, market profile (TPO), VWAP, cumulative delta (
M1 Quantum MT5
Hamed Dehgani
4.2 (10)
Live Trading Signals Using M1 Quantum : Signal  (Trade executed automatically by the Quantum Trade Assistant , included free with this product.) Latest News : Version 1.64 has been released, All trades now have a Stop Loss placed behind the relevant Support/Resistance zones. The Smart Close function has also been improved to increase the EA’s performance in this version. Since August 9, the live signal has been running on Version 1.64. Price Plan: Current Price: $169 (Early Adopter Offer) Next
CRT Pro is a complete Candle Range Theory toolkit for MetaTrader 5. It finds the CRT model on up to three timeframes and adds the tools needed to read it: higher-timeframe candles, structure shifts, fair value gaps, liquidity sweeps, a bias table and SSMT divergence. Every module can be switched on or off. 1. CRT Model A CRT model is built from two candles of the chosen CRT timeframe. C1 is the range candle. C2 is the sweep candle: it takes the high or the low of C1 and closes back inside the
Currency Strength Wizard   is a very powerful indicator that provides you with all-in-one solution for successful trading. The indicator calculates the power of this or that forex pair using the data of all currencies on multiple time frames. This data is represented in a form of easy to use currency index and currency power lines which you can use to see the power of this or that currency. All you need is attach the indicator to the chart you want to trade and the indicator will show you real s

ICT PO3 (Power of 3) AMD Protocol Framework Indicator True Time & Structure Integration   |  Non-Repainting | Real-Time  | Multi-Asset  | MT4 Version Available Full Setup Guide & Strategy Playbook: https://www.mql5.com/en/blogs/post/768683 The ICT Power of Three (PO3): The Complete Guide to Accumulation, Manipulation, and Distribution https://www.mql5.com/en/blogs/post/771729 MT4 Version: https://www.mql5.com/en/market/product/171742 Indicator Overview The ICT PO3 AMD Protocol Framework i
Bill Williams Advanced
Siarhei Vashchylka
5 (11)
Bill Williams Advanced is designed for automatic chart analysis using Bill Williams' "Profitunity" system. The indicator analyzes four timeframes at once. Manual (Be sure to read before purchasing) Advantages 1. Analyzes the chart using Bill Williams' "Profitunity" system. Signals are displayed in a table in the corner of the screen and on the price chart. 2. Finds all known AO and AC signals, as well as zone signals. Equipped with a trend filter based on the Alligator. 3. Finds "Divergence Bar
Advanced Supply Demand MT5
Bernhard Schweigert
4.53 (15)
Best Solution for any Newbie or Expert Trader! This indicator is a unique, high quality and affordable trading tool because we have incorporated a number of proprietary features and a new formula. With this update, you will be able to show double timeframe zones. You will not only be able to show a higher TF but to show both, the chart TF, PLUS the higher TF: SHOWING NESTED ZONES. All Supply Demand traders will love it. :) Important Information Revealed Maximize the potential of Advanced Supply
Superhero
Ihor Otkydach
5 (3)
The SUPERHERO indicator is a multi-currency trading system designed on an "all-inclusive" basis. The indicator independently analyzes the market and provides signals on when to open and close trades. It uses Stop Loss and Take Profit orders. The R:R ratio is 1:1. This system can send push notifications to your smartphone, so you can place trades "on the go" without needing to be tied to a PC. It's perfect for proprietary trading firms. A BONUS FOR EVERY CUSTOMER: Every buyer of this indicator wi
CGE Trading Suite
Carl Gustav Johan Ekstrom
5 (2)
Institutional-Grade Analytics for MT5 The full analytical edge of a professional trading desk, built into your MT5 chart. Standard retail platforms lack the depth required for professional market analysis. The CGE Trading Suite bridges this gap, transforming MetaTrader 5 into a comprehensive workspace. By integrating 22 proprietary modules into a single, unified chart interface, the suite eliminates fragmented analysis. It provides definitive clarity across market structure, timing, momentum,
SkyHammer Signal Pro Professional No-Repaint Trend Signal Indicator with Locked Entry, SL and TP Levels SkyHammer Signal Pro is a structured trend and momentum signal indicator designed for traders who want clear, fixed, and verifiable trading signals. It works best on lower timeframes such as M1 and M5 . The indicator does not try to predict tops or bottoms. Instead, it waits for confirmed market structure, trend direction, momentum strength, volatility quality, and target space before generati
Manzano Footprint Order Flow
Patricia Manzano Gomez
5 (1)
MANZANO FOOTPRINT ORDER FLOW Footprint, Order Flow and Volume Analysis for MetaTrader 5 Manzano Footprint Order Flow is an analytical indicator for MetaTrader 5 that brings together Footprint charts, Bid x Ask, Delta, Cumulative Delta (CVD), Imbalances, Volume Profile, VWAP, Market Depth and Time & Sales in an interactive environment. It allows traders to examine activity within individual candles, identify volume concentrations, compare buying and selling pressure, and analyse how market partic
Azimuth Pro
Ottaviano De Cicco
5 (7)
Azimuth Pro V2: Synthetic Fractal Structure and Confirmed Entries for MT5 Overview Azimuth Pro is a multi-level swing structure indicator by Merkava Labs . Four nested swing layers, swing-anchored VWAP, ABC pattern detection, three-timeframe structural filtering, and closed-bar confirmed entries — one chart, one workflow from micro-swings to macro-cycles. This is not a blind signal product. It is a structure-first workflow for traders who care about location, context, and timing. ️ Summer Sale
Filter:
No reviews
Reply to review