Super Multi Indicator
- Indicators
- Version: 1.10
- Activations: 10

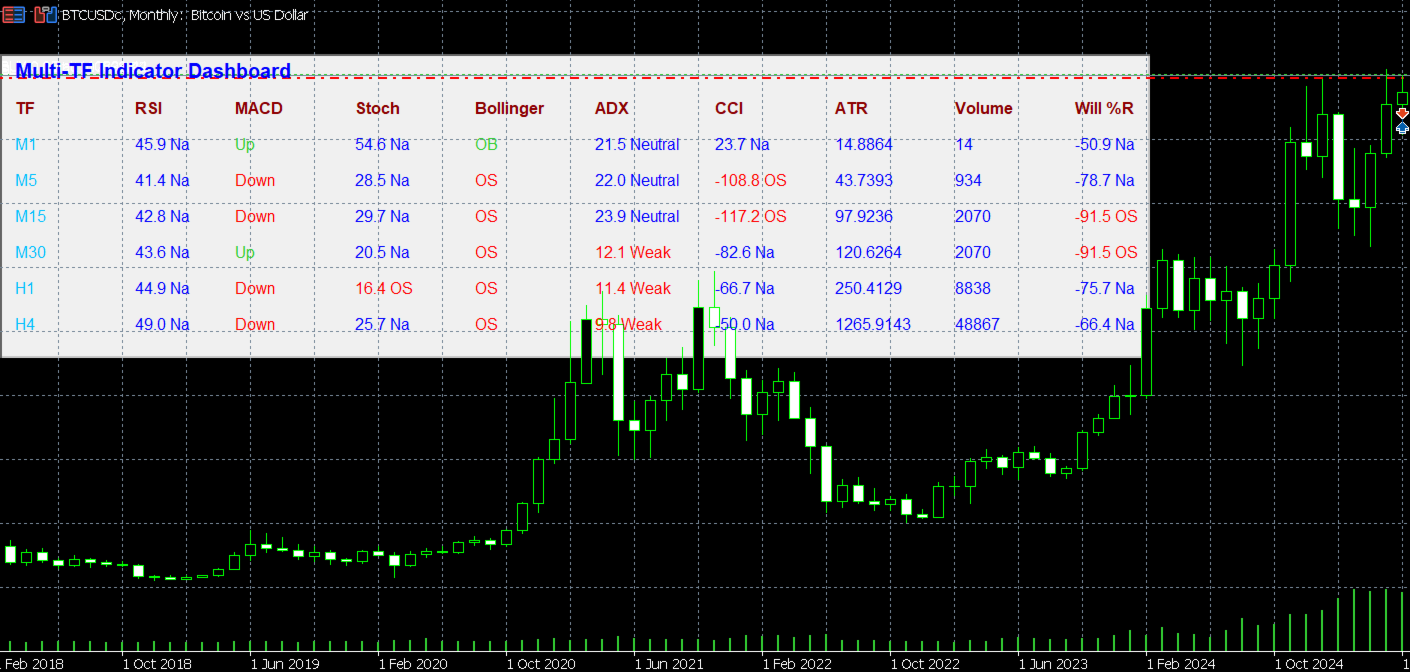
Indicator Name: Multi-TF Indicator Dashboard
Version: 1.10
Type: Multi-Timeframe Indicator Dashboard
1. Indicators Included in the Dashboard
This Dashboard Indicator integrates 8 key indicators:
-
RSI (Relative Strength Index)
-
Measures the strength of price movements
-
Displays Overbought (>70), Oversold (<30), and Neutral
-
-
MACD (Moving Average Convergence Divergence)
-
Analyzes trend direction and potential reversal points
-
Shows signals as Up / Down
-
-
Stochastic Oscillator
-
Identifies overbought or oversold market conditions
-
Displays OB (>80), OS (<20), Neutral
-
-
Bollinger Bands
-
Measures price volatility
-
Price at Upper Band = OB, Lower Band = OS
-
-
ADX (Average Directional Index)
-
Measures trend strength
-
Displays Strong / Good / Neutral / Weak
-
-
CCI (Commodity Channel Index)
-
Identifies overbought or oversold conditions
-
Shows OB (>100) / OS (<-100) / Neutral
-
-
ATR (Average True Range)
-
Measures market volatility
-
Displays ATR values and flags Low Volatility when below threshold
-
-
Williams %R
-
Shows short-term overbought or oversold levels
-
Displays OB / OS / Neutral
-
-
Volume
-
Displays trading volume for the current candle
-
2. How to Use
-
Install the .ex5 file in MT5
-
Open MT5 → File → Open Data Folder → MQL5 → Indicators → Paste the file
-
-
Attach the Indicator to a Chart
-
Open a chart of currency pairs, metals, Bitcoin, or cryptocurrencies → Drag the Indicator from Navigator to the chart
-
-
Customize Parameters (Options)
-
RSI Period, ADX Period, CCI Period, ATR Period, Williams %R Period
-
Select Timeframes such as M1, M5, M15, M30, H1, H4
-
-
Read the Dashboard
-
Top row: indicator headers
-
Following rows: values per Timeframe
-
3. Key Features
-
Multi-Timeframe View: See signals for multiple Timeframes simultaneously
-
Easy to Use: Dashboard format without adding multiple indicators manually
-
Asset Flexibility: Works with Forex pairs, metals, Bitcoin, and other cryptocurrencies
-
Clear Visual Cues: Displays Overbought/Oversold, trend strength, Low Volatility with colors
-
Customizable: Dashboard size, colors, fonts, and Timeframes
4. Recommendations
-
Use alongside trend analysis, support/resistance, or other trading techniques to confirm signals
-
This Dashboard does not open or close trades automatically – it is for analysis only
-
Test on a Demo account before using on a live account
5. Why Use the Multi-TF Dashboard Indicator
-
See Multiple Timeframes at Once
-
No need to open multiple charts for signals
-
Saves time and reduces confusion
-
-
All Key Indicators in One Place
-
RSI, MACD, Stochastic, Bollinger, ADX, CCI, ATR, Williams %R, Volume
-
No need to manually combine indicators
-
-
Works with All Asset Classes
-
Forex pairs, metals, Bitcoin, and cryptocurrencies
-
Flexible for volatile markets
-
-
Clear and Easy-to-Read Dashboard
-
Color codes indicate Overbought/Oversold, trend strength, Low Volatility
-
Facilitates quick decision-making
-
-
Highly Customizable
-
Select Timeframes, colors, Dashboard size, and font
-
Tailor to your trading style
-
-
Helps Trading Planning
-
OB/OS signals, trend strength, Low Volatility alerts
-
Can be combined with other techniques like Support/Resistance, Trendline, or Price Action
-
-
Reduces Analysis Errors
-
Consolidates important information in one screen → reduces missed signals
-
-
Suitable for Beginners and Professionals
-
Beginners can clearly see the market overview
-
Professionals can use it as an analytical tool to support decision-making
-