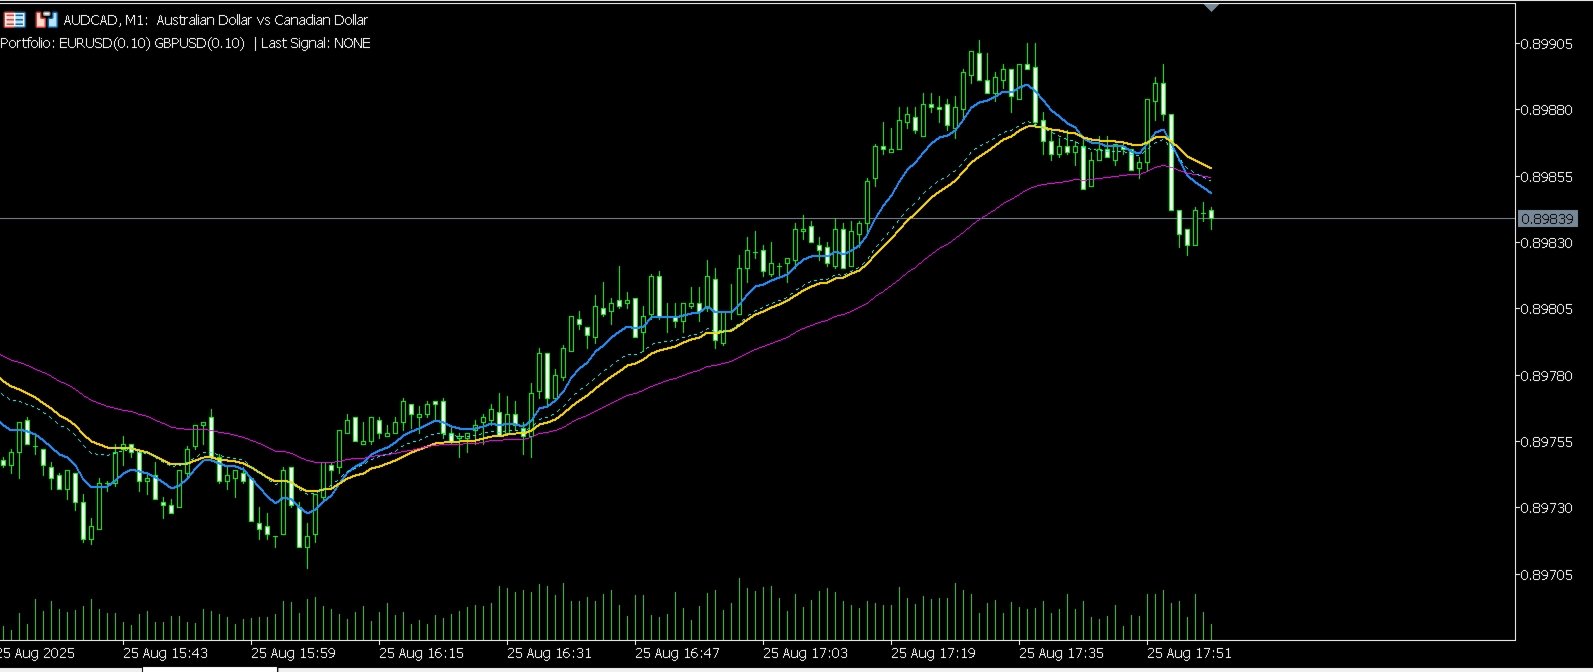
Visual Portfolio Analyzer Indicator
- Indicators
- AL MOOSAWI ABDULLAH JAFFER BAQER
- Version: 1.0
- Activations: 5
Visual Portfolio Analyzer: Trade Your Portfolio, Not Just a Pair
Unlock a new dimension of market analysis with the Visual Portfolio Analyzer, the ultimate tool for traders who think in terms of a complete portfolio. Stop making isolated decisions on single currency pairs and start trading with a holistic view of your combined positions. This indicator is meticulously designed to filter out market noise and provide clear, high-probability signals based on the collective momentum of your chosen assets.
For just $30, you are not just buying another moving average crossover indicator; you are investing in a sophisticated decision-support system that could fundamentally change the way you approach the markets.
The Core Logic: How It Works
The Visual Portfolio Analyzer generates its powerful signals through a multi-layered confirmation process, ensuring you only act on the most robust market movements.
1. The Foundation: Triple Moving Average Crossover
The system starts with a classic yet powerful foundation: a triple moving average system.
-
Fast MA: Reacts quickly to price changes, identifying potential new moves.
-
Medium MA: Confirms the initial momentum, acting as the primary trigger.
-
Slow MA: Defines the overall long-term trend, serving as a master filter.
A buy signal is considered only when the Fast MA crosses above the Medium MA, and both are above the Slow MA, indicating a strong bullish consensus. A sell signal requires the opposite: the Fast MA must cross below the Medium MA, with both positioned below the Slow MA.
2. The Confirmation: Multi-Asset Momentum Engine
This is what sets the Visual Portfolio Analyzer apart from thousands of other indicators. Instead of just looking at the current chart, the indicator analyzes the performance of your entire defined portfolio (up to 3 symbols with custom lot sizes).
Before a signal is confirmed, the indicator calculates the weighted percentage change of all specified assets over the previous bar. A buy signal will only be displayed if the overall portfolio momentum is positive, meaning your combined assets are gaining value. A sell signal will only appear if the portfolio momentum is negative. This unique feature provides an unparalleled layer of confirmation, effectively filtering out false signals that might occur on a single pair while the rest of your portfolio is moving in the opposite direction.
3. The Trigger: Adjustable Signal Sensitivity
You have complete control over the strictness of the signal generation. The "Signal Sensitivity" input allows you to choose how the MA crossover and portfolio momentum conditions are combined:
-
High Sensitivity (Conservative): Requires a perfect alignment of the MA crossover, trend direction, and portfolio momentum. This setting provides the fewest, but highest-probability, signals.
-
Medium Sensitivity (Balanced): Requires the core MA crossover and confirmation from either the trend or the portfolio momentum. A balanced approach for most trading styles.
-
Low Sensitivity (Aggressive): Generates a signal on a valid MA crossover as long as there isn't strong conflicting information from the other filters. This allows for more frequent signals in active markets.
Key Features
-
Multi-Symbol Portfolio Analysis: Monitor the combined strength of up to three financial instruments in real-time.
-
High-Probability Signals: Advanced filtering logic combines moving averages and portfolio momentum to reduce false breakouts and whipsaws.
-
Fully Customizable: Adjust every parameter, from MA periods and methods to signal sensitivity, colors, and arrow sizes.
-
Built-in Signal Control: A "Minimum Bars Between Signals" setting prevents over-trading by ensuring signals are well-spaced.
-
Clear Visual Display: Non-repainting buy and sell arrows are plotted directly on your chart, along with the moving averages and an optional portfolio trend line.
-
Detailed Information Panel: See the current portfolio composition and the last generated signal directly in the corner of your chart.
Who Is This For?
The Visual Portfolio Analyzer is the perfect tool for:
-
Forex Traders: Analyze correlations and trade baskets of currencies (e.g., USD strength/weakness) instead of single pairs.
-
Swing Traders: Identify strong, confirmed trend entries and exits across multiple assets.
-
Portfolio Managers: Generate rebalancing signals and manage risk by understanding the collective movement of your holdings.
-
Discretionary Traders: Add a powerful, data-driven confirmation tool to your existing trading strategy.
Take the next step in your trading evolution. Add the Visual Portfolio Analyzer to your chart and start making smarter, portfolio-driven decisions today.