GEN Quantum Divergence
- Indicators
- Gede Egi Narditya
- Version: 1.0
- Activations: 5
INDICATOR: GEN Quantum Divergence
Developer: gedeegi
General Description
GEN Quantum Divergence is an advanced technical indicator designed to automatically detect divergence signals. Unlike typical divergence indicators that use standard oscillators, GEN Quantum Divergence utilizes a unique RSI of Momentum calculation, making it highly sensitive to upcoming changes in trend strength.
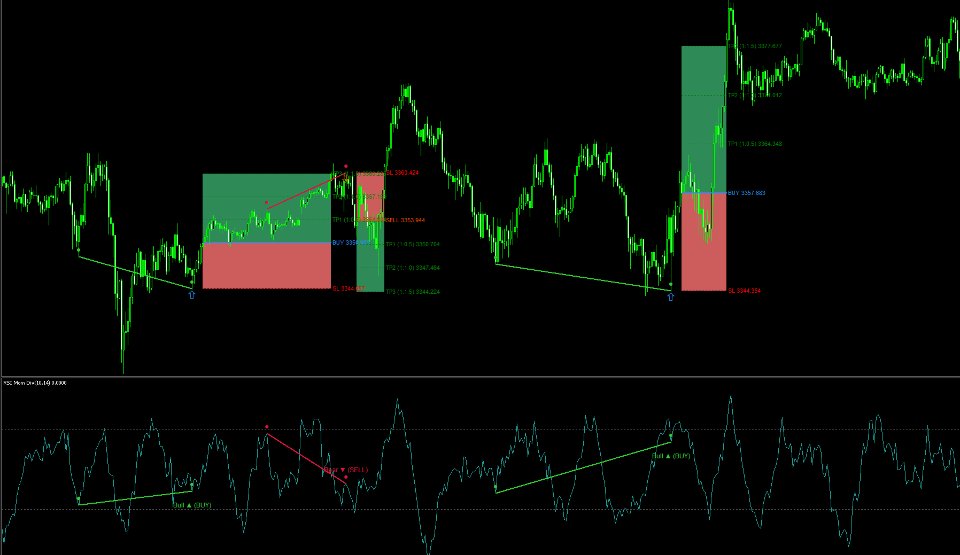
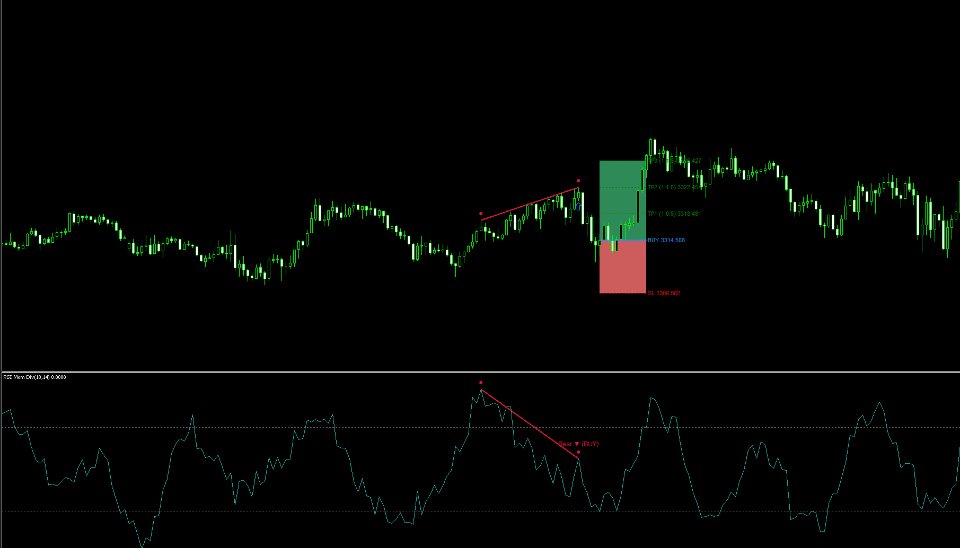
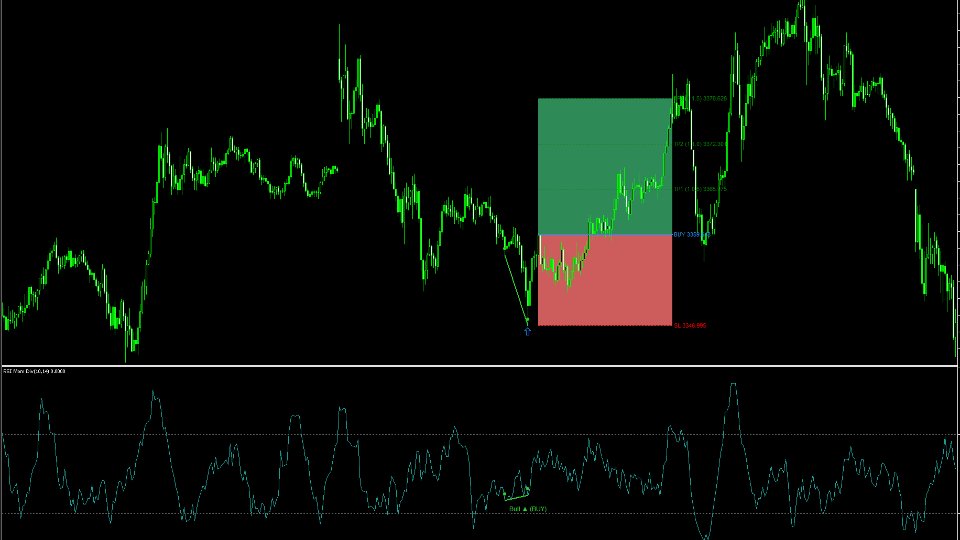
This indicator not only identifies and displays bearish and bullish divergence formations on the chart but also provides a complete trading framework. It automatically projects Entry, Stop Loss (SL), and three Take Profit (TP) levels, as well as visualizing the Risk:Reward (R:R) Zone directly on the chart. This feature makes it a powerful tool for trade planning, execution, and risk management.
Key Features
- Automatic detection of Bullish & Bearish Divergence using price and oscillator pivot points.
- Utilizes a custom RSI of Momentum oscillator for higher signal sensitivity.
- Flexible signal logic: can be set for Counter-Trend (standard logic) or Trend-Following (inverted logic) trading.
- Complete visualization: divergence trend lines, signal arrows on the main chart, labels in the indicator window, and pivot point markers.
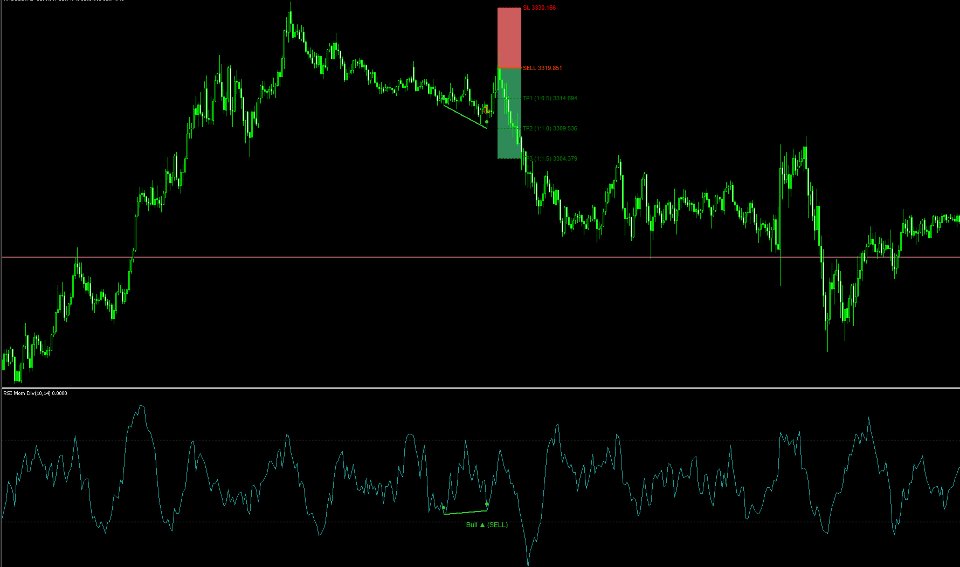
- Automatic calculation and visualization of Entry, SL, and three TP targets based on adjustable R:R ratios.
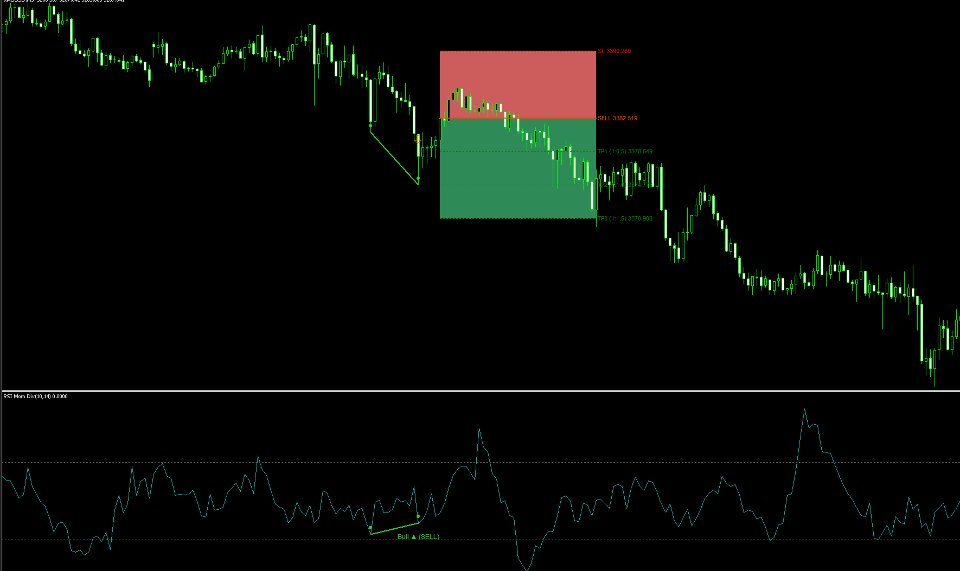
- Visual display of Risk and Reward Zones as colored areas for quick R:R analysis.
- Comprehensive real-time notification system (Pop-up Alert, Push Notification, and Email).
- Highly flexible visual settings for all elements (colors, line styles, opacity).
Input Parameters
Main Indicator Settings
- MomPeriod: Period for the Momentum calculation.
- RSIPeriod: Period for the RSI calculation applied to the Momentum data.
Divergence Detection Settings
- EnableDivergence: Enable/disable all divergence detection features.
- InvertSignalLogic: Inverts the signal logic. false for reversal trading (counter-trend), true for continuation trading (trend-following).
- PivotLookbackL/R: Number of confirmation bars on the left and right side to validate a pivot point.
- Min/MaxBarsBetweenPivots: Minimum and maximum number of bars between two pivots to be considered a valid divergence signal.
Main Visual Settings
- BullishColor/BearishColor: Color for bullish/bearish divergence lines and signals.
- DivLineStyle/DivLineWidth: Style and width of the divergence trend lines.
- EnablePriceArrows: Display signal arrows on the main chart.
- EnableIndicatorLabels: Display 'Bull'/'Bear' labels in the indicator window.
- EnablePivotMarkers: Display circular markers at each pivot point.
Risk:Reward Zone Visual Settings
- EnableRR_Zones: Display visual areas for Risk and Reward zones.
- ZoneOpacity: Opacity level (0-255) for the R:R zones.
- RiskZoneColor/RewardZoneColor: Background color for the Risk (Entry to SL) and Reward (Entry to TP) zones.
Signal Levels & SL/TP Settings
- EnableSignalLines/EnableSLTPLines: Display horizontal lines for Entry, SL, and TP levels.
- RR_TP1/RR_TP2/RR_TP3: Take Profit ratio calculated relative to the risk range (distance from Entry to SL).
- BuySignalColor/SellSignalColor/SLColor/TPColor: Color settings for each level line.
Signal Notification Settings
- EnableAlerts/EnablePushNotifications/EnableEmailAlerts: Enable various types of notifications when a new signal appears.
Signal Logic
- The indicator calculates the RSI value from the price Momentum data, creating a responsive oscillator.
- The indicator identifies pivot points (peaks and troughs) on both the price chart and the oscillator line.
- Sell Signal (Bearish Divergence): Confirmed when the price forms a higher high, while the oscillator forms a lower high. This indicates weakening bullish momentum and a potential reversal downwards.
- Buy Signal (Bullish Divergence): Confirmed when the price forms a lower low, while the oscillator forms a higher low. This indicates weakening bearish momentum and a potential reversal upwards.
- Inverted Logic (InvertSignalLogic): When enabled, the signal is reversed. A Bearish Divergence will generate a BUY signal, and a Bullish Divergence will generate a SELL signal. This mode is useful for trend-following strategies (e.g., entering on a pullback that shows weakening corrective momentum).
- Once a signal is confirmed, the indicator automatically calculates and displays the Entry, SL (based on the last pivot price), and 3 TP levels (based on the R:R ratio).
Usage
- Detecting high-probability reversal opportunities at the end of a trend.
- Identifying trend-continuation entry points (pullbacks/retracements) using the InvertSignalLogic feature.
- Assisting in objective trade planning with clearly defined Entry, SL, and TP levels.
- Speeding up the analysis of the risk-to-reward ratio through automatically drawn visual zones.


