New Murrey Math Levels Indicator MT4
- Indicators
- Eda Kaya
- Version: 1.5
New Murrey Math Levels Indicator on MetaTrader 4
The New Murrey Math Levels Indicator applies a mathematical model to outline precise horizontal levels that represent balance points within market pricing on the MetaTrader 4 platform. These plotted levels range from +2/8 down to -2/8, each carrying a specific function within the market framework.
Acting as adaptive zones, they often serve as potential turning points, active support/resistance lines, or indicators of overbought and oversold market states. This systematic arrangement assists traders in pinpointing optimal entry and exits zones with greater precision.
«Indicator Installation & User Guide»
MT4 Indicator Installation | New Murrey Math Levels Indicator MT5 | ALL Products By TradingFinderLab | Best MT4 Indicator: Refined Order Block Indicator for MT4 | Best MT4 Utility: Trade Assistant Expert TF MT4 | TP & SL Tool: Risk Reward Ratio Calculator RRR MT4 | Prop Firm Protector: Prop Draw Down Protector Expert Advisor MT4 | Money Management: Easy Trade Manager MT4
New Murrey Math Levels Indicator Table
| Category | Support and Resistance – Trading Tool – Levels |
| Platform | MetaTrader 4 |
| Skill Level | Intermediate |
| Indicator Type | Breakout – Reversal |
| Timeframe | Multi timeframe |
| Trading Style | Intraday Trading |
| Trading Market | All Markets |
Overview of the New Murrey Math Levels Indicator
By mapping 13 strategically significant price levels, the Murrey Math methodology offers a structured lens for interpreting price movement in relation to market balance. Each level influences potential continuation or reversal depending on its location, with key examples including:
- Level 4/8: The market's midpoint zone, often a pivot area where price consolidates or reverses.
- Levels 8/8 and 0/8: Representing extreme overbought (8/8) and oversold (0/8) territories, frequently associated with strong reversal potential.
- Levels +2/8 and -2/8: Zones beyond typical volatility limits, where breakouts demand strong momentum and confirmed trading volume.
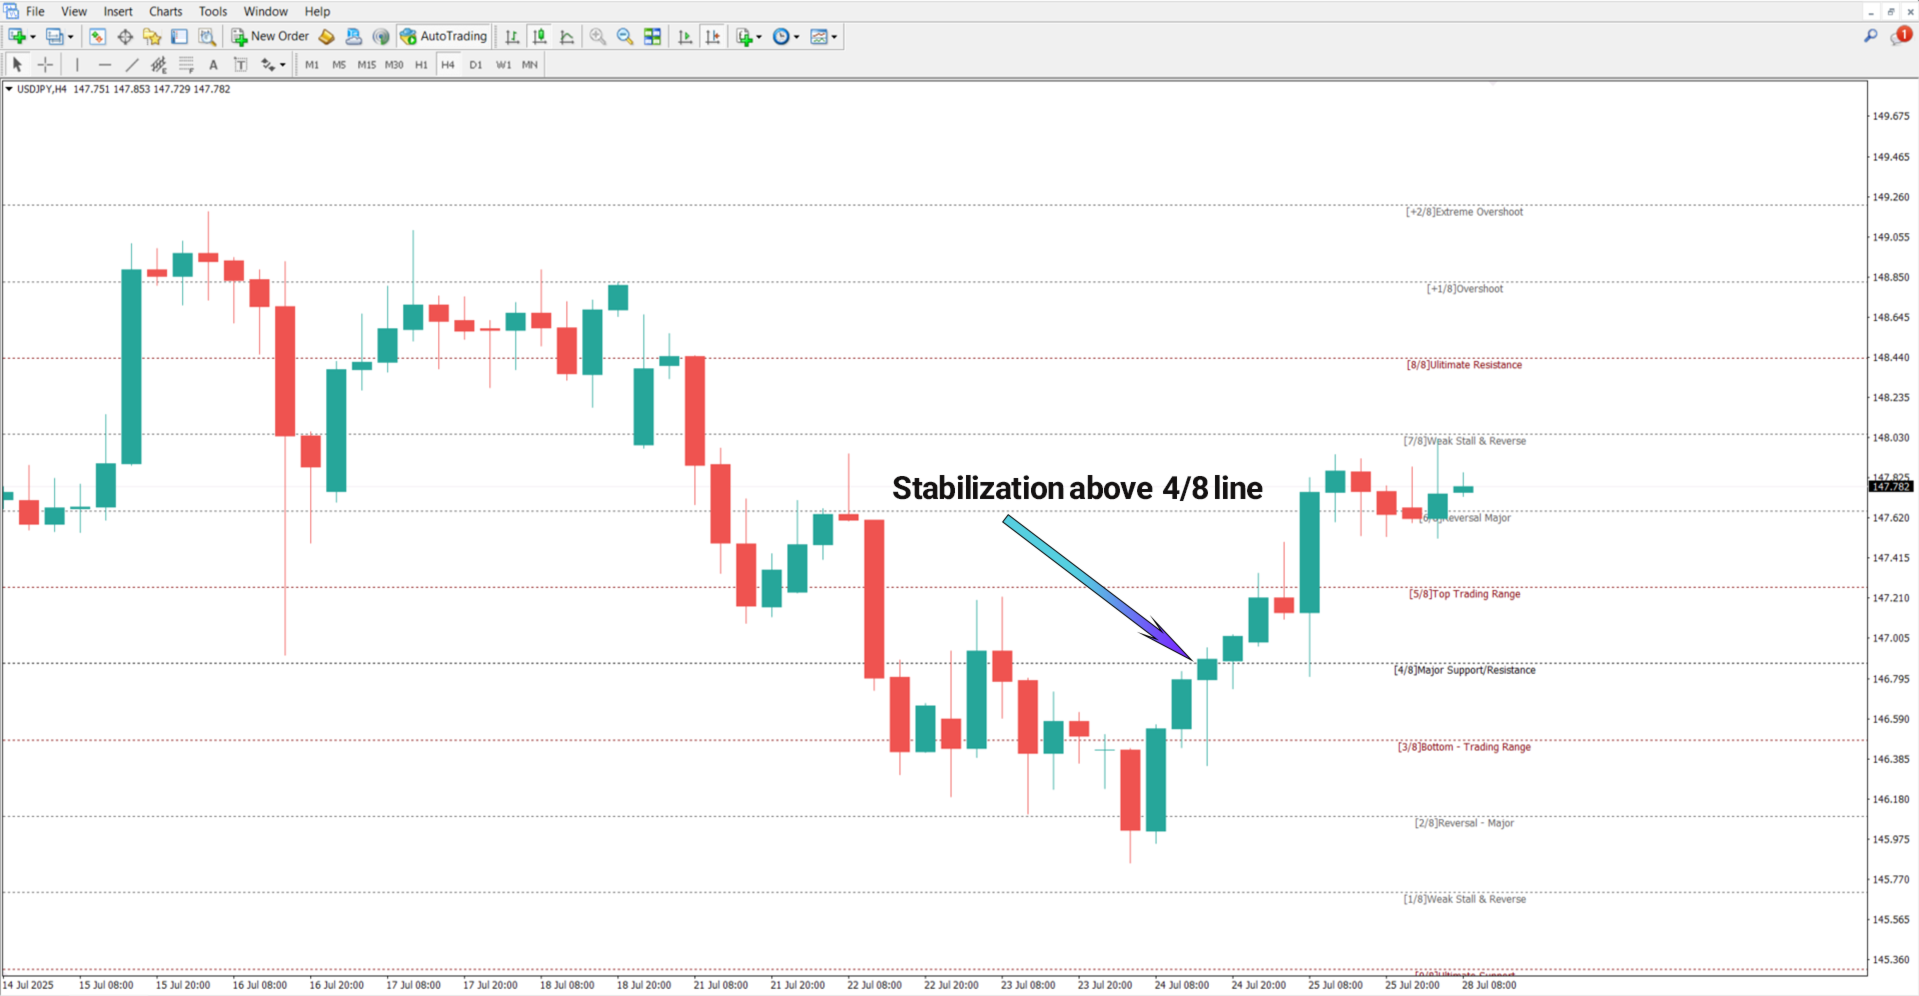
Indicator in an Uptrend
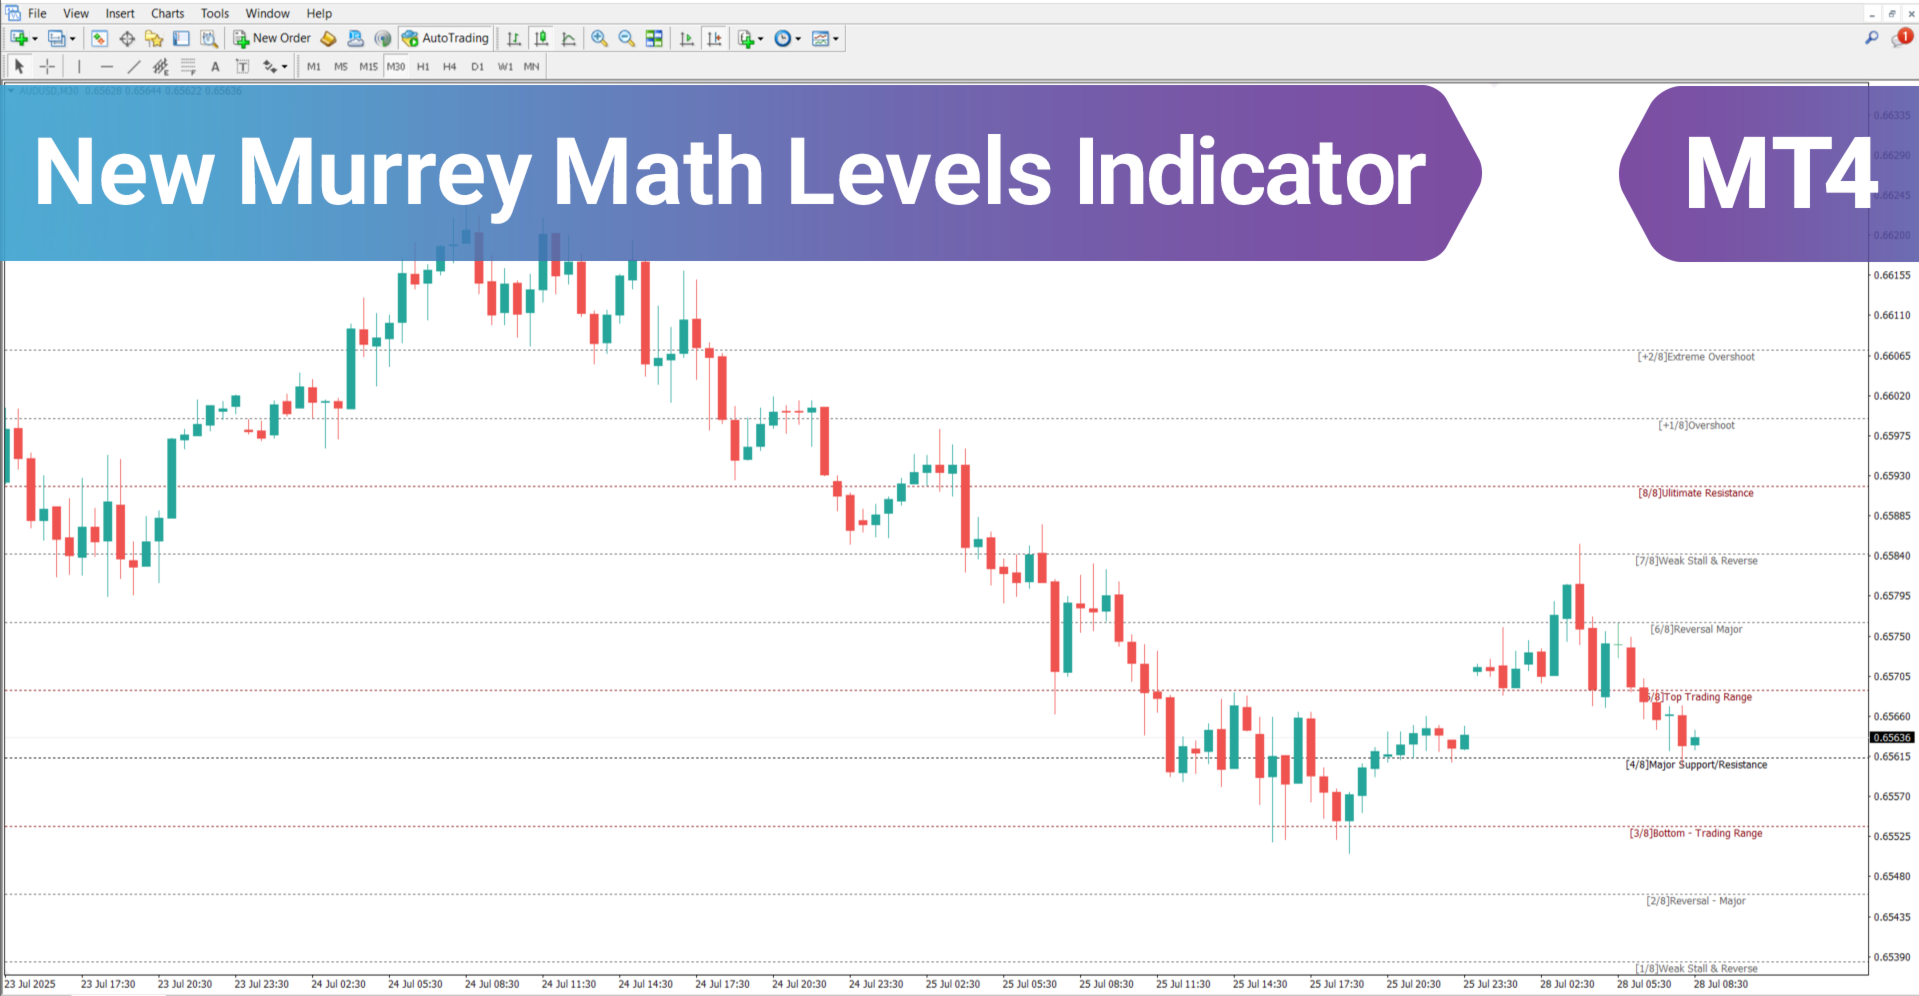
In the 4-hour chart of the USD/JPY pair, a bullish formation above the 4/8 level can signal a healthy equilibrium favoring buyers. In such conditions, upward momentum may push toward higher targets like 6/8 and eventually 8/8.
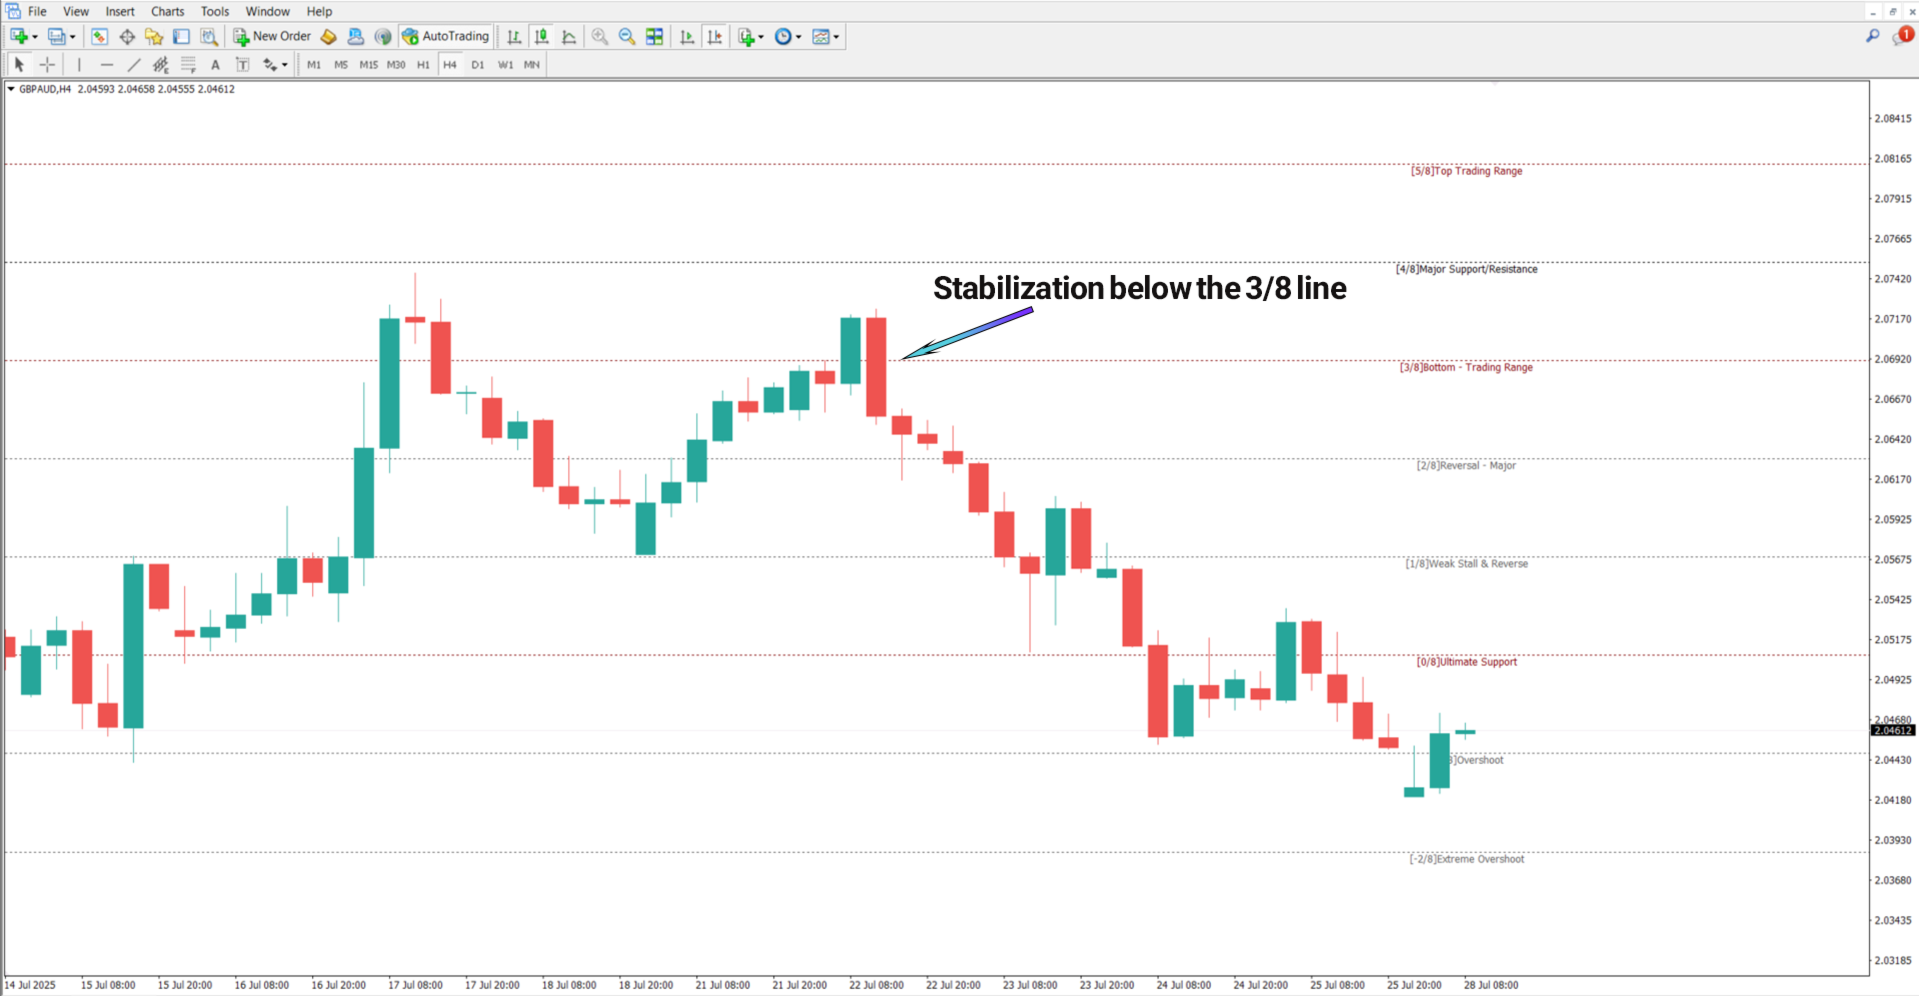
Indicator in a Downtrend
The GBP/AUD 4-hour chart demonstrates that when price drops below the 3/8 level and holds there, sellers maintain control. This scenario often leads to moves toward 2/8 and possibly 0/8, with the 2/8 level acting as a decision point for trend continuation or reversal.
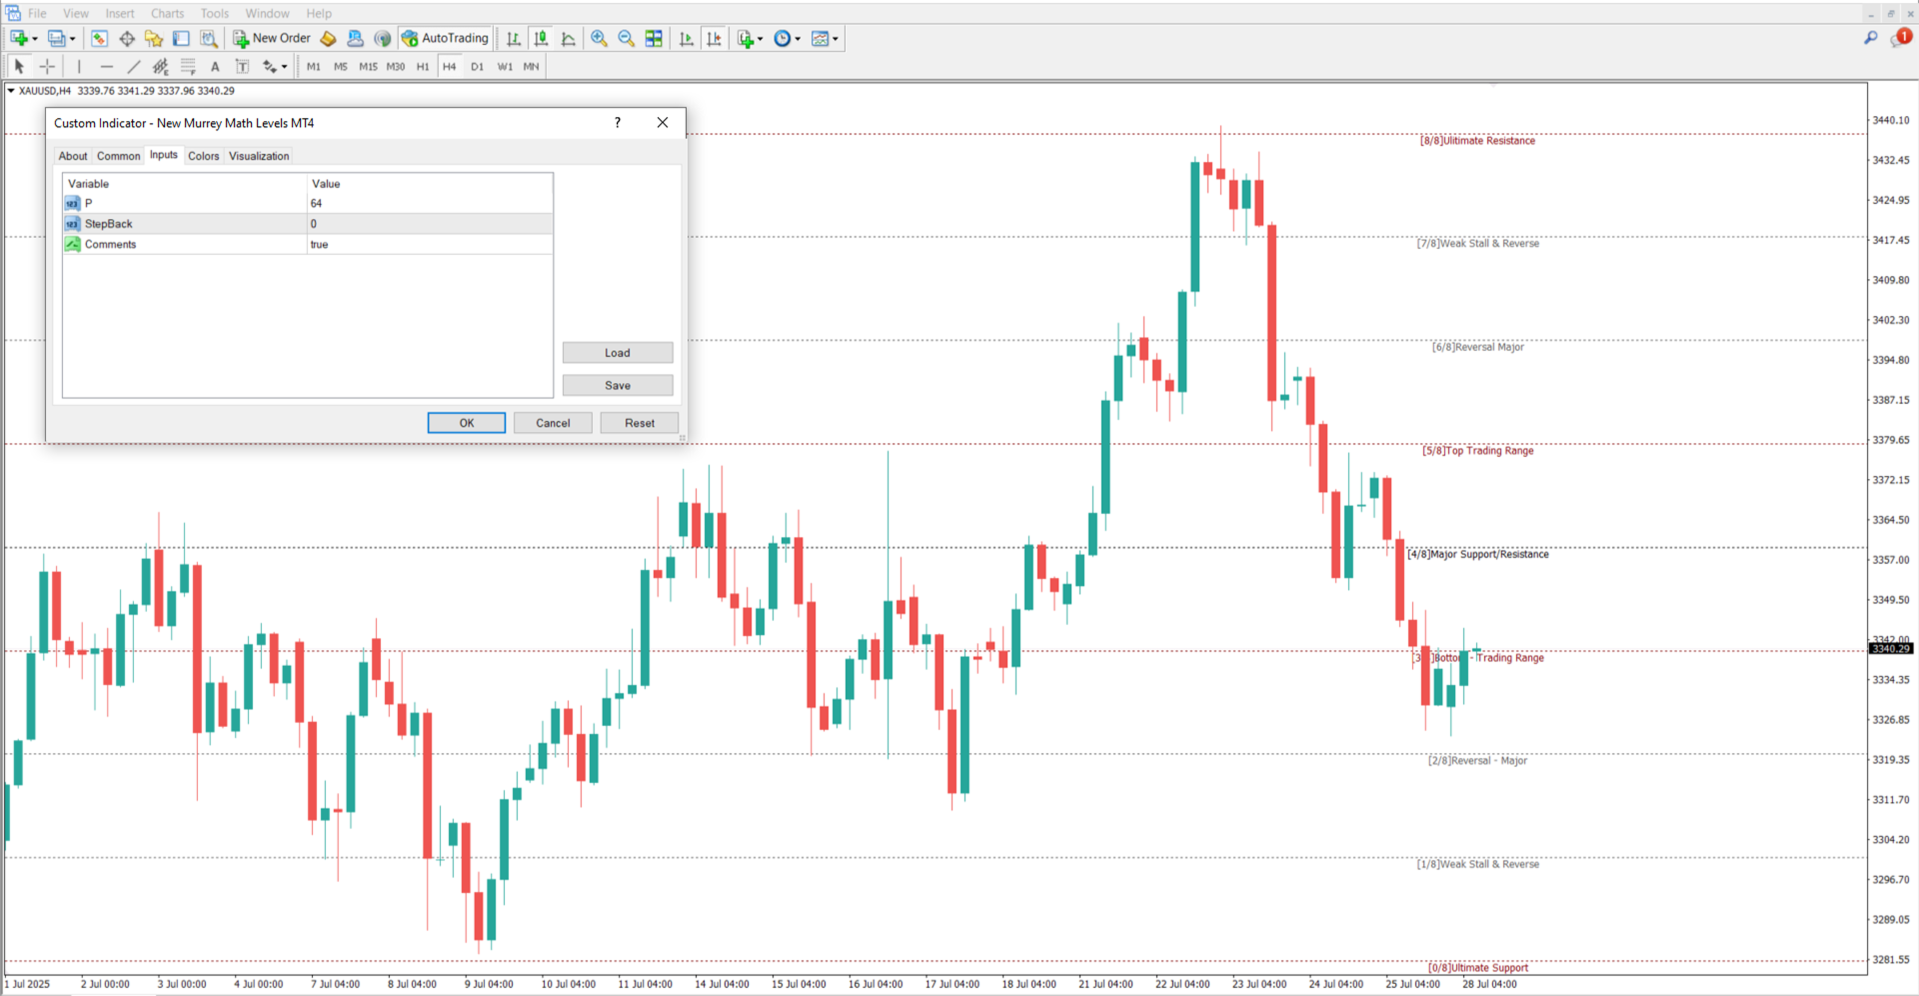
New Murrey Math Levels Indicator Settings
- P: Core parameter for calculation.
- StepBack: Defines how many bars back the analysis extends.
- Comments: Option to show explanatory notes on the chart.
Conclusion
The New Murrey Math Levels Indicator delivers a systematic approach to mapping support, resistance, and probable turning zones via fixed numerical thresholds. Midpoint levels like 4/8 indicate balance, while extremes at 0/8 and 8/8 are common technical reversal points.
Observing price reactions around these boundaries in the context of momentum and market structure can help identify high-probability trading opportunities.