Integrated Dashboard Scanner

Integrated Dashboard Scanner – Your Market Command Center (v3.0)

Short Description

Stop wasting time manually switching between dozens of charts. The Integrated Dashboard Scanner is a powerful multi-symbol, multi-timeframe scanner that keeps an eye on every instrument you select from a single panel. Featuring six distinct analysis modules, including an Economic News Calendar and a professional-grade Momentum Scanner, version 3.0 is the most powerful and reliable release yet. Following a major architectural overhaul, the scanner delivers unmatched performance and a flawless user experience on any monitor. Receive instant visual alerts for price patterns, divergences, and market-moving events, then jump to the relevant chart with a single click.

Key Features

  • Time-saving: One panel covers the whole market—no more manual chart switching.

  • Comprehensive analysis: Six fully-configurable scanning modules, including an Economic News Calendar and Momentum Scanner.

  • Unmatched Stability & Performance: The data sync engine has been rebuilt from the ground up. The indicator now proactively requests historical data, leading to significantly faster initialization. The per-cell architecture means a single problematic data feed will never freeze or slow down the dashboard.

  • DPI-Aware Interface (New in v3.0): The dashboard is now fully DPI-aware. It automatically detects your Windows display scaling and perfectly adjusts the entire UI, ensuring a crisp, correctly proportioned display on high-resolution monitors (e.g., 4K).

  • Instant reaction: One click switches the target chart to the correct symbol and timeframe.

  • Full customization: Adjust symbols, indicator parameters, panel style, and alert channels.

  • Rock-Solid Stability: Each dashboard instance runs with a unique ID, eliminating conflicts when using multiple scanners on the same terminal.

  • Intelligent Performance & Auto-Recovery: The scanner uses an asynchronous-style, per-cell data initialization. If a cell fails to sync, it simply waits and will automatically recover and resume scanning once data is available, without requiring a manual reload.

  • Well-tested for large-scale monitoring: Proven in real-time with 32 symbols × 12 timeframes (384 charts) and supports even more instruments and timeframes depending on your setup.

  • Live & Strategy Tester ready: Works smoothly in both environments.

  • Advanced alerts: Supports on-screen, push, and e-mail notifications; signals are automatically consolidated to avoid spam.

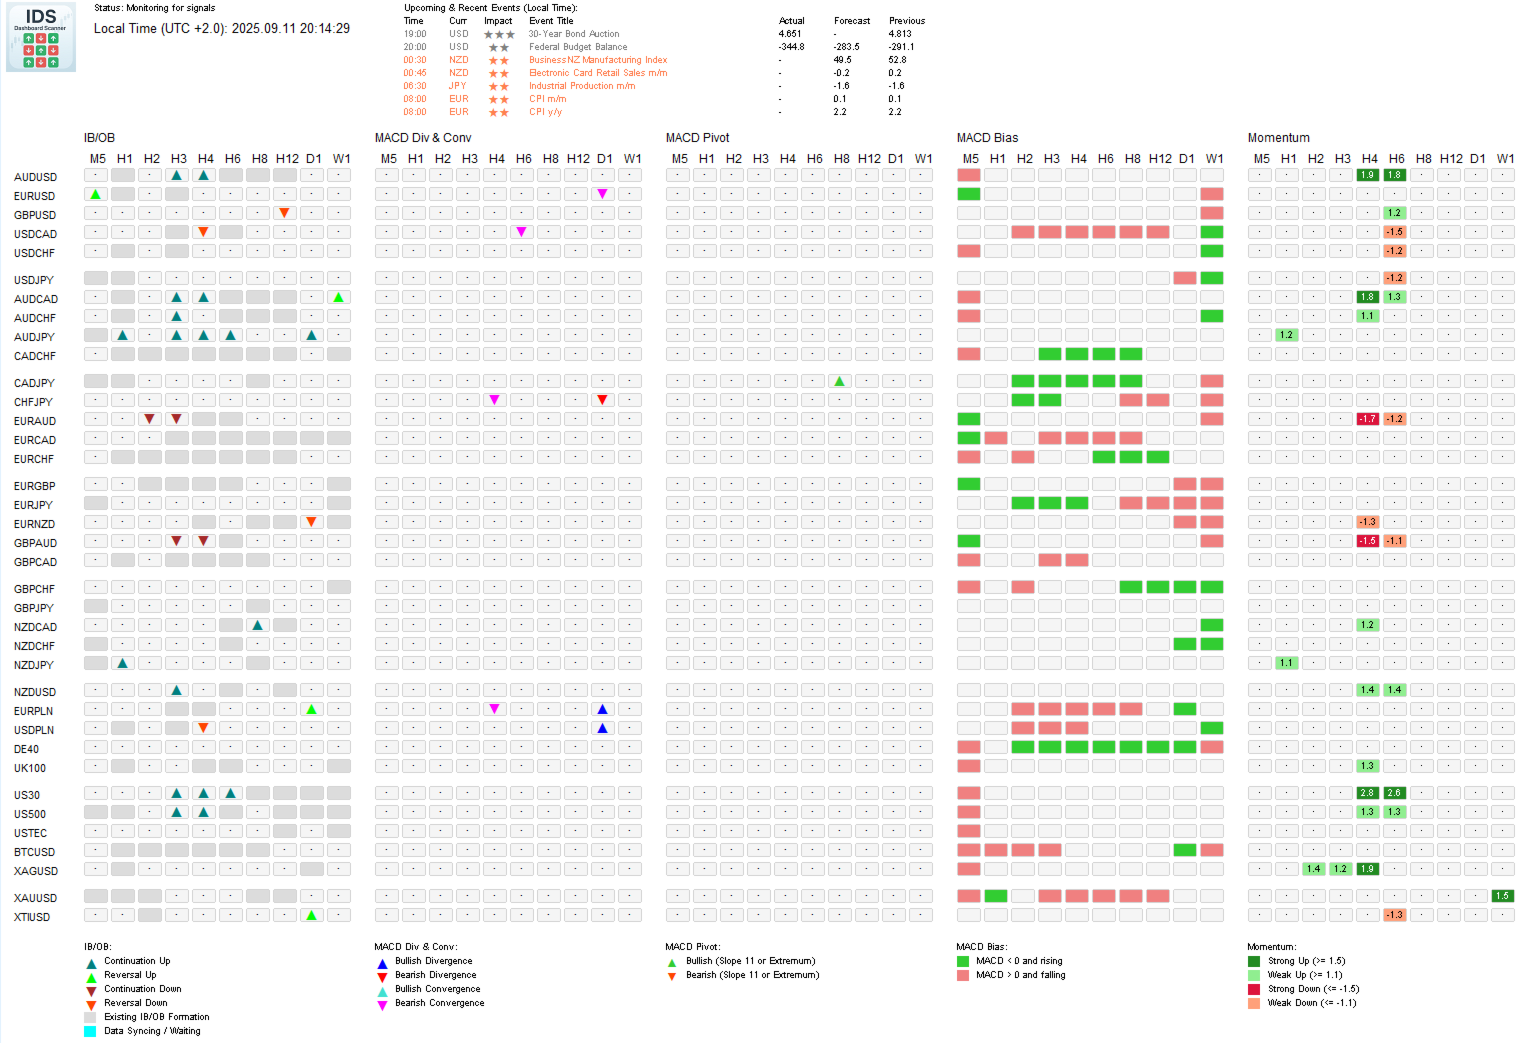
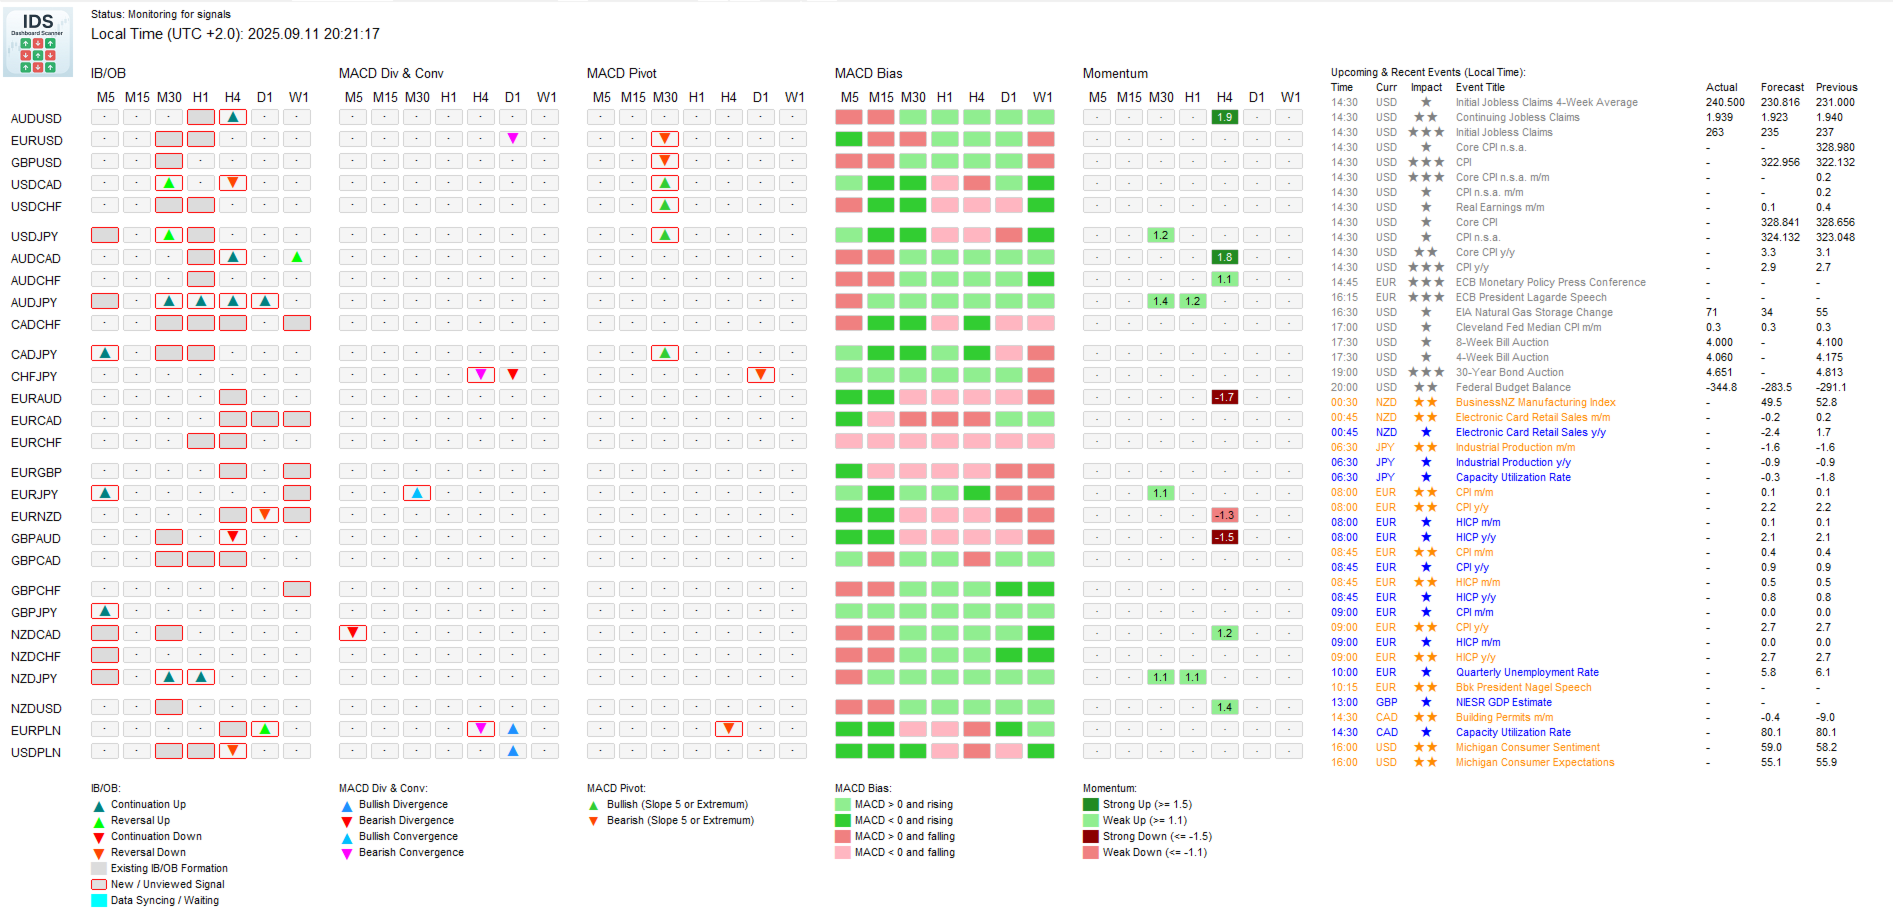
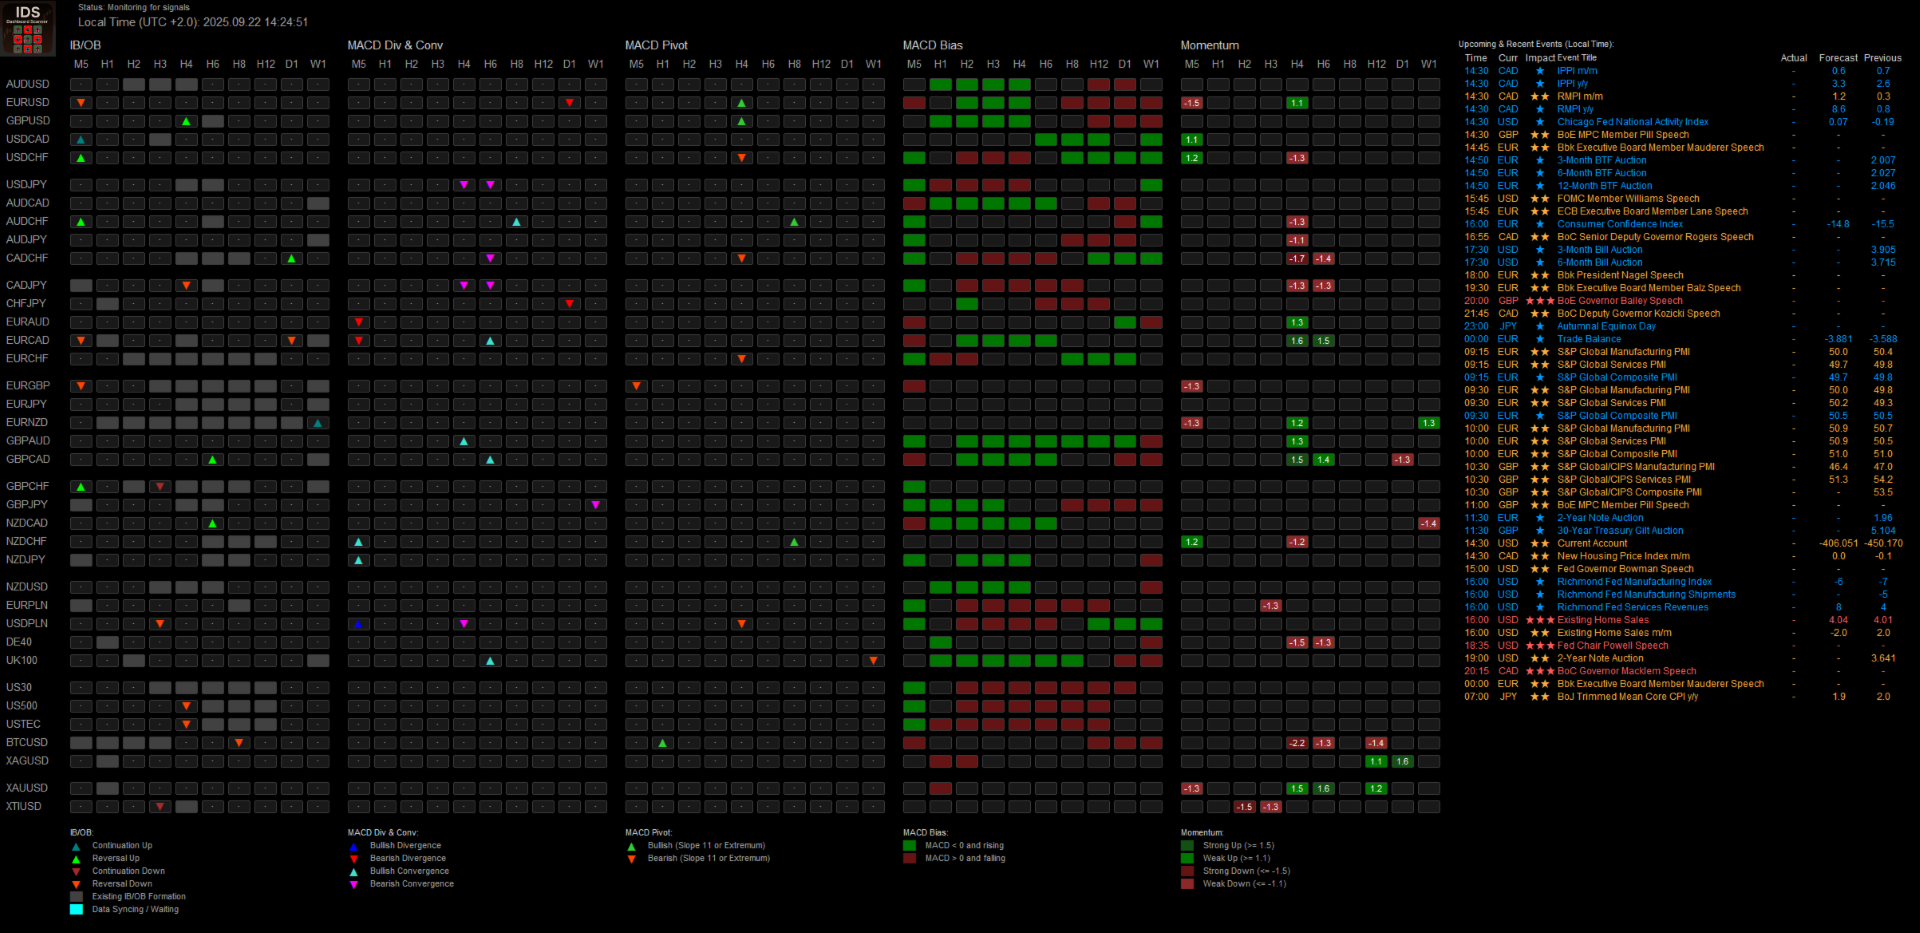
Scanning Modules Overview

  • Economic News Calendar
    Stay ahead of market-moving events with a fully integrated news module.

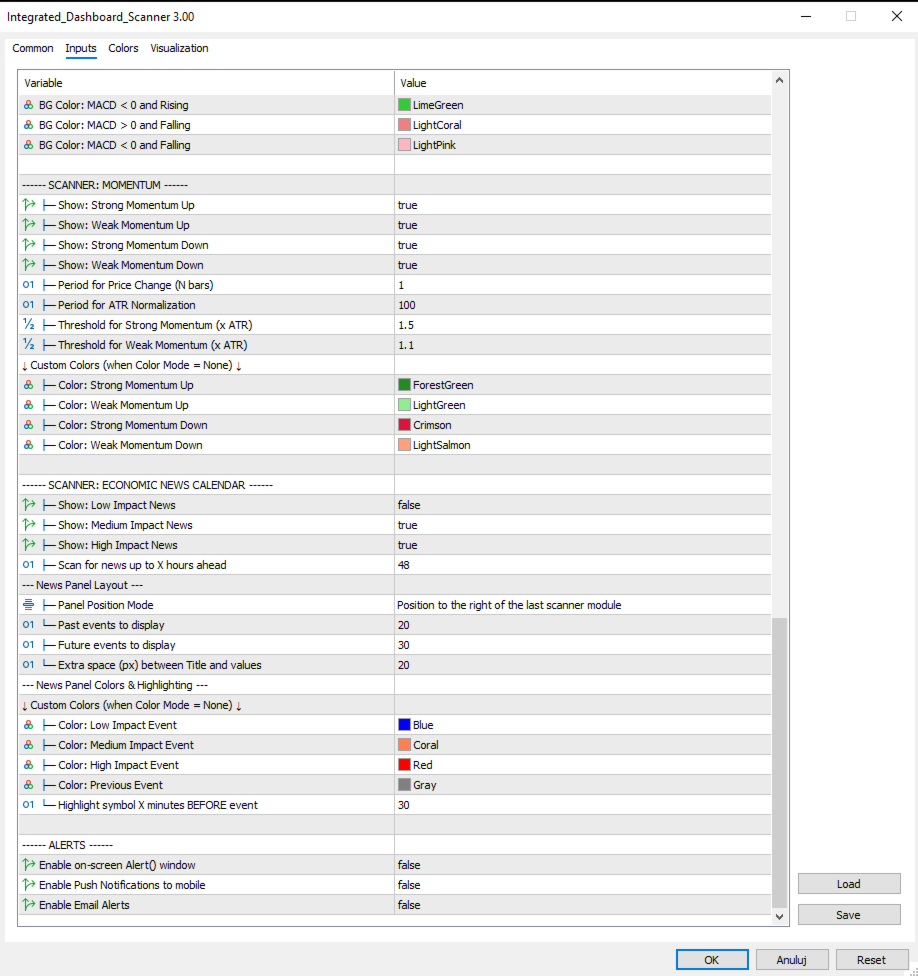
    • Automatic Event Scanning: Fetches upcoming economic events directly from the MQL5 calendar and displays them in a dedicated, on-screen panel.

    • Instrument Highlighting: The main dashboard grid will automatically highlight symbols that are about to be impacted by a news release, with a user-defined time window (e.g., 30 minutes before).

    • Customizable Filtering: Filter news by impact (Low, Medium, High) and control how many hours into the future the scanner should look for events.

  • Momentum Scanner
    Identify instruments with explosive price movement using a professional-grade momentum analysis module.

    • ATR-Normalized Momentum: Measures momentum as a factor of the Average True Range (ATR), providing a standardized value that can be compared across different symbols and timeframes.

    • Customizable Thresholds: Define your own thresholds for "Strong" and "Weak" momentum to precisely filter for the market conditions you want to trade.

    • At-a-glance Readings: The dashboard displays the calculated momentum value directly, allowing you to instantly gauge the strength of the current price move.

  • IB/OB Breakouts & Formations
    Detects Inside Bar and Outside Bar price patterns forming at key swing levels, then signals breakouts.

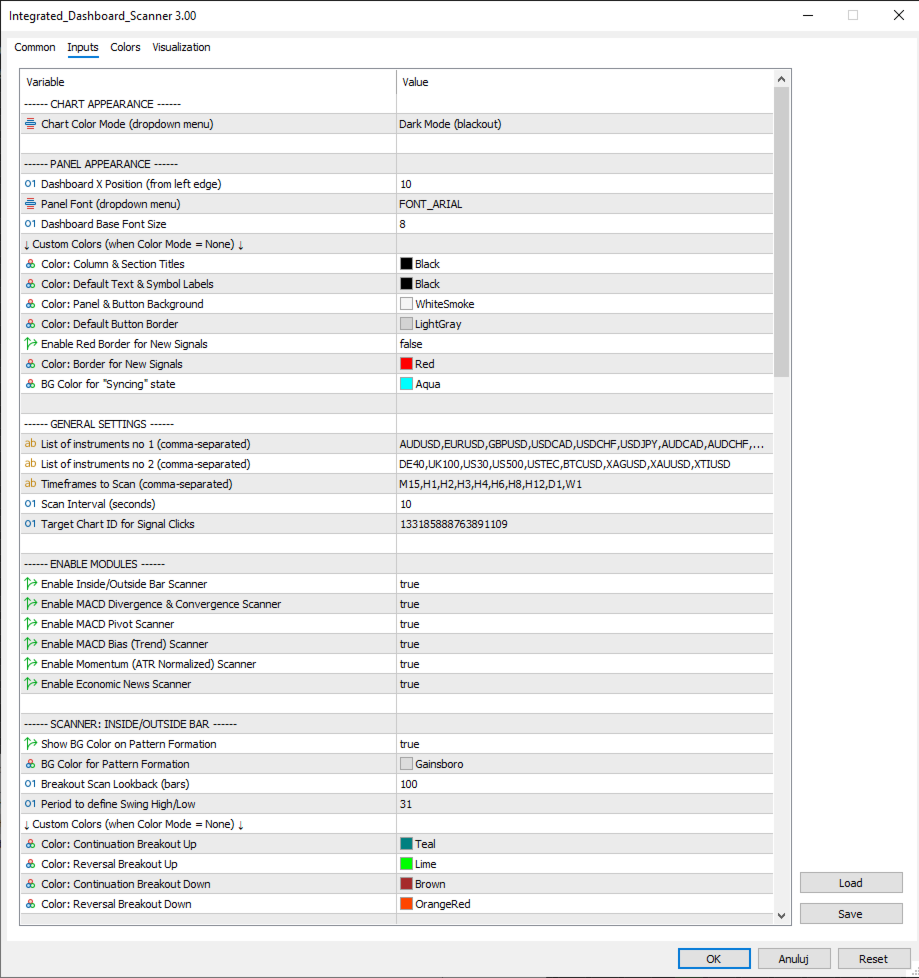
    • The "Period to define Swing High/Low" parameter (default 31) requires the mother bar to be the highest high or lowest low within the last 31 bars (or your chosen value).

    • Breakouts are classified visually as either continuation or reversal.

  • MACD Divergence & Convergence
    Monitors for both bullish and bearish signals:

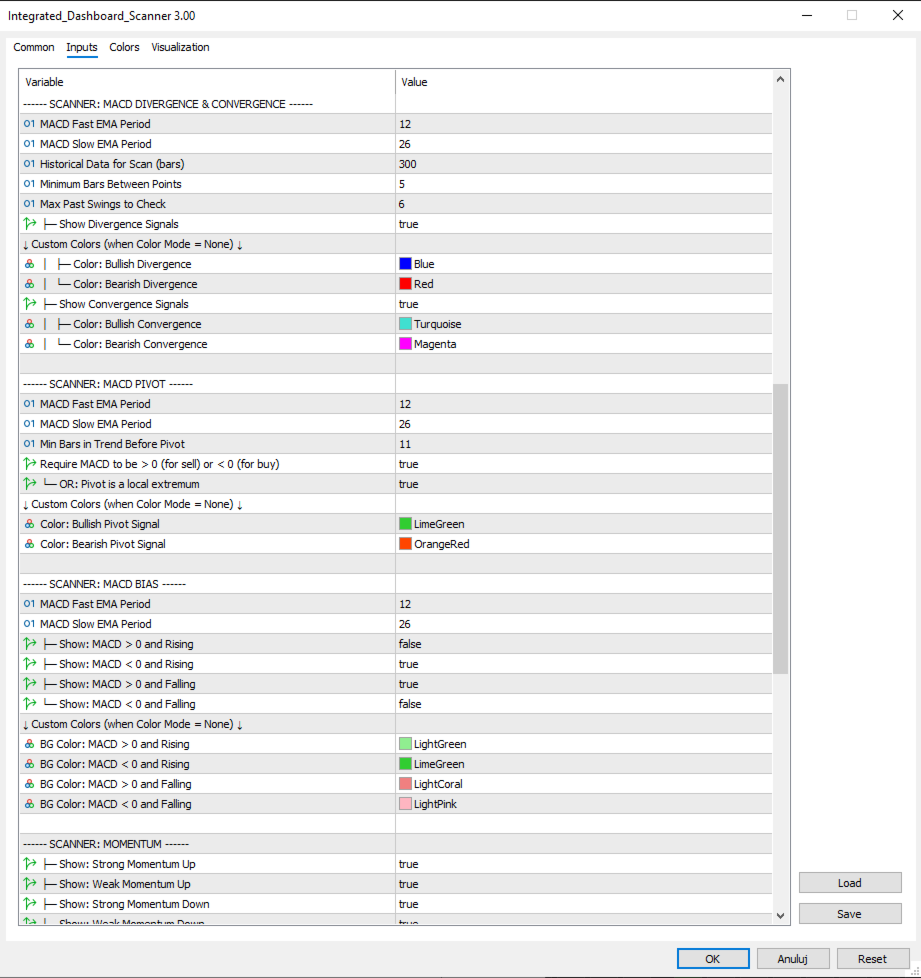
    • Divergence: Classic signal where price makes a new extreme but MACD does not, indicating potential reversal.

    • Convergence: Confirms trend strength when both price and MACD make higher highs/lows (bullish) or lower highs/lows (bearish).

    • You can enable/disable Divergence and Convergence signals independently and set unique colors for each.

    • The "Max Past Swings to Check" parameter (default 6) focuses the search on more recent and relevant setups.

  • MACD Pivot
    Identifies possible trend exhaustion and turning points by detecting MACD pivots after a defined sequence.

    • The "Min Bars in Trend Before Pivot" parameter (default 5) specifies the number of consecutive rising/falling MACD histogram bars required before a pivot qualifies as significant.

    • Helps you spot the earliest loss of momentum in impulsive moves.

  • MACD Bias
    Shows trend strength and direction at a glance using MACD’s current state.

    • Get granular control by choosing to display any combination of the four bias states (e.g., only show "Rising & Below Zero" and "Falling & Above Zero").

    • Background color instantly shows the selected bias conditions.

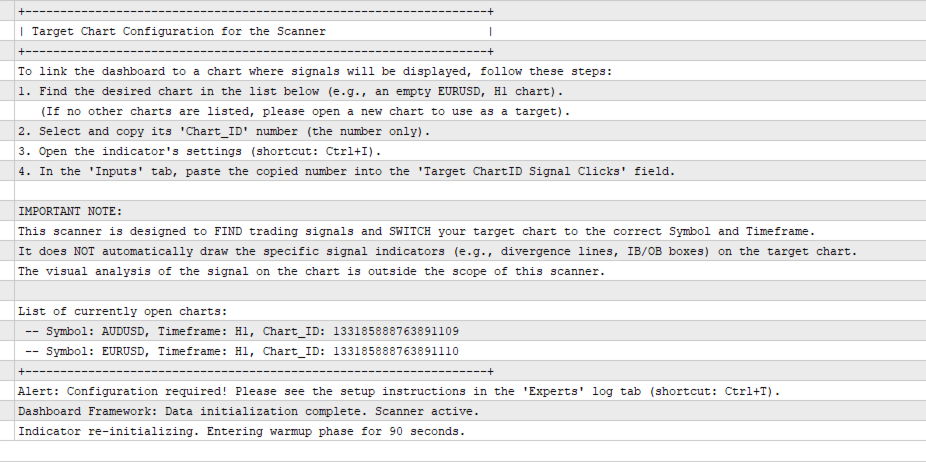
How to Use – Quick Setup

  1. Initial settings: Enter your desired symbols into the  InpSymbolList_FX  and/or  InpSymbolList_Other  fields, and your chosen timeframes in  TimeframeList .

  2. Target chart:

    • Open a blank chart and copy its Chart ID from the “Experts” log tab (Ctrl+T).

    • Paste this number into the  Target_ChartID  input in the indicator's settings.

    • Fully customize the target chart: load your favorite template, add other indicators. Whenever you click a dashboard signal, only the symbol and timeframe will change—your layout remains intact.

  3. Signal analysis: Simply click any dashboard button to jump instantly to the detected setup.

Important Note

The indicator does not draw extra objects (such as divergence lines) and does not execute trades. Alerts are primarily visual (icon, color, red border). Push and e-mail notifications are optional—configure them in the ALERTS section.

Advanced Features

  • An optional red border clearly marks each new, unviewed signal.

  • Robust Input Validation: The indicator checks all critical user inputs for logical errors upon loading, preventing unexpected behavior from misconfigured settings.

  • After clicking a signal, the indicator places an object with the signal comment on the target chart – making it easily accessible for your EA or trading automation.

  • Three-Phase Operation (New in v3.0): A seamless startup sequence featuring a non-blocking UI build, a rapid proactive data sync, followed by adaptive live scanning.

  • All new signals from the current scan cycle are consolidated into a single notification to avoid alert noise.

Full Control Over Settings

  • General: Set scan frequency and manage two separate symbol lists for better organization.

  • Modules: Enable or disable any of the six scanning modules.

  • Parameters: Fine-tune all logic, including MACD periods, IB/OB conditions, and the Momentum and News Calendar settings.

  • Panel: Choose between Light and Dark color modes, or set custom colors. Adjust position, fonts, and the "syncing" state color.

  • Alerts: Fully configure on-screen, push, and e-mail notifications as you prefer.

All scanner modules within Integrated Dashboard Scanner are designed to work in harmony, following the principles and framework of Dariusz Dargo’s trading strategy.

If you are able to open and monitor 384 charts at once—one for every symbol and timeframe—you probably don't need this scanner at all. For everyone else, the Integrated Dashboard Scanner lets you control the whole market with a single, clear panel.

Take command of the market with the Integrated Dashboard Scanner and reclaim hours of manual chart watching!

Recommended products
Fibrillar
Vitalii Zakharuk
It is very easy to use the Fibrillar indicator, since the simplest is to look at the chart and act according to the indications of the colored arrows. The algorithm takes into account the measurement of prices, and this method also focuses on measuring each of the price drops (H / C, H / O, LC, LO) - which gives more detailed information, but also more averaged. When calculating this indicator, logarithmic gains are first calculated at the closing price, which allows you to filter out the tren
The SyntheticaFX Boom & Crash Multi Indicator for MetaTrader 5 is an advanced trading tool designed to enhance your trading strategy by detecting potential spikes and analyzing market trends across various timeframes. This indicator is specifically tailored for the Crash and Boom indices, providing timely alerts and essential trend information to help you make informed trading decisions. Key Features: 1. Spike Detection:     - Identifies potential spikes on the following indices and timeframe
Binary Options Assistant (BOA) BOIL Signals Indicator provides signals based on Ana Trader Binary Options Strategy. Indicators: Stochastic Stop missing trades, stop jumping from chart to chart looking for trade set-ups and get all the signals on 1 chart! U se any of the BOA Signals Indicator with the  Binary Options Assistant (BOA) Multi Currency Dashboard .  All BOA Signal Indicator settings are adjustable to give you more strategy combinations. The signals can be seen visually and heard audi
Upper and Lower Reversal - Early forecasting system for reversal points. Allows you to find price reversal points on the boundaries of the upper and lower price movement channels. The indicator will never repaint or change the position of the signal arrows. Red arrows are a buy signal, Blue arrows are a sell signal. Adapts to any time frames and trading instruments The indicator does not repaint, it works only when the candle closes. There are several types of alerts for signals The indicator i
Deriv Boom sell
Yaovi Inoussa Atchou
Our BOOM SELL ALERT indicator is specifically engineered to   take candles on BOOM 1000 , BOOM 500 is tool is optimized for M1 (1-minute) timeframe, ensuring you receive timely and actionable insights.   The indicator is a combination of   many indicators. -        AO Oscillator -        Stochastic   HOW TO USE THIS INDICATOR To use well this indicator , it   need to use SCHAFF TREND RSX ( 5 MIN OR M5) IF SCHAFF trend RSX is GREEN and you have a signal then SELL when you have ENTRY and out with
This indicator belongs to the family of channel indicators. These channel indicator was created based on the principle that the market will always trade in a swinging like pattern. The swinging like pattern is caused by the existence of both the bulls and bears in a market. This causes a market to trade in a dynamic channel. it is designed to help the buyer to identify the levels at which the bulls are buying and the bear are selling. The bulls are buying when the Market is cheap and the bears a
Binary Options Assistant (BOA) BURN Signals Indicator provides signals based on Ana Trader Binary Options Strategy. Indicators: MACD & Stochastic Stop missing trades, stop jumping from chart to chart looking for trade set-ups and get all the signals on 1 chart! U se any of the BOA Signals Indicator with the  Binary Options Assistant (BOA) Multi Currency Dashboard .  All BOA Signal Indicator settings are adjustable to give you more strategy combinations. The signals can be seen visually and hear
Holiday Sales Zones Indicator The Zones Indicator is your everyday Trading tool that  leverages advanced algorithms, including ICT institutional concepts like order blocks , engulfing candle patterns , and Level interactions , to identify critical levels of supply and demand (Resistance & Support). Visual signals are generated and clearly marked on the chart, providing a straightforward guide for traders to spot key opportunities. Key Features Advanced Algorithmic Analysis : Identifies supply
Dynamic Velocity Oscillator Pro
AL MOOSAWI ABDULLAH JAFFER BAQER
Dynamic Velocity Oscillator Pro: See the Market's True Momentum Unlock a new level of market insight with the Dynamic Velocity Oscillator Pro, an advanced momentum indicator designed for the discerning trader who demands more than what traditional oscillators can offer. Are you tired of the lag, false signals, and whipsaws produced by standard momentum indicators? The Dynamic Velocity Oscillator Pro was built to solve this problem. It moves beyond simple price change calculations to measure the
Volatility Trend System - a trading system that gives signals for entries. The volatility system gives linear and point signals in the direction of the trend, as well as signals to exit it, without redrawing and delays. The trend indicator monitors the direction of the medium-term trend, shows the direction and its change. The signal indicator is based on changes in volatility and shows market entries. The indicator is equipped with several types of alerts. Can be applied to various trading ins
Trend indicator, a revolutionary unique solution for trend trading and filtering with all important trend features built into one tool! This is a 100% non-repainting multi-timeframe and multi-currency indicator that can be used on all currency pairs. HandleTrend is an effective trend following indicator that gives trend signals in the form of arrows on the chart.
This indicator has a unique support and resistance calculation program, which is a unique trading system. Index characteristics Imagine if you can accurately determine the important trading support and resistance areas and points in advance, how will your trading improve? Based on a unique calculation method, the indicator analyzes the trend, analyzes the current support and resistance, and obtains the current important support resistance and single direction, the calculated stop profit and sto
New Murrey Math Levels Indicator on MetaTrader 5 The New Murrey Math Levels Indicator applies a mathematical model to outline precise horizontal levels that represent balance points within market pricing on the MetaTrader 5 platform. These plotted levels range from +2/8 down to -2/8, each carrying a specific function within the market framework. Acting as adaptive zones, they often serve as potential turning points, active support/resistance lines, or indicators of overbought and oversold market
FREE
Binary Absorption
Bogdan Kupinsky
5 (1)
Бинарный индикатор находит свечной паттерн "Поглощение" и рисует соответствующий сигнал для входа рынок. Имеет встроенные фильтры и панель для просчета количества успешных сделок. Особенности Работает для всех валютных пар и любых таймфреймов. Индикатор рассматривает комбинацию из 2-х или 3-х свечей в зависимости от настроек. Имеется возможность фильтровать сигналы путем настройки количества свечей одного цвета (тренда) до образования паттерна. Присутствует панель для отображения точности си
The volatility scanner indicator is a tool that helps traders identify and analyze  volatility in all the market timeframes for the current chart. This way you can find potentially profitable trades on every timeframe for the current symbol. What It Does? Scan all timeframes to find a volatility contraction. Color the button yellow if there is a volatility squeeze at that timeframe. Clicking on the button instantly changes timeframe. How To Use It? Just put it on the chart and click on the yel
Boom tragos
David Chokumanyara
Boom Tragos – The Ultimate Boom Indices Scalping Indicator The Boom Tragos is a powerful scalping tool designed specifically for Boom 300, 500, 600, 900, and 1000 indices . Built for traders who want precision and consistency, this indicator helps you sell safely in Boom markets while avoiding unnecessary spikes. Timeframes: M1 and M5 Scalping Focus: Sell entries only on Boom Indices Safe Holding Power: M1: Hold trades for 60 – 120 candles while avoiding spikes M5: Capture 20 – 40 candl
BinaryPinMt5
Andrey Spiridonov
BinaryPinMt5 is an indicator developed and adapted specifically for trading short-term binary options. The indicator's algorithm, before issuing the signal, analyzes many factors, such as market volatility, searches for the PinBar pattern, calculates the probability of success when making a deal. The indicator is set in the usual way. The indicator itself consists of an information window where the name of the trading instrument is displayed, the probability of making a successful transaction,
Alien Scalper MTF
Gianfranco Piccolo
Rivoluziona il Tuo Trading con l'Indicatore di Segnali Scalping su Timeframe Multipli   Scopri il segreto del successo nel trading con il nostro esclusivo indicatore di SEGNALI scalping su timeframe multipli. Questo strumento avanzato è progettato per trovare segnali efficienti e precisi, aiutandoti a massimizzare i profitti e a ridurre i rischi associati al trading veloce L'indicatore di segnali Alien Scalper MTF è uno strumento di analisi tecnica altamente efficace, progettato per identificare
The Plasma Trend indicator is a simple technical indication that is used to determine the current trend direction in the market. The Plasma Trend indicator is a powerful tool for determining the direction of the trend in the Forex market. It is based on both standard technical indicators and proprietary mathematical calculations, which provides a more accurate and reliable trend determination. Its implementation in the form of lines of two colors simplifies the visual determination of a change
Apex Arrows MQL5
German Pablo Gori
# Apex Arrows – Professional Trading Signals Indicator ## General Description **Apex Arrows** is a powerful technical indicator specifically designed for advanced traders seeking accurate and automated real-time signals. This indicator combines multiple technical strategies into a single visually intuitive tool, ideal for trading markets such as forex, indices, and commodities on the **MetaTrader 4/5** platform. Based on Exponential Moving Averages (EMA), RSI, Stochastic, ADX, and auto
Consolidation Zone MT5
Suvashish Halder
5 (4)
Consolidation Zone   Indicator is a powerful tool designed for traders to identify and capitalize on consolidation patterns in the market. This innovative indicator detects consolidation areas and provides timely alerts when the price breaks above or below these zones, enabling traders to make informed trading decisions. MT4 Version :  https://www.mql5.com/en/market/product/118734 Join To Learn Market Depth -   https://www.mql5.com/en/channels/suvashishfx Key Features: 1.   Consolidation Det
FREE
Easy Buy Sell is a market indicator for opening and closing positions. It becomes easy to track market entries with alerts. It indicates trend reversal points when a price reaches extreme values ​​and the most favorable time to enter the market. it is as effective as a Fibonacci to find a level but it uses different tools such as an algorithm based on ATR indicators and Stochastic Oscillator. You can modify these two parameters as you wish to adapt the settings to the desired period. It cannot
Powerful Hidden Cross Signal
Ellan Dirgantara Tholkhah
The latest most requested Binary Options arrow indicator in the Garuda Signals product line is now on MT5! Binary options signal based on multiple time frame cross over analysis. Gets confirmation from the most consistent signals known to man; Ichimoku, SMA, Bollinger Bands; and also uses the 1 Hour time frame as trend confirmation , so you don't have to open up multiple chart and waste time. - Can be used for all time frames up to 1 hour, but is most POWERFUL for 1 and 5 min options. - Place yo
Liquidity Oscillator
Paolo Scopazzo
3 (2)
A powerful oscillator that provide Buy and Sell signals by calculating the investor liquidity. The more liquidity the more buy possibilities. The less liquidity the more sell possibilities. Please download the demo and run a backtest! HOW IT WORKS: The oscillator will put buy and sell arrow on the chart in runtime only . Top value is 95 to 100 -> Investors are ready to buy and you should follow. Bottom value is 5 to 0 -> Investors are ready to sell and you should follow. Alert + sound will appe
Buy Sell Storm
Aleksandr Makarov
Buy Sell Storm Professional indicator for trading on financial markets, designed for MT5 platform . Trading on the indicator is very simple, Blue arrow to buy , Red arrow to sell. Special offer -  https://www.mql5.com/en/users/bossik2810 The indicator does not redraw and does not change its values. ( see the video of the EA on the indicator). In the default settings the Period parameter is set to - 1 You can change this parameter for more accurate signals. If you have any questions
Multi-Timeframe Moving Average Indicator Unlock a deeper understanding of market trends with the Multi-Timeframe Moving Average Indicator. This powerful MQL5 tool allows you to visualize moving averages from five different timeframes simultaneously on a single chart. Gain comprehensive insights into price dynamics across various perspectives without cluttering your workspace with multiple indicator instances. Key Features: Multi-Timeframe Analysis: Display up to five moving averages from differ
Hello There, Today I want to show you my new researchable fore BUY SELL indicator, it work all asset, and also work Derive Volatility asset! it work all time frame, but i recommend start 5 minute to H1 when you receive a signal just take trade and stay wait for your take profit asset All Major Pair And minor IT WORK ALSO XAUUSD Fantastic results,  for more info,,, message us thank you   
A tool for creating Bill Williams indicators Our tool provides the ability to set Bill Williams indicators on a chart with a mouse click. - The Awesome Oscillator (AO) indicator helps to assess the driving force of the trend. - Alligator indicator — determines the current state of the trend and possible entry and exit points. - Fractals indicator — helps to identify significant levels  - Accelerator Oscillator (AC) indicator — shows the change in trend acceleration. - Market Facilitation Index
FREE
Scalping and Binary Signal Detector - Scalping indicator that gives directional signals for opening positions along the trend. The indicator is a complete trading system that can be used for Forex and binary options. The system of algorithms allows you to recognize intense price movements in several consecutive bars. The indicator provides several types of alerts for arrows. Works on any trading instruments and time frames (M5 or Higher recommended). How to use for trading The appearance of a
Range Directional Force Indicator – Designed for You to Optimize! The Range Directional Force Indicator is a cutting-edge tool designed to empower traders by visualizing market dynamics and directional strength. Built to offer insights into market trends and reversals, this indicator is an invaluable asset for traders seeking precision in their strategies. However, it is important to note that this indicator is not optimized, leaving room for you to tailor it to your unique trading preferences.
Buyers of this product also purchase
Divergence Bomber
Ihor Otkydach
4.98 (65)
Each buyer of this indicator also receives the following for free: The custom utility "Bomber Utility", which automatically manages every trade, sets Stop Loss and Take Profit levels, and closes trades according to the rules of this strategy Set files for configuring the indicator for various assets Set files for configuring Bomber Utility in the following modes: "Minimum Risk", "Balanced Risk", and "Wait-and-See Strategy" A step-by-step video manual to help you quickly install, configure, and s
How many times have you bought a trading indicator with great back-tests, live account performance proof with fantastic numbers and stats all over the place but after using it, you end up blowing your account? You shouldn't trust a signal by itself, you need to know why it appeared in the first place, and that's what RelicusRoad Pro does best! User Manual + Strategies + Training Videos + Private Group with VIP Access + Mobile Version Available A New Way To Look At The Market RelicusRoad is the
Grabber System MT5
Ihor Otkydach
5 (15)
Let me introduce you to an excellent technical indicator – Grabber, which works as a ready-to-use "All-Inclusive" trading strategy. Within a single code, it integrates powerful tools for technical market analysis, trading signals (arrows), alert functions, and push notifications. Every buyer of this indicator also receives the following for free: Grabber Utility for automatic management of open orders Step-by-step video guide: how to install, configure, and trade with the indicator Custom set fi
Algo Pumping
Ihor Otkydach
4.74 (19)
PUMPING STATION – Your Personal All-inclusive strategy Introducing PUMPING STATION — a revolutionary Forex indicator that will transform your trading into an exciting and effective activity! This indicator is not just an assistant but a full-fledged trading system with powerful algorithms that will help you start trading more stable! When you purchase this product, you also get FOR FREE: Exclusive Set Files: For automatic setup and maximum performance. Step-by-step video manual: Learn how to tr
TPSproTREND PrO MT5
Roman Podpora
4.72 (18)
Entry points at the bar close,  without redrawing .  Trend scanner  across all assets,  MTF - mode  and much more in one tool. We recommend using it together with   RFI LEVELS. ИНСТРУКЦИЯ RUS   /   INSTRUCTIONS  ENG         /         VERSION MT4   Main functions: Accurate entry signals WITHOUT REPAINTING! Once a signal appears, it remains valid! This is a significant distinction from repainting indicators that might provide a signal and then alter it, potentially leading to deposit losses. Now,
TPSpro RFI Levels MT5
Roman Podpora
4.53 (19)
Reversal zones - levels / Active zones of a major player INSTRUCTIONS RUS   /   INSTRUCTIONS   ENG   /   Version MT4 EVERY BUYER OF THIS INDICATOR       GET ADDITIONALLY   FOR FREE   : 3 months       access to trading signals from the service       RFI SIGNALS       — ready-made entry points according to the TPSproSYSTEM algorithm. 3 months       access to training materials with regular updates - immersion in strategy and professional growth. 24/5 support on weekdays and access to a closed tra
AriX
Temirlan Kdyrkhan
1 (2)
AriX Indicator for MT5 A powerful trend-following and signal-evaluation tool AriX is a custom MT5 indicator that combines Moving Averages and ATR-based risk/reward logic to generate clear buy/sell signals. It visualizes dynamic SL/TP levels, evaluates past trade outcomes, and displays win/loss statistics in a clean on-chart panel. Key features include: Buy/Sell signals based on MA crossovers ATR-based SL/TP1/TP2/TP3 levels with visual lines and labels Signal outcome tracking with real-time stat
Quantum TrendPulse
Bogdan Ion Puscasu
5 (16)
Introducing Quantum TrendPulse , the ultimate trading tool that combines the power of SuperTrend , RSI , and Stochastic into one comprehensive indicator to maximize your trading potential. Designed for traders who seek precision and efficiency, this indicator helps you identify market trends, momentum shifts, and optimal entry and exit points with confidence. Key Features: SuperTrend Integration: Easily follow the prevailing market trend and ride the wave of profitability. RSI Precision: Detect
MTF Supply Demand Zones MT5
Georgios Kalomoiropoulos
5 (1)
Next Generation Of Automated Supply And Demand Zones. New and Innovative Algorithm that Works At Any Chart. All Zones Are Being Created Dynamically According To Price Action Of The Market. AMAZING OFFER --> Activations from 5 to 20 for "MTF Supply Demand Zones" and "Automated Trendlines" TWO TYPES OF ALERTS -->  1) WHEN PRICE HITS A ZONE    2)WHEN A NEW ZONE IS FORMED  If you get the MTF Supply Demand Zones you can join the " Trade Like Me " Video Series. It contains 14 Live Sessions where 
The " Dynamic Scalper System MT5 " indicator is designed for the scalping method of trading within trend waves. Tested on major currency pairs and gold, compatibility with other trading instruments is possible. Provides signals for short-term opening of positions along the trend with additional price movement support. The principle of the indicator. Large arrows determine the trend direction. An algorithm for generating signals for scalping in the form of small arrows operates within trend wav
ARICoins
Temirlan Kdyrkhan
ARICoin is a powerful trading companion designed to generate high-probability entry signals with dynamic TP/SL/DP levels based on volatility. Built-in performance tracking shows win/loss stats, PP1/PP2 hits, and success rates all updated live. Key Features: Buy/Sell signals with adaptive volatility bands Real-time TP/SL/DP levels based on ATR Built-in MA Filter with optional ATR/StdDev volatility Performance stats panel (Success, Profit/Loss, PP1/PP2) Alerts via popup, sound, push, or email Cust
ACB Breakout Arrows MT5
KEENBASE SOFTWARE SOLUTIONS
5 (1)
The ACB Breakout Arrows indicator provides a crucial entry signal in the market by detecting a special breakout pattern. The indicator constantly scans the chart for a settling momentum in one direction and provide the accurate entry signal right before the major move. Get multi-symbol and multi-timeframe scanner from here - Scanner for ACB Breakout Arrows MT 5 Key features Stoploss   and Take Profit levels are provided by the indicator. Comes with a MTF Scanner dashboard which tracks the brea
ARIPoint
Temirlan Kdyrkhan
ARIPoint is a powerful trading companion designed to generate high-probability entry signals with dynamic TP/SL/DP levels based on volatility. Built-in performance tracking shows win/loss stats, PP1/PP2 hits, and success rates all updated live. Key Features: Buy/Sell signals with adaptive volatility bands Real-time TP/SL/DP levels based on ATR Built-in MA Filter with optional ATR/StdDev volatility Performance stats panel (Success, Profit/Loss, PP1/PP2) Alerts via popup, sound, push, or email Cu
ARIScalping
Temirlan Kdyrkhan
ARIScalp is a powerful trading companion designed to generate high-probability entry signals with dynamic TP/SL/DP levels based on volatility. Built-in performance tracking shows win/loss stats, PP1/PP2 hits, and success rates all updated live. Key Features: Buy/Sell signals with adaptive volatility bands Real-time TP/SL/DP levels based on ATR Built-in MA Filter with optional ATR/StdDev volatility Performance stats panel (Success, Profit/Loss, PP1/PP2) Alerts via popup, sound, push, or email Cus
Weltrade Spike Sentinel
Batsirayi L Marango
5 (1)
Introducing Indicator for PainX and GainX Indices Traders on Weltrade Get ready to experience the power of trading with our indicator, specifically designed for Weltrade   broker's PainX and GainX Indices.  Advanced Strategies for Unbeatable Insights Our indicator employs sophisticated strategies to analyze market trends, pinpointing optimal entry and exit points.  Optimized for Maximum Performance To ensure optimal results, our indicator is carefully calibrated for 5-minute timeframe charts on
PZ Divergence Trading MT5
PZ TRADING SLU
3.71 (7)
Unlock hidden profits: accurate divergence trading for all markets Tricky to find and scarce in frequency, divergences are one of the most reliable trading scenarios. This indicator finds and scans for regular and hidden divergences automatically using your favourite oscillator. [ Installation Guide | Update Guide | Troubleshooting | FAQ | All Products ] Easy to trade Finds regular and hidden divergences Supports many well known oscillators Implements trading signals based on breakouts Displays
MetaForecast M5
Vahidreza Heidar Gholami
5 (3)
MetaForecast predicts and visualizes the future of any market using different powerful methods. While financial markets are not always predictable, if there are patterns in the past data, MetaForecast can learn and predict the future as accurately as possible. It features a complete implementation of neural networks embedded directly into the indicator, enabling traders to create and train AI models using data from multiple symbols to learn complex patterns. MetaForecast leverages your computer'
PZ Day Trading MT5
PZ TRADING SLU
2.83 (6)
Effortless trading: non-repainting indicator for accurate price reversals This indicator detects price reversals in a zig-zag fashion, using only price action analysis and a donchian channel. It has been specifically designed for short-term trading, without repainting or backpainting at all. It is a fantastic tool for shrewd traders aiming to increase the timing of their operations. [ Installation Guide | Update Guide | Troubleshooting | FAQ | All Products ] Amazingly easy to trade It provides
Best Solution for any Newbie or Expert Trader! This Indicator is a unique, high quality and affordable trading tool because we have incorporated a number of proprietary features and a new formula. With only ONE chart you can read Currency Strength for 28 Forex pairs! Imagine how your trading will improve because you are able to pinpoint the exact trigger point of a new trend or scalping opportunity? User manual:   click here That's the first one, the original! Don't buy a worthless wannabe clone
Advanced Supply Demand MT5
Bernhard Schweigert
4.5 (14)
Best Solution for any Newbie or Expert Trader! This indicator is a unique, high quality and affordable trading tool because we have incorporated a number of proprietary features and a new formula. With this update, you will be able to show double timeframe zones. You will not only be able to show a higher TF but to show both, the chart TF, PLUS the higher TF: SHOWING NESTED ZONES. All Supply Demand traders will love it. :) Important Information Revealed Maximize the potential of Advanced Supply
Berma Bands
Muhammad Elbermawi
5 (7)
The Berma Bands (BBs) indicator is a valuable tool for traders seeking to identify and capitalize on market trends. By analyzing the relationship between the price and the BBs, traders can discern whether a market is in a trending or ranging phase. Visit the [ Berma Home Blog ] to know more. Berma Bands are composed of three distinct lines: the Upper Berma Band, the Middle Berma Band, and the Lower Berma Band. These lines are plotted around the price, creating a visual representation of the pric
Big Player Range
Thalles Nascimento De Carvalho
5 (3)
BigPlayerRange — Best Indicator for Micro Index and Micro Dollar | MT5 Unlock the power of BigPlayerRange , widely recognized as the best institutional indicator for the micro index and micro dollar on MetaTrader 5. This powerful tool highlights strategic zones of institutional activity, providing ultra-precise market structure insights. How It Works: BigPlayerRange draws two horizontal zones based on institutional volume action: Green Zone — Where institutional buyers defend the price.
Candle hunter
Ruslan Khasanov
5 (1)
Indicator for graphical analysis. Marks the main Japanese candlestick patterns on the chart. At the moment, the following set of patterns is available to the trader:  - Bearish/Bullish Abandoned Baby;  - Bearish Advance Block;  - Bearish Deliberation;  - Bearish/Bullish Belt Hold;  - Bearish/Bullish Engulfing;  - Bearish Shooting Star;  - Bearish Evening Star;  - Bearish Evening Doji Star;  - Bearish/Bullish Doji Star;    - Bearish/Bullish Tri-Star;  - Bearish Hanging Man;  - Bearish/Bullish Ha
Meta Cipher B
SILICON HALLWAY PTY LTD
Meta Cipher B: The All-in-One Oscillator Suite for MT5 Meta Cipher B brings the popular Market Cipher B concept to MetaTrader 5, optimised for speed and precision. Built from the ground up for performance, it delivers professional-grade signals without lag or sluggish scrolling. What it does A unified oscillator stack that visualises Wave momentum, VWAP, Money Flow, RSI and Stochastic. Clean Buy and Sell dots appear when conditions align. Use it on small timeframes for timing, and on high
Introducing   Quantum Breakout PRO , the groundbreaking MQL5 Indicator that's transforming the way you trade Breakout Zones! Developed by a team of experienced traders with trading experience of over 13 years,   Quantum Breakout PRO   is designed to propel your trading journey to new heights with its innovative and dynamic breakout zone strategy. Quantum Breakout Indicator will give you signal arrows on breakout zones with 5 profit target zones and stop loss suggestion based on the breakout b
Trade smarter, not harder: Empower your trading with Harmonacci Patterns This is arguably the most complete harmonic price formation auto-recognition indicator you can find for the MetaTrader Platform. It detects 19 different patterns, takes fibonacci projections as seriously as you do, displays the Potential Reversal Zone (PRZ) and finds suitable stop-loss and take-profit levels. [ Installation Guide | Update Guide | Troubleshooting | FAQ | All Products ] It detects 19 different harmonic pri
PZ Trend Trading MT5
PZ TRADING SLU
3.8 (5)
Capture every opportunity: your go-to indicator for profitable trend trading Trend Trading is an indicator designed to profit as much as possible from trends taking place in the market, by timing pullbacks and breakouts. It finds trading opportunities by analyzing what the price is doing during established trends. [ Installation Guide | Update Guide | Troubleshooting | FAQ | All Products ] Trade financial markets with confidence and efficiency Profit from established trends without getting whip
Trend Forecaster
Alexey Minkov
5 (7)
The Trend Forecaster indicator utilizes a unique proprietary algorithm to determine entry points for a breakout trading strategy. The indicator identifies price clusters, analyzes price movement near levels, and provides a signal when the price breaks through a level. The Trend Forecaster indicator is suitable for all financial assets, including currencies (Forex), metals, stocks, indices, and cryptocurrencies. You can also adjust the indicator to work on any time frames, although it is recommen
Bill Williams Advanced
Siarhei Vashchylka
5 (10)
Bill Williams Advanced is designed for automatic chart analysis using Bill Williams' "Profitunity" system. The indicator analyzes four timeframes at once. Manual (Be sure to read before purchasing) Advantages 1. Automatically analyzes the chart using the "Profitunity" system of Bill Williams. The found signals are placed in a table in the corner of the screen. 2. Equipped with a trend filter based on the Alligator indicator. Most of the system signals are recommended to be used only according t
Weis Wave with Alert MT5
Trade The Volume Waves Single Member P.C.
4.94 (16)
Rental/Lifetime Package Options and Privileges  Rent Monthly Six Months   Yearly/Lifetime Weis Wave with Speed with Alert+Speed Index x x x Manual  x x x Quick Set up Video x x x Blog x x x Lifetime Updates x x x Setup and Training Material x x Discord Access Channel "The SI traders"          x Rectangle Break Alert Tool      x How to trade with it:    http://www.tradethevolumewaves.com   ** If you purchase please contact me to setup your  : Training Room and  complete manual access.  Wei
More from author
The First Red MT5
Krzysztof Janusz Stankiewic
1. Introduction The “First Red” Indicator is a tool designed to pinpoint dynamic market turning points by combining local price extremes with signals from the MACD (Moving Average Convergence Divergence) oscillator. Based on Dariusz Dargo’s original concept, it marks specific candles on your chart that meet the conditions of the “First Red” setup or its related variants—“Second Red,” “First Green,” and “Second Green.” These classifications let traders see at a glance when momentum may be shifti
MT4 Macd Divergence Scanner
Krzysztof Janusz Stankiewic
This indicator provides an efficient way to monitor multiple currency pairs and timeframes simultaneously. By visually displaying price-MACD divergences in a structured, easy-to-read table, it allows traders to detect potential market turning points without constantly switching between charts. Divergences can signal either bullish or bearish momentum shifts. For instance, a bearish divergence occurs when the price reaches a new high, but the MACD fails to confirm this with a corresponding higher
MACD Divergence and TFR for MT5
Krzysztof Janusz Stankiewic
5 (1)
The indicator identifies divergence by analyzing the slopes of lines connecting price and MACD histogram peaks or troughs. Bullish Divergence (Convergence): Occurs when the lines connecting MACD troughs and corresponding price troughs have opposite slopes and are converging. Bearish Divergence: Occurs when the lines connecting MACD peaks and corresponding price peaks have opposite slopes and are diverging. When a divergence signal is detected, the indicator marks the chart with dots at the pric
Supply Demand FVG Zones
Krzysztof Janusz Stankiewic
5 (1)
Supply or demand zones refer to price areas where a significant amount of supply or demand had previously entered the market, causing prices to either fall or rise. If the price returns to the demand or supply zone, it is likely to bounce off due to the large number of orders previously placed within the zone. These orders will be defended in these areas. The Fair Value Gap (FVG) is a concept used to identify imbalances in the equilibrium of buying and selling. Fair Value Gaps are formed in a t
Supply Demand Ranger
Krzysztof Janusz Stankiewic
5 (4)
The indicator draws supply and demand zones. The zone timeframe can be set independently of the chart timeframe. For instance, it is possible to set M5 zones on an H4 chart. The importance of zones can be adjusted using the zone strength parameter. Demand zones are displayed if at least one candle in the range of the zone is entirely above the zone. Similarly, supply zones are displayed if at least one candle within the zone is entirely below the zone.
Supply Demand FVG
Krzysztof Janusz Stankiewic
3 (2)
The indicator offers a comprehensive suite of features for identifying key market areas, including: Supply Zones Demand Zones Fair Value Gaps (FVG) and provides alerts whenever price reaches a supply or demand zone. Key Features: Historical Zones: In addition to active zones, the indicator now includes historical supply, demand, and FVG zones, allowing for a deeper analysis of past price behavior. Flexible Zone Timeframes: Zones can be plotted independently of the chart's timeframe, enabling sce
Purpose of the Inside Bar and Outside Bar Breakout Scanner Indicator: The Inside Bar & Outside Bar Breakout Scanner  is an advanced dashboard designed to scan multiple instruments and timeframes simultaneously. Its primary function is to identify two powerful candlestick patterns—the  Inside Bar (IB)  and the  Outside Bar (OB) —and then to detect and classify breakouts from these formations. The indicator presents its findings in a clean, organized table, signaling potential trend continuation o
Symbol
Krzysztof Janusz Stankiewic
For those who monitor charts from afar, this utility is essential. It displays the chart symbol, time frame, and bid price as text. Users can adjust the text position, color, and font size. It’s also a useful tool for forex video publishers. There will be no more complaints about which symbol and time frame are displayed on the screen, even if the content is viewed on a phone. Symbol prefixes such as “_ecn” or “_stp” can be removed from the displayed symbol.
FREE
MACD Divergence and TFR for MT4
Krzysztof Janusz Stankiewic
5 (1)
The indicator identifies divergence by analyzing the slopes of lines connecting price and MACD histogram peaks or troughs. Bullish Divergence (Convergence): Occurs when the lines connecting MACD troughs and corresponding price troughs have opposite slopes and are converging. Bearish Divergence: Occurs when the lines connecting MACD peaks and corresponding price peaks have opposite slopes and are diverging. When a divergence signal is detected, the indicator marks the chart with dots at the pric
The First Red MT4
Krzysztof Janusz Stankiewic
1. Introduction The “First Red” Indicator is a tool designed to pinpoint dynamic market turning points by combining local price extremes with signals from the MACD (Moving Average Convergence Divergence) oscillator. Based on Dariusz Dargo’s original concept, it marks specific candles on your chart that meet the conditions of the “First Red” setup or its related variants—“Second Red,” “First Green,” and “Second Green.” These classifications let traders see at a glance when momentum may be shifti
MT5 Macd Divergence Scanner
Krzysztof Janusz Stankiewic
This indicator helps you monitor multiple currency pairs and timeframes all at once. It displays the occurrence of divergences between price and the MACD indicator in a clear and easy-to-read table. Monitoring multiple timeframes and currency pairs in one place helps traders identify a divergence without needing to switch between charts. Divergences can be bullish or bearish. For example, if the price forms a higher high while the MACD forms a lower high, this indicates bearish divergence. On th
Filter:
No reviews
Reply to review